
At diagnosis 80 of patients will present with metastasis Only 20 of these cases are clinically detectable Current imaging modalities are expensive and only detect established secondary tumors ID: 917616
Download Presentation The PPT/PDF document "Background Osteosarcoma OS is the most c..." is the property of its rightful owner. Permission is granted to download and print the materials on this web site for personal, non-commercial use only, and to display it on your personal computer provided you do not modify the materials and that you retain all copyright notices contained in the materials. By downloading content from our website, you accept the terms of this agreement.


![Brain Tumor 101 Presented by [NAME]](https://thumbs.docslides.com/775177/brain-tumor-101-presented-by-name.jpg)


Slide1
Background
OsteosarcomaOS is the most common primary bone tumor and the third leading cause of pediatric cancer deaths.At diagnosis 80% of patients will present with metastasis.Only 20% of these cases are clinically detectable.Current imaging modalities are expensive and only detect established secondary tumors.There is a need for novel diagnostics to detect early stage OS metastasis Cancer Metastasis Tumor cells detach from the primary tumor and intravasate into the vasculature to seed at distance sites.Circulating tumor cells (CTCs) are present in the peripheral blood of patients with pre-clinical metastatic tumors. Circulating Tumor Cell DetectionLiquid biopsies are a novel alternative to current diagnostic imaging systems to monitor metastatic incidence and treatment efficacy. FDA approved CTC detection methods utilize Epithelial cell adhesion molecule (EpCAM) as a cell surface marker for carcinomas such as breast, prostate and colorectal cancer.EpCAM may not be a reliable cell surface marker in OS [1].
Using
a combination of Gangliosides and Cell Surface
Vimentin
as surface biomarkers for isolating Osteosarcoma Cells
Fasanya, HO.
1
, Dopico, PJ.2, Yeager, Z.2, Fan, ZH.2, Siemann, DW1. 1 Department of Radiation Oncology, University of Florida Health Cancer Center 2 Department of Mechanical and Aerospace Engineering, Hebert Wertheim College of Engineering University of Florida Clinical and Translational Institute, Gainesville, FL 32610 Email: hfasanya@ufl.edu; ufpablo@ufl.edu
Research reported in this publication was supported by the National Center for Advancing Translational Sciences of the National Institutes of Health under University of Florida Clinical and Translational Science Awards TL1TR001428, KL2TR001429 and UL1TR001427
Team Objective
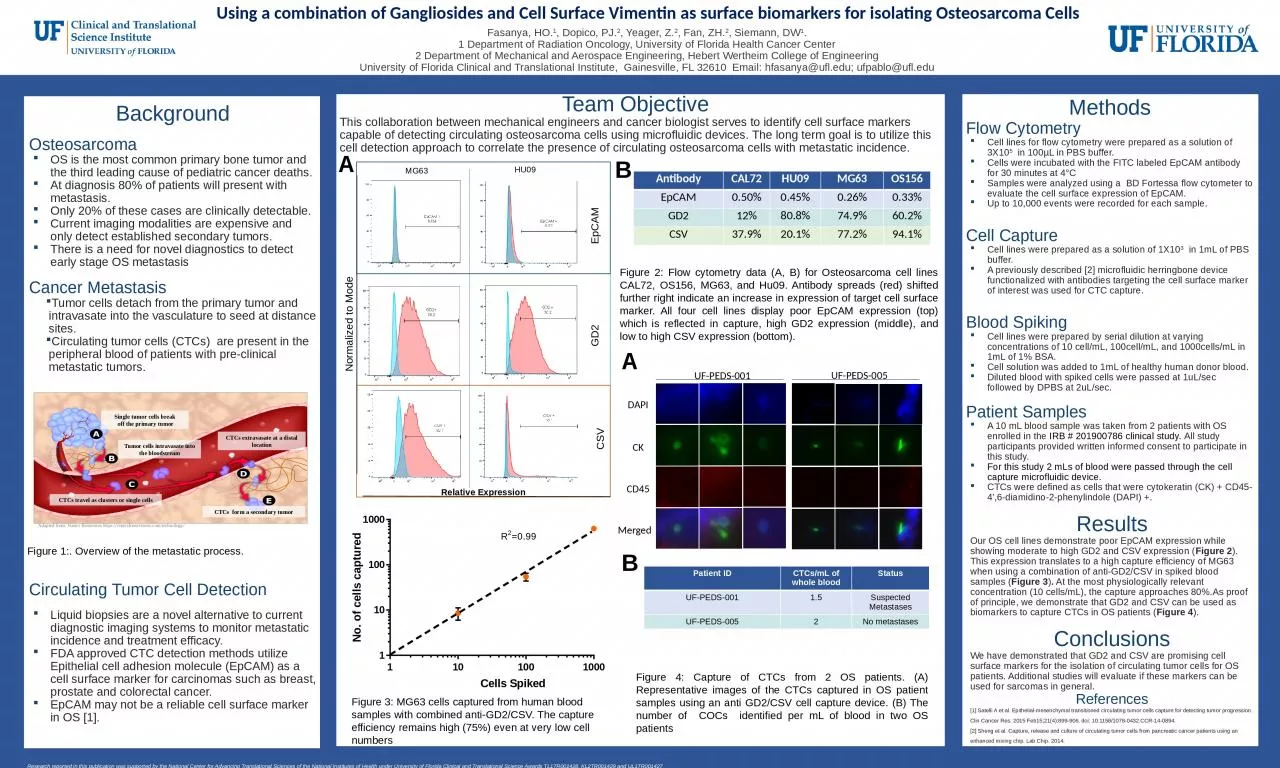
This collaboration between mechanical engineers and cancer biologist serves to identify cell surface markers capable of detecting circulating osteosarcoma cells using microfluidic devices. The long term goal is to utilize this cell detection approach to correlate the presence of circulating osteosarcoma cells with metastatic incidence.
Methods
Flow Cytometry
Cell lines for flow cytometry were prepared as a solution of 3X10⁵ in 100µL in PBS buffer. Cells were incubated with the FITC labeled EpCAM antibody for 30 minutes at 4°CSamples were analyzed using a BD Fortessa flow cytometer to evaluate the cell surface expression of EpCAM. Up to 10,000 events were recorded for each sample. Cell CaptureCell lines were prepared as a solution of 1X10³ in 1mL of PBS buffer. A previously described [2] microfluidic herringbone device functionalized with antibodies targeting the cell surface marker of interest was used for CTC capture.Blood Spiking Cell lines were prepared by serial dilution at varying concentrations of 10 cell/mL, 100cell/mL, and 1000cells/mL in 1mL of 1% BSA.Cell solution was added to 1mL of healthy human donor blood.Diluted blood with spiked cells were passed at 1uL/sec followed by DPBS at 2uL/sec. Patient Samples A 10 mL blood sample was taken from 2 patients with OS enrolled in the IRB # 201900786 clinical study. All study participants provided written informed consent to participate in this study.For this study 2 mLs of blood were passed through the cell capture microfluidic device. CTCs were defined as cells that were cytokeratin (CK) + CD45- 4',6-diamidino-2-phenylindole (DAPI) +.ResultsOur OS cell lines demonstrate poor EpCAM expression while showing moderate to high GD2 and CSV expression (Figure 2). This expression translates to a high capture efficiency of MG63 when using a combination of anti-GD2/CSV in spiked blood samples (Figure 3). At the most physiologically relevant concentration (10 cells/mL), the capture approaches 80%.As proof of principle, we demonstrate that GD2 and CSV can be used as biomarkers to capture CTCs in OS patients (Figure 4).ConclusionsWe have demonstrated that GD2 and CSV are promising cell surface markers for the isolation of circulating tumor cells for OS patients. Additional studies will evaluate if these markers can be used for sarcomas in general.References[1] Satelli A et al. Epithelial-mesenchymal transitioned circulating tumor cells capture for detecting tumor progression. Clin Cancer Res. 2015 Feb15;21(4):899-906. doi: 10.1158/1078-0432.CCR-14-0894.[2] Sheng et al. Capture, release and culture of circulating tumor cells from pancreatic cancer patients using an enhanced mixing chip. Lab Chip. 2014.
Normalized to Mode
Relative Expression
HU09
MG63
EpCAM
GD2
CSV
Figure 1:. Overview of the metastatic process.
Figure
4:
Capture of
CTCs from 2 OS patients. (A) Representative images of the CTCs captured in OS patient samples using an anti GD2/CSV cell capture device. (B) The number of COCs identified per mL of blood in two OS patients
Figure 3: MG63 cells captured from human blood samples with combined anti-GD2/CSV. The capture efficiency remains high (75%) even at very low cell numbers
AntibodyCAL72HU09MG63OS156EpCAM0.50%0.45%0.26%0.33%GD212%80.8%74.9%60.2%CSV37.9%20.1%77.2%94.1%
Figure 2: Flow cytometry data (A, B) for Osteosarcoma cell lines CAL72, OS156, MG63, and Hu09. Antibody spreads (red) shifted further right indicate an increase in expression of target cell surface marker. All four cell lines display poor EpCAM expression (top) which is reflected in capture, high GD2 expression (middle), and low to high CSV expression (bottom).
A
B
Single tumor cells break
off the primary tumor
Tumor cells
intravasate into the bloodstream
CTCs travel as clusters or single cells
CTCs extravasate at a distal location
CTCs form a secondary tumor
Adapted from: Vortex Biosiences https://vortexbiosciences.com/technology/
DAPI
CK
CD45
Merged
UF-PEDS-001
UF-PEDS-005
Patient
ID
CTCs/mL
of whole blood
Status
UF-PEDS-001
1.5
Suspected
Metastases
UF-PEDS-005
2
No
metastases
A
B