
Properties of Light Electromagnetic radiation moves in waves Electromagnetic Spectrum Electromagnetic Spectrum Colors amp Wavelengths COLOR WAVELENGTH λ in nm Ultraviolet lt 380 Violet ID: 408499
Download Presentation The PPT/PDF document "Introduction to Spectrophotometry" is the property of its rightful owner. Permission is granted to download and print the materials on this web site for personal, non-commercial use only, and to display it on your personal computer provided you do not modify the materials and that you retain all copyright notices contained in the materials. By downloading content from our website, you accept the terms of this agreement.


Slide1
Introduction to SpectrophotometrySlide2
Properties of Light
Electromagnetic radiation
moves in wavesSlide3
Electromagnetic SpectrumSlide4
Electromagnetic SpectrumSlide5
Colors & Wavelengths
COLOR
WAVELENGTH (
λ in nm)
Ultraviolet
< 380
Violet
380 – 435
Blue
436 – 480
Greenish-blue
481 – 490
Bluish-green
491 – 500Green501 – 560Yellowish-green561 – 580Yellow581 – 595Orange596 – 650Red651 – 780Near Infrared> 780
Visible LightSlide6
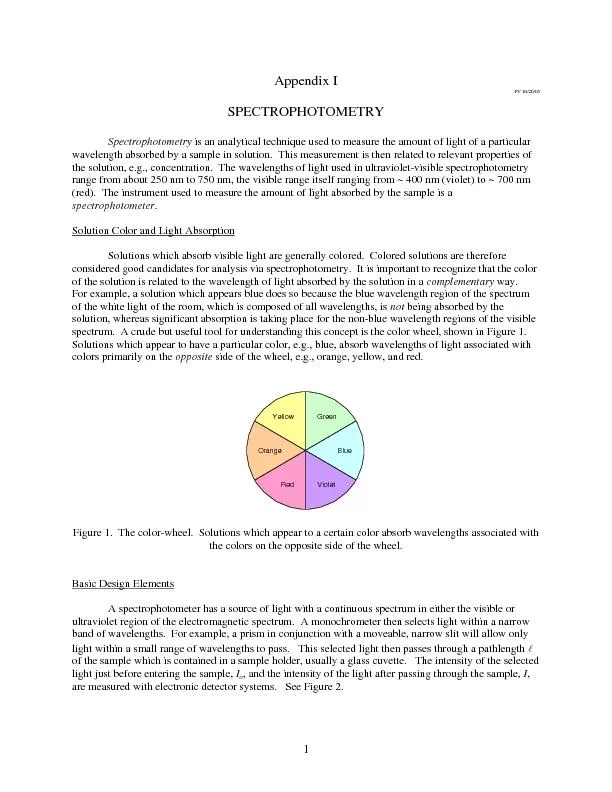
What is Colorimetry?
The solutions of many compounds have characteristic colors.
The intensity of such a color is proportional to the concentration of the compound.Slide7
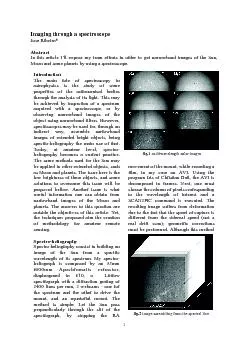
What are Spectroscopy and Spectrophotometry??
Light can either be
transmitted
or
absorbed by dissolved substances
Presence & concentration of dissolved substances is analyzed by passing light through the sample
Spectroscopes measure electromagnetic emissionSpectrophotometers measure electromagnetic
absorptionSlide8
Instruments of Measurement
Two most common:
Visible Spectrophotometer
Spect 20, Spect 88
Atomic-Absorption SpectrophotometerSlide9
Instruments of Measurement
What do visible spectrophotometers measure?
Amount of light absorbed by the dissolved substance
Qualitative
QuantitativeSlide10
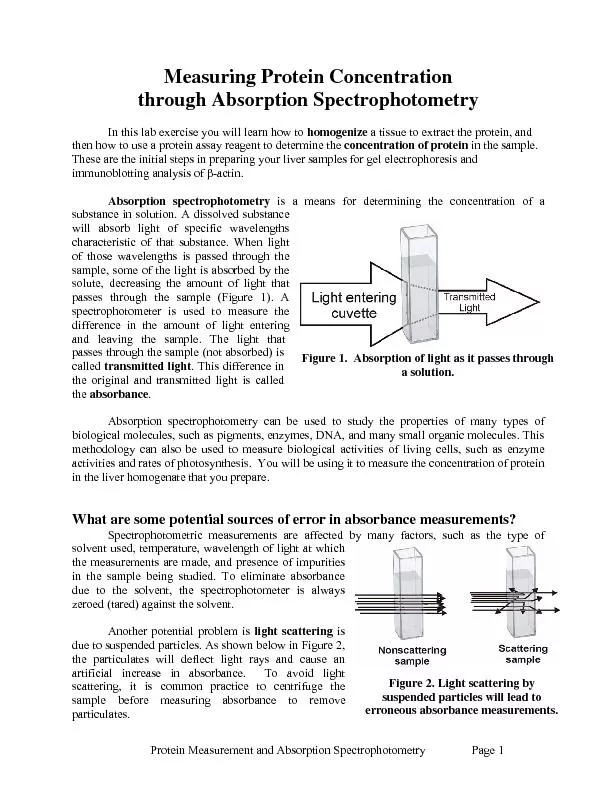
Absorption of Light
White light
All colors
Polychromatic lightSlide11
Absorption of Light
Monochromatic light
Light of one color
Red light is absorbed
by the green solutionSlide12
The SpectrophotometerSlide13
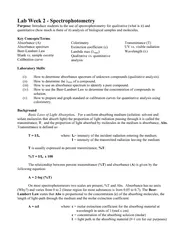
Definitions & Symbols
Intensity (I)
Transmittance (T)
It’s also referred to as %T or T x 100T = I/I
oWhere I
o is the intensity of the blankSlide14
Graphical Relationship
% transmission and % absorption are not linearly related to concentration
For a graph to be useful, a straight line is needed
ABSORBANCE = log(1/T) = -log(T)Slide15
Beer’s Law
The intensity of a ray of monochromatic light decreases exponentially as the concentration of the absorbing medium increases.
More dissolved substance = more absorption and less transmittanceSlide16
Spectral Transmission Curve
Optimum wavelengthSlide17
Standardization Graph
Standards
(solutions of known concentration) of the compound of interest are made, treated, and their absorbances (ABS) and concentration values are used to create a
Standardization Graph.Slide18
Standardization Graph