
People millions Notes Shown are the CBOs projections of health insurance coverage for the nonelderly population in millions prior to the ACA and after the implementation of the law as well as the actual number of uninsured nonelderly persons over time from the National Center for Health St ID: 1005890
Download Presentation The PPT/PDF document "EXHIBIT 1 The ACA reduced the number of ..." is the property of its rightful owner. Permission is granted to download and print the materials on this web site for personal, non-commercial use only, and to display it on your personal computer provided you do not modify the materials and that you retain all copyright notices contained in the materials. By downloading content from our website, you accept the terms of this agreement.


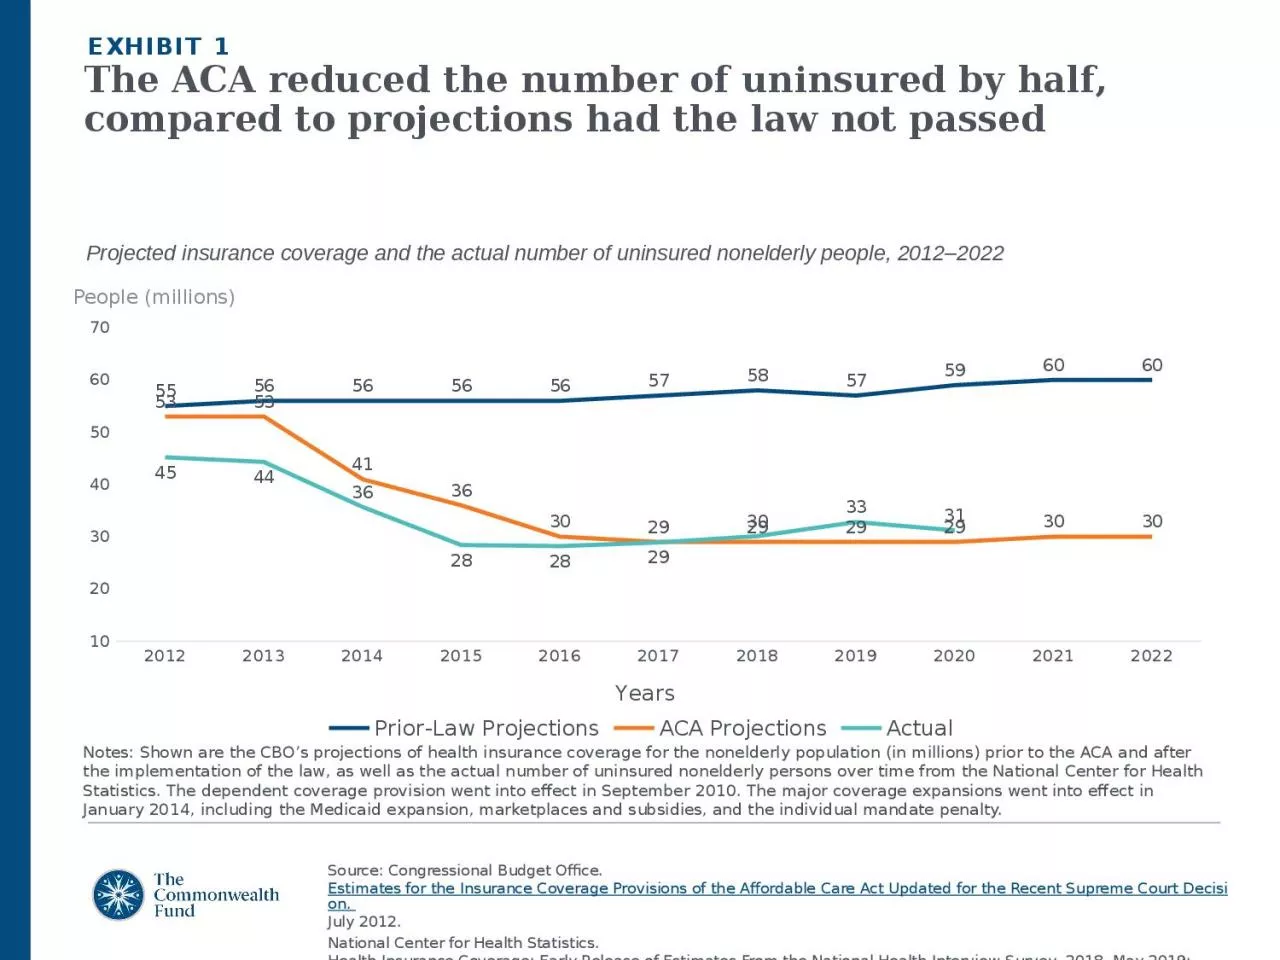
1. EXHIBIT 1The ACA reduced the number of uninsured by half, compared to projections had the law not passedPeople (millions)Notes: Shown are the CBO’s projections of health insurance coverage for the nonelderly population (in millions) prior to the ACA and after the implementation of the law, as well as the actual number of uninsured nonelderly persons over time from the National Center for Health Statistics. The dependent coverage provision went into effect in September 2010. The major coverage expansions went into effect in January 2014, including the Medicaid expansion, marketplaces and subsidies, and the individual mandate penalty.Projected insurance coverage and the actual number of uninsured nonelderly people, 2012–2022Source: Congressional Budget Office. Estimates for the Insurance Coverage Provisions of the Affordable Care Act Updated for the Recent Supreme Court Decision. July 2012. National Center for Health Statistics. Health Insurance Coverage: Early Release of Estimates From the National Health Interview Survey, 2018. May 2019; Health Insurance Coverage: Early Release of Estimates From the National Health Interview Survey, 2020. August 2021.
2. EXHIBIT 2The uninsured rate fell over the course of the pandemicPercent of individuals under 65 years of age without health insurance, 2009–2021Source: Cohen RA. Long-term trends in health insurance: Estimates from the National Health Interview Survey, United States, 2009–2018 (Table 1). National Center for Health Statistics. July 2019.National Center for Health Statistics. Health Insurance Coverage: Early Release of Estimates From the National Health Interview Survey, 2020. August 2021; Health Insurance Coverage: Early Release of Quarterly Estimates From the National Health Interview Survey, July 2020–September 2021, January 2022.ACA passed, 2010ACA major coverage expansions, 2014
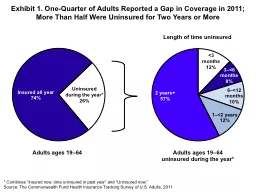
3. EXHIBIT 3Who are the remaining uninsured?3.6 million3.1 million(11%)(38%)Source: Sara R. Collins and Gabriella N. Aboulafia, “Will the American Rescue Plan Reduce the Number of Uninsured Americans?,” To the Point (blog), Commonwealth Fund, Mar. 22, 2021.
4. EXHIBIT 4Automatic enrollment would reduce the number of uninsured AmericansData: Health Insurance Policy Simulation Model, Urban Institute, 2021. Notes: ARPA = the American Rescue Plan Act. To produce estimates akin to steady-state effects, we do not include temporary reforms to health insurance premium subsidies enacted as part of the American Rescue Plan Act. Limited autoenrollment would apply to a narrow segment of the population: low-income people who are eligible for comprehensive $0 premium coverage and who can be identified through their participation in other public assistance programs. Strong auto-enrollment assumes elimination of the 100 percent of poverty threshold for marketplace subsidy eligibility thereby covering everyone in the Medicaid gap.Source: Linda J. Blumberg, John Holahan, and Jason Levitis, How Auto-Enrollment Can Achieve Near-Universal Coverage: Policy and Implementation Issues (June 2021). Number of uninsured people (millions), 2022
5. EXHIBIT 5Prices accounted for nearly two-thirds of per person spending growth in employer plans, 2015-2019Cumulative Change in per person spending, utilization, average Price, 2015-2019Notes & Source: Utilization and average prices account for changes in the type or intensity of services used, with the exception of prescription drugs. Prescription drug spending is the amount paid on the pharmacy claim, which reflects discounts from the wholesale price, but not manufacturer rebates. Healthcare Cost Institute, 2019 Health Care Cost and Utilization Report, released October 2021. Available here: https://healthcostinstitute.org/images/pdfs/HCCI_2019_Health_Care_Cost_and_Utilization_Report.pdf
6. Share of median income (%)EXHIBIT 6Worker premium contributions and deductibles in employer plans added up to more than 11 percent of U.S. median income in 2020DeductiblePremium contributionCombined premium contribution + deductibleNote: Combined estimates of single and family premium contributions and deductibles are weighted for the distribution of single-person and family households in the state.Data: Premium contributions and deductibles — Medical Expenditure Panel Survey–Insurance Component (MEPS–IC), 2010–2020; Median household income and household distribution type — analysis of Current Population Survey (CPS), 2010–2021, by Mikaela Springsteen and Sherry Glied of New York University for the Commonwealth Fund.Source: Sara R. Collins, David C. Radley, and Jesse C. Baumgartner, State Trends in Employer Premiums and Deductibles, 2010–2020 (Commonwealth Fund, Jan. 2022). https://doi.org/10.26099/m5dt-5f70
7. Note: Combined estimates of single and family premium contributions and deductibles are weighted for the distribution of single-person and family households in the state.Data: Premium contributions and deductibles — Medical Expenditure Panel Survey–Insurance Component (MEPS–IC), 2010–2020; Median household income and household distribution type — analysis of Current Population Survey (CPS), 2010–2021, by Mikaela Springsteen and Sherry Glied of New York University for the Commonwealth Fund.EXHIBIT 7In growing number of states, worker insurance premium contributions and deductibles in employer plans make up 10 percent or more of median income<10.0% (13 states + D.C.)10.0%–11.9% (14 states)Average employee share of premium plus average deductible as percent of median state income12.0%–14.9% (18 states)201020152020<10.0% (18 states + D.C.)10.0%–11.9% (16 states)12.0%–14.9% (15 states)<10.0% (40 states + D.C.)10.0%–11.9% (7 states)12.0%–13.2% (3 states)15.0%–15.6% (1 state)15.0%–19.0% (5 states)Source: Sara R. Collins, David C. Radley, and Jesse C. Baumgartner, State Trends in Employer Premiums and Deductibles, 2010–2020 (Commonwealth Fund, Jan. 2022). https://doi.org/10.26099/m5dt-5f70
8. Source: Sara R. Collins, Munira Z. Gunja, and Gabriella N. Aboulafia, U.S. Health Insurance Coverage in 2020: A Looming Crisis in Affordability — Findings from the Commonwealth Fund Biennial Health Insurance Survey, 2020 (Commonwealth Fund, Aug. 2020).One-quarter of adults in employer plans are underinsured; individual market continues to be challengingPercent of adults ages 19–64 insured all year who were underinsuredEXHIBIT 8 Data: Commonwealth Fund Biennial Health Insurance Surveys (2010, 2012, 2014, 2016, 2018, 2020). Notes: “Underinsured” refers to adults who were insured all year but experienced one of the following: out-of-pocket costs, excluding premiums, equaled 10% or more of income; out-of-pocket costs, excluding premiums, equaled 5% or more of income if low-income (<200% of poverty); or deductibles equaled 5% or more of income. Respondents may have had another type of coverage at some point during the year but had coverage for the entire previous 12 months. ^ For 2014–2020, individual coverage includes adults who got coverage in the individual market and the marketplaces.
9. Note: Single and family deductibles are weighted for the distribution of single-person and family households in the state.Data: Deductibles — Medical Expenditure Panel Survey–Insurance Component (MEPS–IC), 2020; Median household income and household distribution type — analysis of Current Population Survey (CPS), 2020–2021, by Mikaela Springsteen and Sherry Glied of New York University for the Commonwealth Fund.EXHIBIT 9Average deductibles in employer plans amounted to 5 percent or more of median income in 22 states2.6%–3.9% (10 states + D.C.)4.0%–4.9% (18 states)Average deductible as percent of median state income5.0%–7.4% (22 states)Source: Sara R. Collins, David C. Radley, and Jesse C. Baumgartner, State Trends in Employer Premiums and Deductibles, 2010–2020 (Commonwealth Fund, Jan. 2022). https://doi.org/10.26099/m5dt-5f70
10. EXHIBIT 10Uninsured or underinsured adults often avoid or delay getting needed health care and medicationsPercent of adults ages 19–64 who had any of four access problems in past year because of costSource: Sara R. Collins, Munira Z. Gunja, and Gabriella N. Aboulafia, U.S. Health Insurance Coverage in 2020: A Looming Crisis in Affordability — Findings from the Commonwealth Fund Biennial Health Insurance Survey, 2020 (Commonwealth Fund, Aug. 2020).
11. EXHIBIT 11People with inadequate insurance coverage have more problems paying medical billsPercent of adults ages 19–64 who had any of the following medical bill/debt problems in the past yearSource: Sara R. Collins, Munira Z. Gunja, and Gabriella N. Aboulafia, U.S. Health Insurance Coverage in 2020: A Looming Crisis in Affordability — Findings from the Commonwealth Fund Biennial Health Insurance Survey, 2020 (Commonwealth Fund, Aug. 2020).Notes: “Underinsured” refers to adults who were insured all year but experienced one of the following: out-of-pocket costs, excluding premiums, equaled 10% or more of income; out-of-pocket costs, excluding premiums, equaled 5% or more of income if low-income (<200% of poverty); or deductibles equaled 5% or more of income. “Uninsured anytime in the past year” refers to adults who were either uninsured at the time of the survey or spent some time uninsured in the past year.Data: Commonwealth Fund Biennial Health Insurance Survey (2020).
12. Note: Single and family premium contributions are weighted for the distribution of single-person and family households in the state.Data: Premium contributions — Medical Expenditure Panel Survey–Insurance Component (MEPS–IC), 2020; Median household income and household distribution type — analysis of Current Population Survey (CPS), 2020–2021, by Mikaela Springsteen and Sherry Glied of New York University for the Commonwealth Fund.EXHIBIT 12Premium contributions in employer plans were more than 8.5 percent of median income in eight states.4.3%–5.9% (12 states + D.C.)6.0%–8.5% (30 states)Average employee share of premium as percent of median state income8.6%–12.7% (8 states)Source: Sara R. Collins, David C. Radley, and Jesse C. Baumgartner, State Trends in Employer Premiums and Deductibles, 2010–2020 (Commonwealth Fund, Jan. 2022). https://doi.org/10.26099/m5dt-5f70
13. Source: Linda J. Blumberg et al., Comparing Health Insurance Reform Options: From “Building on the ACA” to Single Payer (Commonwealth Fund and Urban Institute, Oct. 2019). EXHIBIT 13Reforms that build on the ACA have the potential to reach near-universal coverageNumber of uninsured nonelderly individuals (in millions), 2020
14. Source: Linda J. Blumberg et al., Comparing Health Insurance Reform Options: From “Building on the ACA” to Single Payer (Commonwealth Fund and Urban Institute, Oct. 2019). EXHIBIT 14Capping provider rates directly or via a public option has the potential to reduce the federal costs of reform10-year estimates of additional federal revenues needed to finance each reform, 2020-2029 (billions of dollars)
15. Notes: Single Payer “Lite”: A single-payer plan that covers all people legally residing in the U.S. and includes all the ACA’s “essential health benefits” and has no private insurance option. Single Payer Enhanced: This plan covers all U.S. residents, including undocumented immigrants, and features a broader set of benefits than Single Payer “Lite,” including adult dental, vision, and hearing care as a well as a home- and community-based long-term services and supports benefit. In addition, there are no cost-sharing requirements nor private insurance option. Source: Linda J. Blumberg et al., Comparing Health Insurance Reform Options: From “Building on the ACA” to Single Payer (Commonwealth Fund and Urban Institute, Oct. 2019). EXHIBIT 15Single-payer approaches can reach near-universal or universal coverageNumber of uninsured nonelderly individuals (2020) and additional federal revenues needed to finance each reform, 2020-2029 Millions of peopleTrillions of dollars
16. EXHIBIT 16Changes in national health spending under health reform approachesChange in NHE (dollars)Change in NHE (percent)Total NHE, 2020Current law --3,496.8Universal coverage by building on the ACA w/public option- 22.6- 0.6%3,474.2Universal coverage via single payer “lite”- 209.5- 6.0% 3,287.2Universal coverage via single payer “enhanced” + 719.7+ 20.6%4,216.5Actual and estimated projected national health expenditures, billions in 2019 and 2020Notes: Single Payer Enhanced: This plan covers all U.S. residents, including undocumented immigrants, and features a broad set of benefits including adult dental, vision, and hearing care as a well as a home- and community-based long-term services and supports benefit. In addition, there are no cost-sharing requirements nor private insurance option. Source: Linda J. Blumberg et al., Comparing Health Insurance Reform Options: From “Building on the ACA” to Single Payer (Commonwealth Fund and Urban Institute, Oct. 2019).
17. Source: Linda J. Blumberg et al., Comparing Health Insurance Reform Options: From “Building on the ACA” to Single Payer (Commonwealth Fund and Urban Institute, Oct. 2019). Enhanced single-payer approach would shift most household, employer and state spending to the federal budget Current LawSingle payer Federal government1,284.3 4,128.9 State302.3 42.7 Employers954.70Households931.4 44.9 In kind uncompensated care from providers24.10Total3,496.8 4,216.5Actual and estimated projected national health expenditures, billions in 2019 and 2020EXHIBIT 17