
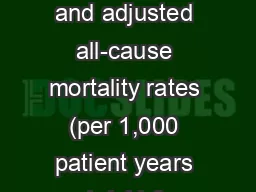
2016 Annual Data Report Vol 1 CKD Ch 3 2 Data source Medicare 5 percent sample January 1 2014 point prevalent patients aged 66 and older Adj agesexrace Ref all patients 2014 Abbreviation CKD chronic kidney disease ID: 758589
Download Presentation The PPT/PDF document "Table 3.1 Unadjusted and adjusted all-c..." is the property of its rightful owner. Permission is granted to download and print the materials on this web site for personal, non-commercial use only, and to display it on your personal computer provided you do not modify the materials and that you retain all copyright notices contained in the materials. By downloading content from our website, you accept the terms of this agreement.


pptx