
AdditionalEfficiency OpportunitiesContactPierre DelforgeNatural Resources Defense Councilpdelforgenrdcorg 4158756100substantial part of the costeffective energysaving opportunities with current t ID: 884090
Download Pdf The PPT/PDF document "External Power Supplies" is the property of its rightful owner. Permission is granted to download and print the materials on this web site for personal, non-commercial use only, and to display it on your personal computer provided you do not modify the materials and that you retain all copyright notices contained in the materials. By downloading content from our website, you accept the terms of this agreement.

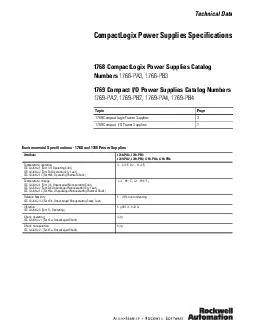


1 External Power Supplies - Additional
External Power Supplies - Additional Efficiency Opportunities Contact: Pierre Delforge Natural Resources Defense Council pdelforge@nrdc.org ; 415 - 875 - 6100 substantial part of the cost - effective energy - saving opportunities with current technology and as measured using DOE’s current metrics. However these metrics ignore significant savings opportunities in real - world operating conditions. A more accurate sment of potential savings requires additional research , but p reliminary estimates from existing literature suggest that the potential energy savings from power factor correction and low - load efficiency are significant. We encourage DOE to investigate the feasibility of addressing these energy savings opportunities in the next round of federal efficiency standards for external power supplies. Power Factor and Low - Load Efficiency Opportunities Context – DOE just released r evised fed eral standards for external power supplies (EPS) on Feb ruary 10 , 2014 . These standards are significantly more stringent than 2008 standards and capture most of the cost - effective energy savings opportunity using DOE’s current metrics and with the current state of techno logy. However the No Load and 4 - savings on the table. In particular they ignore the energy wasted due to poor power factor and when operating below 25 percent of EPS rated power. 1. Power Factor Power factor (PF) is a measure of current quality. Most efficient power supplies use switch mode designs that draw current in short spikes which often bear no relation to the voltage waveform, resulting in a low power factor if uncorrected . Devices with low power factor have proportionately higher AC current draw, which increases the resistive losses in the building wiring, and increase the amount
2 of electricity generation required for
of electricity generation required for a given load. A recent study found that the power factor of the majo rity of the power supplies of electronic devices were in the 0.3 – 0.55 range over much of their operating range. 1 IEA: Power Factor Correction: An Energy Efficiency Perspective, http://standby.iea - 4e.org/files/otherfiles/0000/0041/AGO_G3A_PowerFact orCorrection_FINAL_2011_0617 - M.pdf Power factor ( c osine of phase angle) vs. load: 2 A device with a PF of 0.4 draws 2.5 times the current compared to an ideal load with a PF of 1, which means that building wiring losses could be 6.25 times higher than the ideal case. 3 A 2011 Asia Pacific Partnership - Ecos Consulting paper 4 estimated the savings potential from power factor correction to be 2.1% in residential settings and 1 1% in commercial settings. The paper estimates that r oughly half of these savings, and more than half in commercial settings, occur on the customer - side of the meter, the other part on the utility side. Cost - effectiveness - Only customer - side savings may be counted towards cost - effectiveness for the consumer, however the entire savings accrue societal benefits in the form of reduced air and climate pollution. I f customer - side benefits of power factor correction are not cost - effective by themselves for som e EPS, they may be cost - effective bundled with other energy - saving requirements such as low - load efficiency. S ingle metric - In order to abide by DOE’s single metric requirement, power factor losses could be modeled for average residential and commercial buildings, and these losses added to the u nit e nergy c onsumption of each device , or included as a correction factor in the average efficiency metric. Power factor improvements could have substantia
3 l energy - saving benefits for consum
l energy - saving benefits for consumers, both directly and indirectly through their electric utilities. EPS are an ideal opportunity to address the issue of power factor across the vast majority of electronic devices that use an EPS . 2 GeSI - ITU 2012: An Energy - Aware Survey on ICT Device Power Supplies http://www.itu.int/dms_pub/itu - t/oth/4B/01/T4B010000070001PDFE.pdf 3 Ibid . 4 Power Factor Correction: An Energy Efficiency Perspective, http://standby.iea - 4e.org/files/otherfiles/0000/0041/AGO_G3A_PowerF actorCorrection_FINAL_2011_0617 - M.pdf 2. Low Load Efficiency The EPS Average Efficiency metric calculates the arithmetic average efficiency at 25, 50, 75 and 100 percent of rated power. It does not capture efficiency below 25 percent load, which is a common operating point for many electronic devices. Many electronic device s operate most, or a significant portion of the time , below 25 percent load. Notebook computers for example spend the majority of their time in the 10 to 20 percent range. Battery charger systems, such as cell phones, even when designed to primarily charge above 25 percent, taper charging current when the battery reaches 90 percent charge, causing the load on the EPS to drop in its low - load zone. And the low - load zone is the most frequently occurring charging condition as consumers typically leave their pho nes plugged in until fully charged and frequently top them off. The figure below illustrates the importan ce of including low - load efficiency in the single metric for EPS efficiency. These two EPS on the chart have similar efficiency using the standard met ric (approximately 2% average efficiency difference) , but 18% difference in efficiency at 10% load : SE1 is a computer OEM EPS rated lev
4 el V. HE1 is a Power Integrations refere
el V. HE1 is a Power Integrations reference design. 100% load efficiency is unnecessary - F ew if any devices are desig ned to operate a substantial amount of time at or close to 100% load because this would impact EPS reliability. This suggests that 100% load is not a meaningful load point to measure efficiency, and that 10% load would better represent real - world operating conditions. Proposed metric - Ideally, the standards would require specific minimum efficiency levels at each load point ; however if this is not possible due to single - metric requirements, a 4 - point average across 10%, 25%, 50%, 75% would better capture the real - world efficiency of EPS. Alternatively, 10% - load efficiency could be an additional requirement on top of the current average efficiency metric, similarly to the Energy Star Computer v6.0 power supply efficiency incentive. Test method – Measuring p ower factor and 10% load efficiency necessitate only minimal adjustments to the test method since standard metering equipment is capable of measuring power factor at any load point, and 10% load c ould simply replace the current 100% load test point. Savi ngs potential – The savings potential from a 10% load requirement is challenging to assess because it depends on the operating profile of each device and on the baseline efficiency of current EPS. However anecdotal measurements on laptop EPS suggest it can be very significant, especially in light of the fact that this is an area which has had little focus so far, and that manufacturers have no market incentive to optimize EPS efficiency at low load (contrary to high load which drives EPS size, material weig ht and therefore manufacturing cost). We believe that potential savings from an improved metric are substantial and worth further investigati