
fixed and mixed costs and the relevant range 1 Apply the highlow method to determine the components of mixed costs 2 Prepare a CVP income statement to determine contribution margin ID: 719959
Download Presentation The PPT/PDF document "Learning Objectives Explain variable," is the property of its rightful owner. Permission is granted to download and print the materials on this web site for personal, non-commercial use only, and to display it on your personal computer provided you do not modify the materials and that you retain all copyright notices contained in the materials. By downloading content from our website, you accept the terms of this agreement.


Slide1Slide2
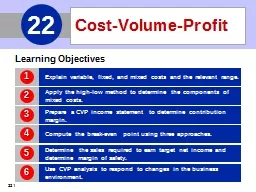
Learning Objectives
Explain variable,
fixed
, and mixed costs and the relevant range.
1
Apply the high-low method
to determine the components of mixed costs.
2
Prepare a CVP income statement
to determine contribution margin.
3
Compute the break-even point
using three approaches.
4
Determine the sales required to
earn target net income and determine margin of safety.
5
Cost-Volume-Profit
5Slide3
Cost Behavior Analysis
is the study of how specific costs respond to changes in the level of business activity.Some costs change; others remain the same.Helps management plan operations and decide between alternative courses of action.
Applies to all types of businesses and entities.
Starting point is measuring key business activities.LEARNINGOBJECTIVE
Explain variable, fixed, and mixed costs and the relevant range.
1
LO 1Slide4
Cost Behavior Analysis
is the study of how specific costs respond to changes in the level of business activity.Activity levels may be expressed in terms of:Sales dollars (in a retail company)
Miles driven (in a trucking company)Room occupancy (in a hotel)
Dance classes taught (by a dance studio)Many companies use more than one measurement base.
Cost Behavior Analysis
LO 1Slide5
Cost Behavior Analysis
is the study of how specific costs respond to changes in the level of business activity.Changes in the level or volume of activity should be correlated with changes in costs.Activity level selected is called activity or volume index.
Activity index:
Identifies the activity that causes changes in the behavior of costs.Allows costs to be classified as variable, fixed, or mixed.
Cost Behavior Analysis
LO
1Slide6
Costs that vary in total directly and proportionately with changes in the activity level.
Example:
If the activity level increases 10 percent, total variable costs increase 10 percent.
Example:
If the activity level decreases by 25 percent, total variable costs decrease by 25 percent.Variable costs remain the same per unit at every level of activity.
Variable Costs
LO
1Slide7
Illustration:
Damon Company manufactures tablet computers that contain a $10 camera. The activity index is the number of
tablets produced. As Damon manufactures each tablet, the total cost of the cameras used increases by $10.
As part (a)
of
Illustration 5-1
shows, total cost of the cameras will be $20,000 if Damon produces 2,000 tablets, and $100,000 when it produces 10,000 tablets. We also can see that a variable cost remains the same per unit as the level of activity changes.
Illustration 5-1
Variable Costs
LO
1Slide8
Illustration:
Damon Company manufactures tablet computers that contain a $10 camera. The activity index is the number of
Illustration 5-1
tablets produced. As Damon manufactures each tablet, the total cost of the cameras used increases by $10.
As part (b)
of
Illustration 5-1
shows, the unit cost of $10 for the camera is the same whether Damon produces 2,000 or 10,000 tablets.
Variable Costs
LO
1Slide9
Illustration 5-1
Behavior of total and unit variable costs
Variable Costs
LO
1Slide10
Costs that remain the same
in total regardless of changes in the activity
level within a relevant range.
Fixed cost per unit cost
varies inversely
with activity: As volume increases, unit cost declines, and vice versa
Examples:
Property taxesInsurance
RentDepreciation on buildings and equipment
Fixed Costs
LO
1Slide11
Illustration:
Damon Company leases its productive facilities at a cost of $10,000 per month. Total fixed costs of the
facilities will remain constant at every level of activity, as part (a) of
Illustration 5-2
shows.
Illustration 5-2
Fixed Costs
LO
1Slide12
Illustration:
Damon Company leases its productive facilities at a cost of $10,000 per month. Total fixed costs of the
facilities will remain constant at every level of activity. But,
on a per unit basis, the cost of rent will decline as activity increases
, as part (b) of Illustration 5-2 shows. At 2,000 units, the unit cost per tablet computer is $5 ($10,000 ÷ 2,000). When Damon produces 10,000 tablets, the unit cost of the rent is only $1 per tablet ($10,000 ÷ 10,000).
Illustration 5-2
Fixed Costs
LO
1Slide13
Illustration 5-2
Behavior of total and unit fixed costs
Fixed Costs
LO
1Slide14
Variable costs are costs that:
a. Vary in total directly and proportionately with changes in the activity level.
b. Remain the same per unit at every activity level.
c. Neither of the above.
d. Both (a) and (b) above.
Question
Fixed Costs
LO
1Slide15
LO
1Slide16
Throughout the range of possible levels of activity
, a straight-line relationship usually does not exist for either variable costs or fixed costs. Relationship between variable costs and changes in activity level is often curvilinear.
Relevant Range
For
fixed costs
, the
relationship is also nonlinear
– some fixed costs will not change over the entire range of activities, while other fixed costs may change.
LO
1Slide17
Illustration 5-3
Nonlinear behavior of variable and fixed costs
Relevant Range
LO
1Slide18
Range
of activity over which a company expects to operate during a year.
Illustration 5-4
Linear behavior within relevant range
Relevant Range
LO
1Slide19
The relevant range is:
The range of activity in which variable costs will be curvilinear.The range of activity in which fixed costs will be curvilinear. The range over which the company expects to operate during a year.
Usually from zero to 100% of operating capacity.
Question
Relevant Range
LO
1Slide20
Costs that have
both
a variable element
and a fixed element.Change in total but not proportionately with changes in activity level.
Mixed Costs
Illustration 5-5
Behavior of a mixed cost
LO
1Slide21
Helena Company, reports the following total costs at two levels of production.
Classify each cost as
variable
,
fixed
, or
mixed
.
Variable
Fixed
Mixed
1
Types of Costs
LO
1Slide22
High-Low Method
High-Low Method uses the total costs incurred at the high and the low levels of activity to classify mixed costs into fixed and variable components.
The difference in costs between the high and low levels represents variable costs, since only variable-cost element can change as activity levels change.
LEARNING
OBJECTIVE
Apply
the high-low method to determine
the components
of mixed costs.
2
LO
2Slide23
STEP 1
: Determine variable cost per unit using the following formula:
High-Low Method
Illustration 5-6
Formula for variable cost per
unit using high-low method
LO
2Slide24
Illustration:
Metro Transit Company has the following maintenance costs and mileage data for its fleet of buses over a 6-month period.
Change in Costs
(63,000 - 30,000)
$33,000
High minus Low
(50,000 - 20,000)
30,000
=
$1.10
cost per unit
High-Low Method
Illustration 5-7
Assumed maintenance
costs and
mileage data
LO
2Slide25
STEP 2
: Determine the
fixed cost
by subtracting the total variable cost at
either the high or the low activity level from the total cost at that activity level.
High-Low Method
Illustration 5-8
High-low method computation of fixed
costs
LO
2Slide26
Maintenance costs are therefore $8,000 per month of fixed costs plus $1.10 per mile of variable costs.
This is represented by the following formula:
Maintenance costs = $8,000 + ($1.10 x Miles driven)
Example:
At 45,000 miles, estimated maintenance costs would be:
Fixed
$ 8,000
Variable
($1.10 x 45,000)
49,500
$57,500
High-Low Method
LO
2Slide27
Illustration 5-9
Scatter plot for Metro Transit Company
High-Low Method
LO
2Slide28
Mixed costs consist of a:
Variable cost element and a fixed cost element.Fixed cost element and a controllable cost element. Relevant cost element and a controllable cost element.
Variable cost element and a relevant cost element.
Question
High-Low Method
LO
2Slide29
LO
2Slide30
Byrnes Company accumulates the following data concerning a mixed cost, using units produced as the activity level.
Compute the variable- and fixed-cost elements using the high-low method.
Estimate the total cost if the company produces
8,000
units.
2
High-Low Method
LO
2Slide31
Compute the variable and fixed cost elements using the high-low method.
Variable cost
: ($14,740 - $11,100) / (9,800 - 7,000) =
$1.30 per unit
Fixed cost
: $14,740 - $12,740 ($1.30 x 9,800 units) =
$2,000
or
$11,100 - $9,100 ($1.30 x 7,000) =
$2,000
2
High-Low Method
LO
2Slide32
Estimate the total cost if the company produces
8,000
units.
Total cost
(8,000
units)
:
$2,000 + $10,400
($1.30 x 8,000) =
$12,400
2
High-Low Method
LO
2Slide33
Cost-volume-profit (CVP)
analysis is the study of the effects of changes in costs and volume on a company’s profits.Important in profit planning.
Critical factor in management decisions as
Setting selling prices,Determining product mix, and Maximizing use of production facilities.
LEARNINGOBJECTIVEPrepare
a CVP income statement to determine contribution margin.
3
LO
3Slide34
Basic Components
Cost-Volume-Profit Analysis
Illustration 5-10
Components of CVP analysis
LO
3Slide35
Assumptions
Behavior of both costs and revenues is linear throughout the relevant range of the activity index.
Costs can be classified accurately as either variable or fixed.
Changes in activity are the only factors that affect costs.
All units produced are sold.
When more than one type of product is sold, the sales mix will remain constant.
Basic Components
LO
3Slide36
Which of the following is
not involved in CVP analysis?Sales mix.Unit selling prices. Fixed costs per unit.
Volume or level of activity.
Question
Basic Components
LO
3Slide37
A statement for
internal use.Classifies costs and expenses as fixed or variable. Reports
contribution margin in the body of the statement.
Contribution margin – amount of revenue remaining after deducting variable costs. Reports the same net income
as a traditional income statement.
CVP Income Statement
Cost-Volume-Profit Analysis
LO
3Slide38
Illustration:
Vargo Video Company produces a high-definition digital camcorder. Relevant data for the camcorders sold by this company in June 2014 are as follows.
CVP Income Statement
Illustration 5-11
Assumed selling and cost data
for Vargo Video
LO
3Slide39
Illustration:
The CVP income statement for Vargo Video therefore would be reported as follows.
CVP Income Statement
Illustration
5-12
LO
3Slide40
Contribution margin is available to
cover fixed costs
and to
contribute to income.Formula for contribution margin per unit
and the computation for Vargo Video are:
UNIT CONTRIBUTION MARGIN
CVP Income Statement
Illustration 5-13
Formula for unit
contribution margin
LO
3Slide41
Vargo’s CVP income statement assuming a zero net income.
Illustration 5-14
CVP Income Statement
UNIT CONTRIBUTION MARGIN
LO
3Slide42
Assume that Vargo sold one more camcorder, for a total of 1,001 camcorders sold.
Illustration 5-15
CVP Income Statement
UNIT CONTRIBUTION MARGIN
LO
3Slide43
Shows the percentage of each sales dollar available to apply toward fixed costs and profits.
Formula for
contribution margin ratio
and the computation for Vargo Video are:
Illustration 5-17
Formula for contribution
margin ratio
CONTRIBUTION MARGIN RATIO
CVP Income Statement
LO
3Slide44
Illustration 5-16
CVP income statement, with
net income and percent
of sales data
CVP Income Statement
CONTRIBUTION MARGIN RATIO
LO
3Slide45
Assume Vargo Video’s current sales are $500,000 and it wants to know the effect of a $100,000 (200-unit) increase in sales.
Illustration 5-18
CVP Income Statement
CONTRIBUTION MARGIN RATIO
LO
3Slide46
Contribution margin:
a. Is revenue remaining after deducting variable costs.b. May be expressed as contribution margin per unit. c. Is selling price less cost of goods sold.
d. Both (a) and (b) above.
Question
CVP Income Statement
LO
3Slide47
Ampco
Industries produces and sells a cell phone-operated thermostat.
Information regarding
the costs and sales of thermostats during September 2017 are provided below. Unit
selling price of thermostat $85 Unit variable costs $32
Total monthly
fixed costs $190,000 Units sold 4,000
Prepare a CVP income statement for Ampco Industries for the month of September. Provide per unit values and total values.
3
CVP Income Statement
LO
3Slide48
Prepare
a CVP income statement for Ampco Industries for the month of September.
Provide per
unit values and total values.
3
CVP Income Statement
LO
3Slide49
Process of finding the
break-even point level of activity at which total revenues equal total costs (both fixed and variable).
Can be computed or derived
from a mathematical equation,by using contribution margin
, orfrom a cost-volume profit
(CVP) graph.
Expressed either in sales units or in sales dollars
.
Break-Even Analysis
LEARNING
OBJECTIVE
Compute the break-even point using three approaches.
4
LO
4Slide50
Illustration 5-20
Computation of break-even point in units.
Break-even occurs where total sales equal variable costs plus fixed costs; i.e., net income is zero
Mathematical Equation
LO
4Slide51
At the break-even point, contribution margin must equal total fixed costs
(CM = total revenues – variable costs) Break-even point can be computed using either contribution margin per unit or contribution margin ratio.
Contribution Margin Technique
LO
4Slide52
When the break-even-point in
units is desired, contribution margin per unit is used in the following formula which shows the computation for Vargo Video:
Illustration 5-21
Formula for break-even point
in units using unit contributionmargin
CONTRIBUTION MARGIN IN UNITS
Break-Even Analysis
LO
4Slide53
When the break-even-point
in dollars is desired, contribution margin ratio is used in the following formula which shows the computation for Vargo Video:
CONTRIBUTION MARGIN RATIO
Break-Even Analysis
Illustration 5-22
Formula for break-even point
in
dollars
using
contribution
Margin ratio
LO
4Slide54
LO
4Slide55
Because this graph also shows costs, volume, and profits, it is referred to as a
cost-volume-profit (CVP) graph
.
Illustration 5-23
CVP graph
Graphic Presentation
LO
4Slide56
Gossen Company is planning to sell 200,000 pliers for $4 per unit. The contribution margin ratio is 25%. If Gossen will break even at this level of sales, what are the fixed costs?
$100,000.$160,000. $200,000.
$300,000.
Question
Break-Even Analysis
LO
4Slide57
Lombardi Company has a unit selling price of $400, variable costs per unit of $240, and fixed costs of $180,000. Compute the
break-even point
in units using
(a) a mathematical equation and (b) contribution margin per unit.
$400Q
$240Q
$180,000
0
$160Q
$180,000
Q
1,125 units
-
-
=
-
=
Illustration 5-19
Sales
Variable Costs
Fixed Costs
Net Income
-
-
=
4
Break-Even Analysis
LO
4Slide58
$180,000
$160
1,125 units
=
Illustration 5-21
Lombardi Company has a unit selling price of $400, variable costs per unit of $240, and fixed costs of $180,000. Compute the
break-even point
in units using (a) a mathematical equation and
(b) contribution margin per unit
.
Fixed Costs
Contribution Margin per Unit
Break-Even Point in Units
÷
=
÷
4
Break-Even Analysis
LO
4Slide59
Level of sales necessary to achieve a specified income.
Can be determined from each of the approaches used to determine break-even sales/units:from a mathematical equation,
by using contribution margin technique
, orfrom a cost-volume profit (CVP) graph.
Expressed either in sales units or in sales dollars
.
Target Net Income
LEARNING
OBJECTIVE
Determine the sales required to earn target net income and determine margin of safety.
5
LO
5Slide60
MATHEMATICAL EQUATION
Illustration 5-24
Formula for required sales to meet target net income.
Target Net Income
LO
5Slide61
Using the formula for the break-even point, simply include the desired net income as a factor.
Illustration 5-25
MATHEMATICAL EQUATION
Target Net Income
LO
5Slide62
To determine the required
sales in units
for Vargo Video:
CONTRIBUTION MARGIN TECHNIQUE
Target Net Income
Illustration 5-26
Formula for required sales in
units using unit contribution
margin
LO
5Slide63
To determine the required
sales in dollars
for Vargo Video:
Target Net Income
CONTRIBUTION MARGIN TECHNIQUE
Illustration 5-27
Formula for required sales
in dollars using contribution
margin ratio
LO
5Slide64
Suppose Vargo Video sells 1,400 camcorders.
Illustration 5-23
shows that a vertical line drawn at 1,400 units intersects the sales line at $700,000 and the total cost line at $620,000. The difference between the two amounts represents the net income (profit) of $80,000.
Target Net Income
Illustration 5-23
GRAPHIC PRESENTATION
LO
5Slide65
The mathematical equation for computing required sales to obtain target net income is:
Required sales =Variable costs + Target net income.Variable costs + Fixed costs + Target net income.Fixed costs + Target net income.
No correct answer is given.
Question
Target Net Income
LO
5Slide66
Difference between
actual or expected sales and sales at the break-even point.Measures the “cushion” that a particular level of sales provides.
May be expressed in dollars or as a ratio.
Assuming actual/expected sales are $750,000:
Margin of Safety
Illustration 5-28
Formula for margin of safety
in dollars
LO
5Slide67
Computed by dividing the margin of safety in dollars by the actual (or expected) sales.
Assuming actual/expected sales are $750,000:
Illustration 5-29
The higher the dollars or percentage, the greater the margin of safety.
Margin of Safety Ratio
LO
5Slide68
Marshall Company had actual sales of $600,000 when break-even sales were $420,000. What is the margin of safety ratio?
25%.30%. 33 1/3%.45%.
Question
Margin of Safety
LO
5Slide69
LO
5Slide70
Zootsuit
Inc. makes travel bags that sell for $56 each. For the coming year,
management expects fixed
costs to total $320,000 and variable costs to be $42 per unit. Compute the following:
break-even point in dollars using the contribution margin (CM) ratio; the margin of safety and margin of safety ratio assuming actual sales are $1,382,400; and
the sales dollars required to earn net income of $410,000.
Comprehensive
5
Break-Even, Margin of Safety, and Target Net Income
LO
5Slide71
Comprehensive
Comprehensive
5
Break-Even, Margin of Safety, and Target Net Income
Zootsuit
Inc. makes travel bags that sell for $56 each. For the coming year,
management expects fixed
costs to total $320,000 and variable costs to be $42 per unit.
Compute
break-even
point in dollars using the contribution margin (CM)
ratio.
Contribution margin ratio
=
[($56
-
$
42
)
÷ $56] = 25%Break-even sales in dollars = $320,000 ÷ 25% = $1,280,000
LO
5Slide72
Margin
of safety = $1,382,400 - $1,280,000 = $102,400
Margin of safety ratio =
$102,400 ÷ $1,382,400 = 7.4%
Comprehensive
Comprehensive
5
Break-Even, Margin of Safety, and Target Net Income
Zootsuit
Inc. makes travel bags that sell for $56 each. For the coming year,
management expects fixed
costs to total $320,000 and variable costs to be $42 per unit.
Compute the
margin of safety and margin of safety ratio assuming actual sales are $
1,382,400.
LO
5Slide73
Required
sales in dollars = ($320,000 + $410,000) ÷
25% = $2,920,000
Comprehensive
Comprehensive
5
Break-Even, Margin of Safety, and Target Net Income
Zootsuit
Inc. makes travel bags that sell for $56 each. For the coming year,
management expects fixed
costs to total $320,000 and variable costs to be $42 per unit.
Compute the
sales dollars required to earn net income of $410,000
.
LO
5Slide74
“Copyright ©
2015
John Wiley & Sons, Inc. All rights reserved. Reproduction or translation of this work beyond that permitted in Section 117 of the 1976 United States Copyright Act without the express written permission of the copyright owner is unlawful. Request for further information should be addressed to the Permissions Department, John Wiley & Sons, Inc. The purchaser may make back-up copies for his/her own use only and not for distribution or resale. The Publisher assumes no responsibility for errors, omissions, or damages, caused by the use of these programs or from the use of the information contained herein.”
Copyright