
TiVA indicators practical solutions using available data sources Norihiko YAMANO OECD Directorate for Science Technology and Innovation International Conference on the Measurement of Trade and Economic ID: 1040288
Download Presentation The PPT/PDF document "Development of Inter-country Input-Ou..." is the property of its rightful owner. Permission is granted to download and print the materials on this web site for personal, non-commercial use only, and to display it on your personal computer provided you do not modify the materials and that you retain all copyright notices contained in the materials. By downloading content from our website, you accept the terms of this agreement.


1. Development of Inter-country Input-Output Table for OECD-WTO TiVA indicators : practical solutions using available data sourcesNorihiko YAMANOOECD Directorate for Science, Technology and InnovationInternational Conference on the Measurement of Trade and Economic Globalization,Aguascalientes, 29 September – 1 October, 2014
2. ICIO database, a core model for TiVASpecification of ICIO database required for TiVA indicatorsIdeal statistics to build ICIOReasons of asymmetries and unharmonised reported statisticsMethodologyWishlist (short-term)Outline2
3. Core of the TiVA database is an economic model based on Inter-Country Input-Output table (ICIO).ICIO models allow us to analyse Trade in Value-added & Global Value-ChainsForeign contents in consumption and exportsJobs sustained by foreign demandCarbon emissions embodied in tradeICIO and policy applications3
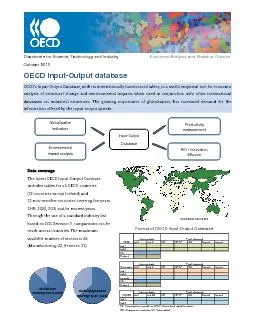
4. What does ICIO look like?4November 2014 release34 Industry (ISIC rev3)61 countries and regional average e.g. 34 OECD, BRIICS, G20, EU28, NAFTA, ASEAN*, APEC*)Year: 1995,2000,05,08,09,10, 2011*Format: industry-by-industry, basic price
5. Collection of national data sourcesHarmonisation and filling gapsNational Accounts main componentsSectoral constraints of value-added and outputNational I-O and Use tablesBilateral trade in goods and servicesNumerical adjustment for solving asymmetries in bilateral trade coefficientsGlobal use table and ICIOIndicator calculations & DisseminationDevelopment flow5
6. Official published I-O/SUT, National Accounts and Trade databases used for Institutional long-termRecognized starting pointBenchmarked to National Accounts (final expenditures, value-added, output, definitions of exports and imports)Benchmarked to Balance of Payment trade balancesRest of the world (closed model)Our approach6
7. Both in purchasers’ prices and basic price Domestic and import tablesEnough sectoral details to aggregate to harmonised sector classificationCompatible with BoP / SNA (at least definitions)1) Ideal I-O/SUT to build an ICIO7
8. ‘Output and Value-added’ 8Output = Intermediate inputs + imports + taxes less subsidies + Value added componentsExports = Expenditure by non-resident in domestic and foreign territoriesImports = Expenditure by residents in domestic and foreign territoriesHousehold consumption (by residents)Capital formationRecycling source appears in inventory adjustment‘Trade’
9. OECD National Input-Output databaseDomestic table9
10. For combining with national SUTs or IOTs:best estimates of bilateral trade in goods and services by industry (product group) and by end-use (intermediate and final consumption) … Bilaterally consistent (mirror trade)cif/fob margin allocation to origin transport support activities Reflect recent production activities Complete (by product and partners)Compatible with BoP / SNA (SUTs and IOTs)Reexports and reimports by origin & destination2) Ideal trade statistics to build an ICIO10
11. Data sourcesSupply-use and Input-Output tables (National sources/ Eurostat / Asian Dev Bank)Bilateral trade statistics for goods and services (OECD / UN)National Accounts: main aggregate and satellite (NSIs, OECD, UN)Balance of Payments (National source / IMF) Intermediate analytical data products at OECD Harmonised symmetric Input-Output tables (OECD I-O) Bilateral Trade Database by Industry and by End-use for goods (BTDIxE) Sectoral Value-Added (STAN) Harmonised Bilateral Trade in Services (OECD-WTO) Adjusted National Accounts (currency, discrepancy and re-exports)Data sources for OECD Inter-country inter-industry model11
12. Harmonisation issues of SNA and National IO/SUTPrice valuation (producers’price / basic price/purchasers’price)Relationship between imported goods and trade related services (cif/fob)Non-resident expenditures (65-75 % svc)Time series comparability (services)General data issues12
13. CSSP: Expert Group on Extended Supply and Use TablesCoordinate contributions from other international organisations including Eurostat, APEC, ADB, UN ECLAC and UN ESCWAWPTGS: Reflection Group on more detailed services trade statistics, as well as active appeals for certain service category data (for CIF/FOB adjustments)Analytical work on trade asymmetries as well as facilitation of bilateral meetings on asymmetries via WPTGSWPTGS stocktaking questionnaire on activities at NSOs related to linked trade and business statistics (TEC, TEC+, STEC)Analytical work on CIF/FOB ratios for countries reporting imports on both CIF and FOB basis (few)Comparing trade by industry data from SUTs, TEC and using conversion keysWide ranging activities to improve underlying statistics13
14. Balancing issues: Bilateral trade14
15. Difference: reported imports – sum of key partners’ exports (2011)OECD BTDIXE 2013ed15
16. 16
17. Costa RicaWhat is happening ? Not all due to multiple counting of re-exports? High transport costs, big mark-ups, transfer pricing by MNEs ?BTDIxE201317
18. After collection and filling gaps for 212 economies …Classification conversion: reported HS, EBOPS, national industry classification Estimation of bilateral trade flows in use table sector classificationEstimation of national IO and use tables reconciled with NA based figuresBalancing international trade flow using adjusted use table and bilateral partner sharesMethodology18
19. 3 SNA end-use categoriesIntermediate inputs Household consumption Capital goods 5 mixed end-uses packed medicaments personal computerspassenger cars phones (fixed and mobile)valuables+ other n.e.cBTDIxE end-use categories 19
20. Adjusting merchandise trade statistics to NA framework (goods exports)20
21. 21 Beyond 6digit trade statistics:Used (second-hand) productsSource:Eurostat
22. National accounts benchmarkedReconciliation of exports and imports at EBOPS at 10 categ.(OECD-WTO)Filling gaps (unavailable pairs, construction and renting equipment)Converted to product dimension in SUTBilateral trade flows Adjusting bilateral trade in services22
23. Stage 1: Reconciliation of sectoral exports and importsSum of total exports of goods and services of all countries matches total imports Stage 2: Reconciliation of national SUTs using adjusted trade vectors and national accounts constraintsStage 3: Linking national use table with bilateral trade coefficientsBalancing procedure of Wang et al (2013), eds Mattoo, Wang & Wei23
24. Balancing Inter-country Use table (ICUT)24
25. Statistics that are timely and nationally consistent (across sources)Statistics with appropriate detailed breakdowns (by country and industry/product category) which are internationally comparableAn international trade matrix that is perfectly symmetrical, complete (no missing values), consistent with data in IO/SUT/NA, and converted to end-use categoriesWishlist (short-term)25
26. Data sourcesAvailableRequirementExtended ICIO/SUTValue added and OutputSNA: Value-added and Output by Industry (all) Manuf. Census/SBS: detail sectoral infoBy product By HGTFinal expenditurePurchasers’ pricesBasic price *HGT: Heterogeneity within industry e.g. exporter/non-exporter, firm size, Processing/domestic, foreign-owned, sub-national regions26
27. Data sourcesAvailableRequirementExtended ICIO/SUTTrade (national total)BOP (total goods and services)Conversion from EBOPS to product and industry dimensionsBilateral tradeExport fob, pu pricesImport cif, pu pricesService by EBOPS(6dgt – 10dgt)Trade partner shares by end-use category;International trade margin, fob and basic price based estimateImport partner shares by HGT*HGT: Heterogeneity within industry e.g. exporter/non-exporter, firm size, Processing/domestic, foreign-owned, sub-national regions27
28. Data sourcesAvailableRequirementExtended ICIO/SUTInput-OutputSIOT(p x p) Import matrices (p x p)Use tableUse pu prices and pr pricesUse at bpImport (p x i)Harmonisation with SNATrade margin, tax-less-subsidy on products, non-resident expendituresSupplyCountry total supply by industrySupplying industry by exported and domestically consumed productsSupply (product by exporter & non-exporter)28
29. THANK YOU www.oecd.org/trade/valueadded 29