

W Art Chaovalitwongse Rutgers University Joint work with YJ Fan Rutgers and RC Sachdeo Jersey Shore University Hospital This work is supported in part by research grants from NSF CAREER Grant CCF ID: 919013
Download Presentation The PPT/PDF document "Support Feature Machine for Classificati..." is the property of its rightful owner. Permission is granted to download and print the materials on this web site for personal, non-commercial use only, and to display it on your personal computer provided you do not modify the materials and that you retain all copyright notices contained in the materials. By downloading content from our website, you accept the terms of this agreement.


Slide1
Support Feature Machine for Classification of Abnormal Brain Activity
W. Art ChaovalitwongseRutgers University*Joint work with Y.J. Fan (Rutgers) and R.C. Sachdeo (Jersey Shore University Hospital)
This work is supported in part by research grants from NSF CAREER Grant CCF 05-46574 and Rutgers Research Council Grant-02028.
Poster #16, Mon Aug 13
Slide2Agenda
Research ObjectivesResearch BackgroundEpilepsy and seizuresElectroencephalogram (EEG) time series Signal processingSupport Feature MachineEmpirical Results
Concluding Remarks
Slide3Objectives:
Develop a new pattern recognition and classification framework for multi-dimensional time series data – as a decision making support.Application in EpilepsyIdentification of Seizure Pre-Cursor: Classification of seizure susceptibility periods
Quick Screening Tool: Classification of epilepsy and non-epilepsy patientsSeizure Prediction: Anomaly (Seizure Pre-Cursor) detectionGeneralize the framework to other applications that have to deal with multi-dimensional time series data.
Slide4How many people having epilepsy?
“The Swamp”: Seating capacity ~90,000
Slide5Epilepsy and Seizures
Nearly 3 million people in the U.S. (1% of population) have epilepsy. Anyone, at any age, can develop it.Epilepsy is defined as recurring seizures – sudden, brief changes in the way the brain works.Seizures cause temporary disturbances of brain functions such as motor control, responsiveness and recall which typically last from seconds to a few minutes.
Seizures usually occur spontaneously, in the absence of external triggers.Seizures may be followed by a post-ictal period of confusion or impaired sensorial that can persist for several hours.
Slide6Intracranial EEG Acquisition
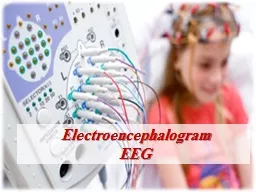
Slide7Electroencephalogram (EEG)
…is a traditional tool for evaluating the physiological state of the brain. …offers good spatial and excellent temporal resolution to characterize rapidly changing electrical activity of brain activation
…captures voltage potentials produced by brain cells while communicating. In an EEG, electrodes are implanted in deep brain or placed on the scalp over multiple areas of the brain to detect and record patterns of electrical activity and check for abnormalities.
Slide810-second EEGs: Seizure Evolution
Normal
Pre-Seizure
Seizure Onset
Post-Seizure
Slide9Open Problems
Seizure pre-cursors exist?Seizure is a state transition process?Can we discriminate normal EEGs from pre-seizure EEGs (seizure susceptibility period)?
Slide10Data Transformation Using Chaos Theory
Measure the brain dynamics from time series:Stock MarketCurrency Exchanges (e.g., Swedish Kroner)Apply dynamical measures (based on chaos theory) to non-overlapping EEG epochs of 10.24 seconds = 2048 points.
Maximum Short-Term Lyapunov Exponentmeasure the average uncertainty along the local eigenvectors and phase differences of an attractor in the phase spacemeasure the stability/chaoticity of EEG signalsIasemidis, Shiau, Chaovalitwongse, Sackellares & Pardalos, IEEE Transactions on Biomed (2003)
Slide11Measure of Chaos
Slide12Classification of Physiological States
Slide13Support Vector Machine VS Support Feature Machine
Feature 1
Feature 2
Feature 3
Feature 1
Feature 2
Feature 3
Slide14Nearest Neighbor for Time Series
Normal
Pre-Seizure
A
d
1
: Average distance to
blues
.
d
2
: Average distance to
reds
.
d
2
<
d
1
, so new point is classified as
red
.
Slide15Similarity Measures
Dynamic Time Warping (DTW) DistanceEuclidean DistanceT-Statistical Distance
X
Y
D(X, Y)
STLmax
1, 2, 3, ….. , 30
Electrode 1
2
3
.
.
.
.
.
26
STLmax
1, 2, 3, ….. , 30
Slide16Support Feature Machine
Given an unknown epoch of EEG signals A, we calculate statistical distances between the EEG epoch and the groups of Normal and Pre-Seizure EEGs in our data baseline.
Euclidean distanceT-statistical distanceDynamic Time WarpingEEG sample A will be classified in the group of patient’s state (normal or pre-seizure) that yields the minimum statistical distance.Multiple Electrodes = Multiple DecisionsAveraging
Majority Voting: selects action with maximum number of votesCan we select/optimize the selection of a subset of electrodes that maximizes number of correctly classified samples.
Chaovalitwongse et al.,
Submitted to
Operations Research
Slide17Decision Rule: Basic Ideas
Two different average distances for each sample at each electrode are calculated:Intra-Class: Average distances from each sample to all other samples in the same class at Electrode jInter-Class:
Average distances from each sample to all other samples in different class at Electrode jIf for Sample i at Electrode j (Averaging VS Voting)
Average distance to the same class
Average distance to different class
<
Then Sample
i
is
correctly
classified.
Slide18Optimization Model I: Averaging
Intra-Class
Inter-Class
Chaovalitwongse et al.,
Submitted to
Operations Research
Slide19Model I: Averaging Formulation
Chaovalitwongse et al.,
Submitted to KDD, 2007 and Operations Research
Slide20Optimization Model II: Voting
Precision matrix,
A
contains elements of
Chaovalitwongse et al.,
Submitted to
Operations Research
Slide21Decision Rule: Basic Ideas
Two different average distances for each sample at each electrode are calculated:Intra-Class: Average distances from each sample to all other samples in the same class at Electrode jInter-Class:
Average distances from each sample to all other samples in different class at Electrode jIf for Sample i at Electrode j (Averaging VS Voting)
Average distance to the same class
Average distance to different class
<
Then Sample
i
at
Electrode
j
is
correctly
classified.
Chaovalitwongse et al.,
Submitted to
Operations Research
Slide22Model II: Voting Formulation
Chaovalitwongse et al.,
Submitted to
KDD, 2007 and Operations Research
Slide23Data Selection and Sampling
EEG Dataset Characteristics
Patient ID
Seizure types
Duration of EEG(days)
# of seizures
1
CP, SC
3.55
7
2
CP, GTC, SC
10.93
7
3
CP
8.85
22
4
,SC
5.93
19
5
CP, SC
13.13
17
6
CP, SC
11.95
17
7
CP, SC
3.11
9
8
CP, SC
6.09
23
9
CP, SC
11.53
20
10
CP
9.65
12
Total
84.71
153
CP: Complex Partial; SC subclinical; GTC: Generalized Tonic/Clonic
Randomly and uniformly sample 3 EEG epochs per seizure from each of normal and pre-seizure states.
For example, Patient 1 has 7 seizures.
There are 21 normal and 21 pre-seizure EEG epochs sampled.
Seizure
Seizure
Duration of EEG
30 minutes
30 minutes
8 hours
8 hours
8 hours
8 hours
Pre-seizure
Normal
Slide24Sensitivity and Specificity
Sensitivity measures the fraction of positive cases that are classified as positive. Specificity measures the fraction of negative cases classified as negative.
Sensitivity = TP/(TP+FN)Specificity = TN/(TN+FP)
Sensitivity can be considered as a detection (prediction or classification) rate that one wants to maximize.
False positive rate can be considered as 1-Specificity which one wants to minimize.
Slide255-Fold Cross Validation Result
Chaovalitwongse et al., Submitted to Operations Research
81.29% 72.86%
Optimize the number of neighbors
Chaovalitwongse et al.,
IEEE Trans Systems, Man, and Cybernetics: Part A
, 2008
Slide26DTW
Euclidean
T-Statistics
Slide27DTW
Euclidean
T-Statistics
Slide28Com
User
Interface
Technology
Multichannel
Data Acquisition
Pattern
Recognition
Initiate a variety of
therapies (e.g., electrical stimulation, drug injection)
VNS
Automated Seizure Prediction Paradigm
Drug
Feature Extraction/ Cluster Analysis
Slide29Concluding Remarks
Overview of a Real Life Medical Problem in Spatio-Temporal Data MiningApplications of Data Mining and Optimization TechniquesPotential Applications in Medical DiagnosisAutomated seizure warning system
Monitoring devices for clinical use in epilepsy monitoring units (EMUs) and intensive care units (ICUs)Other monitoring procedures in trauma and operation roomsImprovement of the Nearest Neighbor Classification in Time Series Classification - New Classification Framework
Slide30W. Chaovalitwongse
, Y.J. Fan, R.C. Sachdeo. Novel Optimization Models for Multidimensional Time Series Classification: Application to the Identification of Abnormal Brain Activity. Submitted to Operations Research.Y.J. Fan, W. Chaovalitwongse, L.D. Iasemidis
, R.C. Sachdeo. Multi-Dimensional Time Series Classification for Identification of Epilepsy Patients. Submitted to KDD 2007.W. Chaovalitwongse, Y.J. Fan, and R.C. Sachdeo. On the K-Nearest Dynamic Time Warping Neighbor for Abnormal Brain Activity Classification. To appear in IEEE Transactions on Systems, Man, and Cybernetics, Part A: Systems and Humans
, 2008.W. Chaovalitwongse and P.M. Pardalos. On the Time Series Support Vector Machine using Dynamic Time Warping Kernel for Brain Activity Classification. To appear in
Cybernetics and Systems Analysis
, 2007
W. Chaovalitwongse
, P.M. Pardalos, and O.A. Prokopyev. Electroencephalogram (EEG) Time Series Classification: Applications in Epilepsy.
Annals of Operations Research
, 148: 227-250, 2006.
W. Chaovalitwongse
, L.D.
Iasemidis
, P.M. Pardalos, P.R. Carney, D.-S. Shiau, and J.C. Sackellares. A Robust Method for Studying the Dynamics of the Intracranial EEG: Application to Epilepsy.
Epilepsy Research, 64, 93-133, 2005
.
W. Chaovalitwongse
, P.M. Pardalos, L.D.
Iasemidis
, D.-S. Shiau, and J.C. Sackellares. Dynamical Approaches and Multi-Quadratic Integer Programming for Seizure Prediction.
Optimization Methods and Software, 20 (2-3): 383-394, 2005
.
Reference
Slide31Acknowledgements
Comprehensive Epilepsy Center, St. Peter’s University HospitalRajesh C. Sachdeo, MD
Rutgers Ph.D. StudentYa-Ju Fan, MS
Industrial and Systems Engineering, University of Florida
Panos M. Pardalos, PhD
Bioengineering, Arizona State University
Leonidas D.
Iasemidis
, PhD