

moment in ships Shear force and Bending MomentCaptSNathan 1 Shear force is a force which tends to break or shear a beam across perpendicular to its major axis Bending moment at any point on abeam is the total moment tending to alter the shape of the beam ID: 1003617
Download Presentation The PPT/PDF document "Shear force and Bending" is the property of its rightful owner. Permission is granted to download and print the materials on this web site for personal, non-commercial use only, and to display it on your personal computer provided you do not modify the materials and that you retain all copyright notices contained in the materials. By downloading content from our website, you accept the terms of this agreement.


1. Shear force and Bending moment in shipsShear force and Bending Moment-Capt.S.Nathan1
2. Shear force is a force which tends to break or shear a beam across (perpendicular to) its major axis.Bending moment at any point on abeam is the total moment tending to alter the shape of the beam.Shear force and Bending Moment-Capt.S.Nathan2
3. When a ship is floating in still water conditions the hull will experience longitudinal deflections created by the uneven distribution of weight forces and buoyancy forces along its length. These stresses will always exist no matter how the ship is loaded and will never be totally eliminated. When floating freely, the forces of gravity and buoyancy, acting on the ship, are equal.The force of gravity, acting on the ship, would have different values at various places along the ship's length depending on the longitudinal distribution of the weights on board, including the weight of the hull itself.The force of buoyancy also would have different values at various points along the length of the ship as it depends on the shape of the underwater part of the hull in the vicinity of the point under consideration.If the vessel is box-shaped and on an even keel, the force of buoyancy would act evenly all along the length of the ship. If the box-shaped vessel is trimmed by the stern, buoyancy would be more at the stern and less at the bow, and vice versa, but the total buoyancy must always be equal to the total gravity experienced.Shear force and Bending Moment-Capt.S.Nathan3
4. In still water a ship will experience shearing forces and bending moments as a consequence of uneven distribution of weight forces and buoyancy forces acting along its length.Consider a box-shaped vessel of uniform construction having three holds of equal length. The light displacement of the vessel is 9000 tonnes and it is floating on an even keel.The vessel will displace a mass of water equal to the displacement of the vessel in the light condition. The total weight force (Wf) acting downwards equals the total buoyancy force (Bf) acting upwards.Since each of the holds are the same length, the weight force attributable to each hold will be the same, being 3000 tonnes for each. The volume (and hence mass) of water displaced by each hold will also be the same, 3000 tonnes. It can be seen that the distribution of weight force and buoyancy force exactly matches throughout the length of the vessel and in this condition the vessel's structure will experience no stress.Shear force and Bending Moment-Capt.S.Nathan4
5. 6000 tonnes of bulk cargo is now loaded into No. 2 hold and is trimmed level.The buoyancy force is evenly distributed along the length of the vessel, since 5000 tonnes of water is displaced by each hold, however, the distribution of the weight force is not the same as can be seen.Shear force and Bending Moment-Capt.S.Nathan5
6. In numbers 1 and 3 holds there is an excess of buoyancy force of 2000 tonnes, whereas in number 2 hold there is an excess of weight force of 4000 tonnes. These excesses of weight forces and buoyancy forces create the shearing forces. The shearing forces are the vertical forces that tend to cause the ship to be sliced into different parts. Consider what would happen to the vessel in the above Figure if each hold could float independently of the others.Shear force and Bending Moment-Capt.S.Nathan6But the vessel would not shear at the bulkheads as illustrated; the ship would experience bending moments that in this instant would cause the vessel to be sagged. The opposite situation arises when a vessel is loaded at the ends and less in the amidships section, causing the vessel to be hogged.
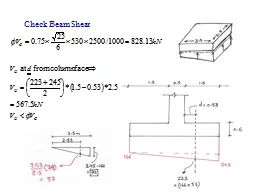
7. Simple Shear Force and Bending Moment Diagrams for Box-Shaped VesselsThe values of shear force and bending moment can be easily calculated for any position within the box-shaped vessel’s length. However, it should be evident that the maximum values of shear force will occur at the bulkhead positions. Following example which details a method of calculating the values of loads, shear forces and bending moments.Example 1In the light condition a box-shaped vessel is 45 m in length, 8 m in breadth and floats at a draught of 3.0 m in fresh water. The vessel has three holds each 15 m in length. 90 tonnes of bulk cargo is loaded into number 2 hold and is trimmed level. For the loaded condition construct the following:a. load curve;b. curve of shear forces,c. curve of bending moments.d. Identify the positions where the maximum shearing forces and bending moments occur.Shear force and Bending Moment-Capt.S.Nathan7
8. Values of shear forces and bending moments are to be calculated at 5 metre intervals starting from the after perpendicular (AP) and at amidships (22.5 m foap).Producing the Curve of Loads (a)1. Calculate the distribution of the lightweight displacement of the vessel. Light displacement = (L x B x d) x density Light displacement = (45 x 8 x 3.0) x 1.000 = 1080 tonnesBeing a box-shaped vessel of uniform construction the lightweight displacement evenly distributed = 24 t/m2. Calculate the distribution of all deadweight items (cargo).Cargo evenly distributed in No. 2 hold = 90t/15m = 6 t/m Shear force and Bending Moment-Capt.S.Nathan8
9. 3. Calculate the load displacement and distribution of the buoyancy force.Load displacement = Light displacement + DeadweightLoad displacement = 1080 + 90 = 1170 tonnesBeing a box-shaped vessel of uniform construction the buoyancy force evenly distributed 1170/45 m = 26t/m4. Calculate the loads in each hold and plot the ‘load curve’.The load in tonnes per metre represents the excess of buoyancy force or weight force in each hold. The load curve is shown in the Figure.Note: Because total weight force equals total buoyancy force, it follows that the excesses of buoyancy force (represented by the area above the base line) and the excesses of weight force (represented by the area below the base line) must also be equal. This is always the case. Note also that the unit of load is tonnes/metre.Shear force and Bending Moment-Capt.S.Nathan9HoldLightweightDeadweightTotal wfBfLoadNo.(t/m)(t/m)(t/m)(t/m)(t/m)324024262 upward224630264 downward124024262 upward
10. Producing the Curve of Shear ForcesThe shear force at any position is defined as being the algebraic sum of the loads acting to the left (or right) of the position in question and is measured in tonnes.Integrating the load curve will produce the curve of shear forces.The maximum shear force values will arise at the positions where the loads change direction, being at the bulkhead positions.Consider the aforementioned definition of shear force. For our purposes this definition of shear force can be modified to read as being the area under the load curve to the left of the point in question.Therefore; SF at AP - 0 tonnes (since there is no area to the left of the AP under the curve!)Placing a sheet of paper over the curve and moving it to the right at 5 metre intervals, calculate the net area to the left of the edge of the sheet for each point in question.SF at 5 m foap (forward of After Perpendicular) = 2t/m x 5m=10 tonnes.Now calculate the SF value at 10 m foap (by moving the paper further to the right and revealing more of the curve to the left.SF at 10 m foap = 2 t/m x 10 m = 20 tonnes.SF at 15 m foap (Bulkhead 3/2) = 2 t/m x 15 m = 30 tonnes.Shear force and Bending Moment-Capt.S.Nathan10
11. At 20 m foap there is area revealed above and below the baseline and this is treated as positive and negative as per the load scale.SF at 20 m foap =(2 t/m x 15 m) + (-4 t/m x 5 m) = 10 tonnes.Continuing with this method gives:SF at amidships (22.5 m foap) = (2t/m x 15 m) + (-4 t/m x 7.5 m) = 0 t SF at 25 m foap = (2 t/m x 15 m) + (-4 t/m x 10 m) =-10 tonnes.SF at 30 m foap (bulkhead 2/1) = (2 t/m x 15 m) +(-4 t/m x 15 m) = -30 t SF at 35 m foap = (2t/m x 15 m) + (-4 t/m x 15 m) + (2 t/m x 5 m) = -20t SF at 40 m foap - (2 t/m x15 m)+ (-4 t/m x15 m) + (2 t/m x 10 m) = -10t SF at 45 m foap = (2t/m x 15 m) + (-4 t/m x 15 m) + (2 t/m x 15 m) = 0Shear force and Bending Moment-Capt.S.Nathan11
12. In summary, the values of Shear Force are as follows:The curve of shear forces can now be plotted as shown in the Figure.Shear force and Bending Moment-Capt.S.Nathan12From AP(m)0510152022.52530354045SF(t)0102030100-10-30-20-100
13. Producing the Curve of Bending MomentsThe bending moment values are calculated in exactly the same way as the shear force values, by considering the areas under the shear force curve to the left of the position in question.The area of a triangle is given by:Area = ½ Base x Perpendicular heightArea of a trapezium is given by: Area = x baseThe bending moment values are calculated as follows:BM at AP= 0 tonnes (since there is no area to the left of the AP under the SF curve!)Placing a sheet of paper over the curve and moving to the right as far as the first bulkhead position (Bulkhead 3/2), calculate the areas as before. Shear force and Bending Moment-Capt.S.Nathan13BM 5 m foap = ½ x 5 m x10t = 25 t-m BM 10 m foap = ½ x10mx20t = 100 t-mBM 15 m foap (bulkhead3/2) = ½ x 15 m x 30t= 225 t-m
14. Once past bulkhead 3/2 it is necessary to consider the area of a trapezium formed by the area under the shear force curve to the right of the bulkhead as seen in the figure.BM 20 m foap = 225 + x 5m)=325 t-m BM at amidships (22.5 m foap) = ½ x 22.5 x 30 = 337.51 mBM at 25 m foap = 337.5 t-m + (½ x 2.5 m x -10t) = 325 t-m(Since we know the area from 0 to 22.5 m foap, being 337.5t-m)BM at 30 m foap (bulkhead 2/1) = 337.5 + (½ x 7.5 m x -30 t) = 225 t-m BM at 35 m foap = 225 + x 5 m) = 100 t-m (Since we know the area from 0 to 30 m foap, being 225 t-m)BM at 40 m foap = 225 + x10 m) = 25t-m BM at FP = 0 t-m Shear force and Bending Moment-Capt.S.Nathan14
15. In summary, the values of Bending Moment are as follows:Shear force and Bending Moment-Capt.S.Nathan15Summary:The maximum shear force values occur at the positions where the direction of the loads change direction; at the bulkheads being: 30 tonnes at 15 m foap (in line with bulkhead 3/2), and; 30 tonnes at 30 m foap (in line with bulkhead 2/1)2. The maximum bending moment value of (337.5 t-m) occurs at amidships (22.5 m foap), where the shear force value is zero.3. It should be noted that a point of inflexion of the bending moment curve will occur in any position where there is a shear force maximum(at the bulkhead positions in this example).From AP(m)0510152022.52530354045BM(t-m)025100225325337.5325225100250
16. Shear force and Bending Moment-Capt.S.Nathan16
17. Example 2A box shaped vessel has length 80 m and breadth 10 m and is floating in the light condition at a draught of 3.0 m in water RD 1.010. It is divided into four holds of equal length. Cargo is loaded as follows:No. 1 120 tonnes,No. 2 120 tonnes,No. 3 empty,No. 4 160 tonnes.Construct the curves of shear force and bending moment, calculating the maximum values and stating the positions where they occur.Producing the Load CurveStep1- Calculate the distribution of the lightweight displacement of the vessel.Light displacement = (L x B x d) x densityLight displacement = (80 x 10 x 3.0) x 1.010 = 2424 tonnesBeing a box-shaped vessel of uniform construction the lightweight displacement evenly distributed 2424t/80 m = 30.3 t/mStep2- Calculate the distribution of all deadweight items (cargo).Cargo evenly distributed in No. 1 hold =120/20m = 6 t/mCargo evenly distributed in No. 2 hold is also 6 t/mCargo evenly distributed in No. 4 hold = 160t/20m = 8 t/mShear force and Bending Moment-Capt.S.Nathan17
18. Step 3- Calculate the load displacement and distribution of the buoyancy force.Load displacement = Light displacement + DeadweightLoad displacement = 2424 + 120 + 120 + 160 = 2824 tonnesBeing a box-shaped vessel of uniform construction the buoyancy force evenly distributed 2824t/80 m = 35.3 t/mStep 4- Calculate the loads in each hold and plot the 'load curve’.The load in tonnes per metre represents the excess of buoyancy force or weight force in each hold.The load curve is shown in Figure Shear force and Bending Moment-Capt.S.Nathan18Hold No.Lightweight (t/m)Deadweight (t/m)Total wf (f/m)Bf (t/m)Load (t/m)430.3838.335.33 downward330.3030.335.35 upward230.3636.335.31 downward130.3636.335.31 downward
19. Step 5- Producing the Shear Force CurveCalculate values at 10 metre intervals using the procedure previously described.SF atAP=0 tonnesSF at 10 m foap = (-3 t/m x 10 m) = -30 tonnesSF at 20 m foap (bulkhead 4/3) = (-3 t/m x 20 m) = -60 tonnesSF at 30 m foap = -60 t + (5 t/m x 10 m) = -10 tonnesSF at 40 m foap (bulkhead 3/2 and amidships) = -60 t + (5 t/m x 20 m) = 40 tonnesSF at 50 m foap = 40t + (-1 t/m x 10 m) = 30 tonnes SF at 60 m foap (bulkhead 2/1) = 40t + (-1 t/m x 20 m) = 20t SF at 70 m foap = 20 t + (-1 t/m x 10 m) = 10 tonnes SF at 80 m foap (FP) = 20 t + (-1 t/m x 20 m) = 0 tonnesShear force and Bending Moment-Capt.S.Nathan19
20. In summary, the values of Shear Forces are as follows:Shear force and Bending Moment-Capt.S.Nathan20From AP(m)01020304050607080SF(t)0-30-60-10403020100
21. It can be seen that the position of zero shear force lies in hold no. 3 and the value of the bending moment must be calculated for this position as it will be a maximum value. The position of this maximum value could be estimated from the shear force curve (about 32 m foap) but it is more accurate to calculate it by using the similar triangles created by the shear force values for the bulkhead positions 4/3 and 3/2 as shown in Figure.Let the position be ‘x’ metres from bulkhead 4/3 where the total hold length is 20 metres.In the similar triangles:x/60 = (20- x)/40 Therefore: 40x = 60(20 - x)40x = 1200- 60x ∴ 40x + 60x = 1200100x= 1200 ∴ x= 12 metresThe position of zero shear force is at 32 m foap.Shear force and Bending Moment-Capt.S.Nathan21
22. Step 6- Producing the Bending Moment CurveCalculate values at 10 metre intervals including that for 32 m foap using the procedure previously described.BM atAP= 0 t-mBM 10 m foap = ½ x 10 m x -30t = -150 t-mBM 20 m foap (Bulkhead 4/3) = ½ x 20 m x -60t = -600 t-mBM at 30 m foap = -600 t-m + Area trapezium 20 m to 30 m foap = -600 t-m + x 10m = -950 t-mBM at 32 m foap (zero SF) = -600 t-m + (½ x12 m x-60t) = -960 t-m BM at 40 m foap (Bulkhead 3/2) = -960 + (½ x 8m x40t) = -800 t-m (Amidships) BM at 50 m foap = -800 t-m + Area trapezium 40 m to 50 m foap = -800 t-m + x10 m = -450 t-mBM at 60 m foap (Bulkhead 2/1) = -800 t-m + Area trapezium 40 m to 60 m foap = -800t-m + x20 m =-200t-m BM at 70 m foap = -200 t-m + Area trapezium 60 m to 70 m foap = -200t-m + x10 m = -50t-m BM at 80 m foap (FP) = -200 t-m + (½ x 20 m x 20t) = 0 t-mCalculating these values is tedious and a large-scale graph of the shear force curve will make life a lot easier. Remember that it is just a matter of calculating the area to the left of the position in question each time. Shear force and Bending Moment-Capt.S.Nathan22
23. SummaryThe maximum shear force values are as follows:60 tonnes at 20 m foap (in line with bulkhead 4/3), and;40 tonnes at 40 m foap (in line with bulkhead 3/2)The maximum bending moment value of-960 t-m occurs at 32 m foap, where the shear force value is zero.Shear force and Bending Moment-Capt.S.Nathan23From AP(m)0102030324050607080BM(t-m)0-150-600-950-960-800-450-200-500In summary, the values of Bending Moment are as follows:
24. loading instrumentShear force and Bending Moment-Capt.S.Nathan24
25. So far only the causes of longitudinal bending in still water (or the harbour condition) have been discussed. A well-loaded ship subjected to minimal stress in still water will encounter cyclical longitudinal bending when encountering waves at sea. The extreme case scenario occurs at sea when the ship encounters waves where the wavelength is equal to the ship’s length and either of the following occurs:The ship is caused to sag when the trough is amidships and the wave crests are at the ends, or;the ship is caused to hog when the wave crest is amidships and the troughs are at the ends.Ships are built assuming the worst possible wave profile to be encountered by the ship that will create the worst possible longitudinal bending moments.Shear force and Bending Moment-Capt.S.Nathan25
26. Typical assumptions might be: 1. the wave is trochoidal in form. 2. the wave length is equal to the ship’s length between perpendiculars. 3. the wave height is equivalent to that given by: 0.617√L (metres) where L is the ship’s LBP.Shear force and Bending Moment-Capt.S.Nathan26
27. Unlike bending in still water, the bending due to waves alone will alternate in direction as the wave passes along the length of the ship. The absolute worst case scenarios assumed by loading programme manufacturers by necessity must be one of the following depending on how the ship is loaded at the time the loading programme is being used for stress calculations:An initially sagged ship in still water encountering a ‘sagging wave’ at sea, or;an initially hogged ship in still water encountering a ‘hogging wave at sea.Shear force and Bending Moment-Capt.S.Nathan27
28. Stress Loading Programme RepresentationsCalculation ConventionsWhen calculating the values of shear force and bending moments in the previous examples the convention followed was:The ship profile considered is always for the starboard side (this is the accepted convention for all ship’s plans);Shear force and bending moment values where calculated starting from the after perpendicular (AP) working forward.For the simple sagged and hogged conditions considered this gave shear force and bending moment curves as depicted in Figure.Shear force and Bending Moment-Capt.S.Nathan28
29. Stress Calculating Programs - System Requirements and Data RepresentationGenerally, ships over 150 metres in length and other ships that are likely to be subjected to excessive longitudinal stresses must be provided with a loading calculator to allow the values of shearing forces and bending moments to be calculated for any condition of loading. This will usually be in the form of a computer programme that has been approved by the classification society whereby a Certificate of Approval will be issued. There are strict guidelines on the use and testing of such programmes and compliance with the appropriate classification society regulations regarding such programmes will be subject to verification during periodical classification society surveys.The loading program should be capable of calculating the following hull girder shear forces and bending moments according to the appropriate classification society regulations: 1. Still water shear forces. 2. Still water bending moments. 3. Still water torsion moments, where applicable (mostly a requirement for container ships). 4. Sea-going condition shear forces.5. Sea-going condition bending moments.6. Sea-going condition torsion moments where applicable.Shear force and Bending Moment-Capt.S.Nathan29
30. Although the actual values of shear forces (in tonnes) and bending moments (in tonnes-metres) for positions along the vessels length will be given these often have little relevance to the operator. It is the visual representation of the shear force and bending moment curves displayed along with the curves representing the maximum permissible values for both the harbour (still water) and sea-going conditions that will convey the true state of loading of the ship to the user.A typical representation is illustrated in FigureShear force and Bending Moment-Capt.S.Nathan30
31. It can be seen that the harbour (still water) limits are higher than those for when the ship is at sea. This allows more leeway when planning a loading schedule, whereby the program will be used to calculate the stress values at intermediate stages during loading in port. Provided that the shear force and bending moment curves do not extend into the red area then the ship will not suffer excessive stress in harbour. Once loading is complete it should be verified that the curves do not extend into the yellow area, representing the acceptable stress limits for when the ship is at sea. The limit settings will be determined by the classification society that will be such that they are at some acceptable percentage of absolute maximum that the structure can withstand, perhaps 80% say. It should be noted that as the ship ages and the effects of corrosion start to take effect to weaken the structure, the maximum permissible shear forces and bending moments can be expected to reduce and this will require the program data to be modified to reflect this.Shear force and Bending Moment-Capt.S.Nathan31
32. It will also be noted that a ship may experience both sagging and hogging at the same time in different parts in the length. This is particularly true at intermediate stages in a loading procedure and when alternate hold loading is required in the case of dense bulk cargoes. A typical fully loaded general cargo ship will invariably be sagged, whereby the aft and fore peak tanks will be empty (along with the excess of buoyancy force that will occur in the vicinity of the engine room) and cargo is in holds extending forward and aft of the amidships region.Most loading programs include the ability to calculate the ship’s stability also. However, it must be emphasised that the program must be classification society approved, and if provided it must be periodically checked by manual calculations. Testing procedures will be stipulated and must be followed. Any program will only be effective if the person using it inputs the correct data!Shear force and Bending Moment-Capt.S.Nathan32
33. SOLAS CH XIIRegulation 11Loading instrument(Unless provided otherwise, this regulation applies to bulk carriers regardless of their date of construction)1 Bulk carriers of 150 m in length and upwards shall be fitted with a loading instrument capable of providing information on hull girder shear forces and bending moments, taking into account the recommendation adopted by the Organization.2 Bulk carriers of 150 m in length and upwards constructed before 1 July 1999 shall comply with the requirements of paragraph 1 not later than the date of the first intermediate or periodical survey of the ship to be carried out after 1 July 1999.3 Bulk carriers of less than 150 m in length constructed on or after 1 July 2006 shall be fitted with a loading instrument capable of providing information on the ship’s stability in the intact condition. The computer software shall be approved for stability calculations by the Administration and shall be provided with standard conditions for testing purposes relating to the approved stability information.Shear force and Bending Moment-Capt.S.Nathan33
34. IACS GUIDELINESGeneralThe scope of a stability calculation software shall be in accordance with the stability information as approved by the administration and shall at least include all information and perform all calculations or checks as necessary to ensure compliance with the applicable stability requirements.Approved stability software is not a substitute for the approved stability information, and is used as a supplement to the approved stability information to facilitate stability calculations.The input/output information should be easily comparable with approved stability information so as to avoid confusion and possible misinterpretation by the operator relative to the approved stability information.An operation manual is to be provided for the onboard computer stability software.The language in which the stability information is displayed and printed out as well as the operation manual is written should be the same as used in the ship’s approved stability information. The society may require a translation into a language considered appropriate.The onboard computer software for stability calculations is ship specific and the results of the calculations are only applicable to the ship for which it has been approved.In case of modifications implying changes in the main data or internal arrangement of the ship, the specific approval of any original stability calculation software is no longer valid. The software is to be modified accordingly and reapproved.Shear force and Bending Moment-Capt.S.Nathan34
35. Calculation SystemsA passive system requires manual data entry,an active system replaces the manual entry with sensors reading and entering the contents of tanks, etc., anda third system, an integrated system, controls or initiates actions based on the sensor- supplied inputs.Types of Stability SoftwareThree types of calculations performed by stability software are acceptable depending upon a vessel’s stability requirements:Type 1Software calculating intact stability only (for vessels not required to meet a damage stability criterion)Type 2Software calculating intact stability and checking damage stability on basis of a limit curve (e g. for vessels applicable to SOLAS Part B-1 damage stability calculations, etc.) or previously approved loading conditions andType 3Software calculating intact stability and damage stability by direct application of preprogrammed damage cases for each loading condition (for some tankers etc.)Shear force and Bending Moment-Capt.S.Nathan35
36. Functional requirements:1 The calculation program shall present relevant parameters of each loading condition in order to assist the Master in his judgement on whether the ship is loaded within the approval limits. The following parameters shall be presented for a given loading condition:- deadweight data;- lightship data;- trim;- draft at the draft marks and perpendiculars;- summary of loading condition displacement, VCG, LCG and, if applicable, TCG;- downflooding angle and corresponding downflooding opening;- compliance with stability criteria: Listing of all calculated stability criteria, the limit values, the obtained values and the conclusions (criteria fulfilled or not fulfilled).Shear force and Bending Moment-Capt.S.Nathan36
37. 2 If direct damage stability calculations are performed, the relevant damage cases according to the applicable rules shall be pre-defined for automatic check of a given loading condition.3 A clear warning shall be given on screen and in hard copy printout if any of the loading limitations are not complied with.4 The data are to be presented on screen and in hard copy printout in a clear unambiguous manner.5 The date and time of a saved calculation shall be part of the screen display and hard copy printout.6 Each hard copy printout shall contain identification of the calculation program including version number.7 Units of measurement are to be clearly identified and used consistently within a loading calculation.Shear force and Bending Moment-Capt.S.Nathan37
38. Data to be enteredShear force and Bending Moment-Capt.S.Nathan38Examples of Pre-programmed input data include the following:1Hydrostatic dataDisplacement, LCB. LCF. VCB. KMt and MCT versus draught.2Stability dataKN or MS values at appropriate heel/ trim angles versus displacement, stability limits3Compartment dataVolume. LCG, VCG, TCG and FSM/ Grain heeling moments vs level of the compartment's contentsExamples of output data include the following1Hydrostatic dataDisplacement. LCB. LCF, VCB. KMt and MCT versus draught as well as actual draughts, trim.2Stability dataFSC (free surface correction). GZ-values. KG. GM, KG/GM limits, allowable grain heeling moments, derived stability criteria, e.g. areas under the GZ curve, weather criteria3Compartment dataCalculated Volume, LCG, VCG, TCG and FSM/ Grain heeling moments vs level of the compartment's contents
39. Approval ProcedureConditions of approval of the onboard software for stability calculations The onboard software used for stability calculations is subject to approval, which is to include; verification of type approval, if any;verification that the data used is consistent with the current condition of the ship.verification and approval of the test conditions;verification that the software is appropriate for the type of ship and stability calculations required.The satisfactory operation of the software with the onboard computers) for stability calculations is to be verified by testing upon installation. A copy of the approved test conditions and the operation manual for the computer/ software are to be available on board.Shear force and Bending Moment-Capt.S.Nathan39
40. Operation ManualA simple and straightforward operation manual is to be provided, containing descriptions and instructions, as appropriate, for at least the following:installationfunction keysmenu displaysinput and output datarequired minimum hardware to operate the softwareuse of the test loading conditionscomputer-guided dialogue stepslist of warningsShear force and Bending Moment-Capt.S.Nathan40
41. Installation TestingTo ensure correct working of the computer after the final or updated software has been installed, it is the responsibility of the ship’s Master to have test calculations carried out according to the following pattern in the presence of a Society surveyorFrom the approved test conditions at least one load case (other than light ship) shall be calculated. Note: Actual loading condition results are not suitable for checking the correct working of the computer.Normally, the test conditions are permanently stored in the computer.Steps to be performed:Retrieve the test load case and start a calculation run; compare the stability results with those in the documentation.Change several items of deadweight (tank weights and the cargo weight) sufficiently to change the draught or displacement by at least 10%. The results are to be reviewed to ensure that they differ in a logical way from those of the approved test condition.Revise the above modified load condition to restore the initial test condition and compare the results. The relevant input and output data of the approved test condition are to been replicated.Alternatively, one or more test conditions shall be selected and the test calculation performed by entering all deadweight data for each selected test condition into the program as if it were a proposed loading. The results shall be verified as identical to the results in the approved copy of the test conditions.Shear force and Bending Moment-Capt.S.Nathan41
42. Periodical TestingIt is the responsibility of the ship’s master to check the accuracy of the onboard computer for stability calculations at each Annual Survey by applying at least one approved test condition. If a Society surveyor is not present for the computer check, a copy of the test condition results obtained by the computer check is to be retained on board as documentation of satisfactory testing for the surveyor's verification.At each Special Survey this checking for all approved test loading conditions is to be done in presence of the surveyor.The testing procedure shall be carried out.Other RequirementsProtection against unintentional or unauthorised modification of programs and data shall be provided.The program shall monitor operation and activate an alarm when the program is incorrectly or abnormally used.The program and any data stored in the system shall be protected from corruption by loss of power.Error messages with regard to limitations such as filling a compartment beyond capacity, or exceeding the assigned load line, etc. shall be included.Shear force and Bending Moment-Capt.S.Nathan42