
Dennis RA Ruchiat Y Permana R P Suyanto S Kurniawan I Maus P Stolle F and Applegate G Site Report September 2000 The underlying causes and impacts of fires in Southeast Asia Site 4 Musi Ba ID: 872885
Download Pdf The PPT/PDF document "Site 4 Musi Banyu Asin South Sumatra Pro..." is the property of its rightful owner. Permission is granted to download and print the materials on this web site for personal, non-commercial use only, and to display it on your personal computer provided you do not modify the materials and that you retain all copyright notices contained in the materials. By downloading content from our website, you accept the terms of this agreement.


1 Site 4. Musi Banyu Asin, South Sumatra P
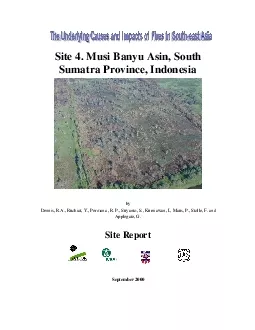
Site 4. Musi Banyu Asin, South Sumatra Province, Indonesia Dennis, R.A., Ruchiat, Y., Permana , R. P., Suyanto, S., Kurniawan, I., Maus, P., Stolle, F. and Applegate, G. Site Report September 2000 The underlying causes and impacts of fires in South-east Asia. Site 4. Musi Banyu Asin, South Sumatra Province, Indonesia by Rona Dennis1, Yayat Ruchiat2, Rizki Pandu Permana2, S. Suyanto2, Iwan Kurniawan2, Paul Maus Fred Stolle2, and Grahame Applegate1 1 Map design: Rizki Pandu Permana and Danan Prasetyo Hadi Copy editing: Erik Meijaard Corresponding author and contact address: Grahame Applegate Center for International Forest Research (CIFOR) PO Box 6596 JKPWB 10065 Jakarta Indonesia Cover photo: Digital air photo of transmigration area in the MUBA site with new burn scars and scattered trees. Photo by: Paul Maus, August 1999 1 Center for International Forestry Research (CIFOR) 2 International Centre for Research in Agroforestry (ICRAF) 3 United States Forest Service (USFS) iTable of ContentsTable of Contents Page No. ABBREVIATIONS AND TERMS................................................................................................................................................................................................................................................................................................................................1. ................................................................................................ 2. SITE DESCRIPTION................................................................................................................................ 3.
2 .......................................
................................................................................................ 3.1 CONOMIC STUDY M................................................................ 3.2 EMOTE SENSING AND GIS................................................................ wide methodology................................................................................................ TM image level................................................................................................................................ fire digital aerial image collection................................................................ Derivation of fire hot spots................................................................................................ Integration of social science and remote sensing................................................................ 4. RESULTS AND DISCUSSION................................................................ 4.1 ................................................................................................ Landscape level................................................................................................................................ Burn scars................................................................................................................................ TM image level................................................................................................................................18 ................................................................................................ 4.2 AND CSE C................................................................ Qualitative landscape level changes..............
3 ........................................
.................................................. Quantitative landscape level changes................................................................ TM image level................................................................................................................................29 5. NG CAUSES................................................................................................................................ 6. POLICY IMPLICATIONS................................................................ 7. ................................................................................................ APPENDIX I: SOURCES FOR HOT-SPOT DATA................................................................ APPENDIX II: LAND COVER CHANGE MATRICES................................................................ ii FIGURE 2 OCATION OF STUDY SITE................................................................ IGURE 2 AP OF THE STUDY AREA, SHOWING LOCATIONS MENTIONED IN THE TEXT AND MAIN RIVERS. IGURE 3 KETCH MAP OF THE MUBA SITE................................................................ IGURE 3 ATELLITE IMAGERY SELECTED FOR THE MUBA SITE................................ IGURE 3 ANDSAT TM SATELLITE IMAGERY FROM JANUARY 1998 OVERLAID WITH FLIGHT PATH OF THE HELICOPTER. THE BLUE SQUARES REPRESENT A SAMPLE OF THE DIGITAL CAMERA IMAGES IGURE 3 MUBA SITE () FROM JANUARY 1998 LANDSAT TM SHOWING LOCATION OF HELICOPTER FLIGHT PATH AND DIGITAL CAMERA IMAGES. ORANGE TRIANGLES REPRESENT “T SPOTS” DISCUSSED IN SECTION ................................................................................................ IGURE 3 VERVIEW OF THE MUBA STUDY SITE, THE LOCATION
4 OF WETLANDSAND TRANSMIGRATION AREAS
OF WETLANDSAND TRANSMIGRATION AREAS, OVERLAID WITH 1997 HOT................................................................ IGURE 3 HE MUBA STUDY SITE AND 1997 HOT................................ IGURE 4 URN SCAR LOCATIONS 1997................................................................ IGURE 4 AND COVER AND BURN SCARS FROM THE 1998 POSTFIRE SATELLITE IMAGE. BURN SCARS ARE HIGHLIGHTED IN VARIOUS COLORS DEPICTING THE LAND COVER TYPE THAT EXISTED IN 1992. IGURE 4 AND COVER CLASSIFICATIONS 1986................................ IGURE 4 HANGES IN NATURAL FOREST FOR THE TMWIDE STUDY AREA BETWEEN 1986 AND 1998. YELLOW AREAS ARE NATURAL FOREST THAT REMAINED IN 1998 AFTER THE FIRES. LIGHT AND DARK GREEN SHOW WHERE NATURAL FOREST OCCURRED IN 1992 AND 1986 RESPECTIVELY IGURE 4 RAPHICAL PORTRAYAL OF LAND COVER CHANGES OCCURRING IN THE TMWIDE STUDY AREA SURROUNDING THE MUBA SITE BETWEEN 1986 AND 1998................................. TABLES: TABLE 3 EMOTE SENSING IMAGERY ANALYSED FOR THE MUBA SITE………………………………………. 7 TABLE 32 LAND COVER CATEGORIES THAT WERE MAPPED FOR EACH OF THE THREE DATES OF SATELLITE IMAGERY…………………………………………………………………………………………… 10 TABLE 4 1992 LAND COVER COMPOSITION OF THE 1997 BURN SCARS…………………………………………. 18 TABLE 4ARY OF 1986 AND 1992 LAND COVER WITHIN THE 199798 BURN S………………….. 1
5 9 TABLE 43 FIRE DENSITIES IN SEVERAL ARE
9 TABLE 43 FIRE DENSITIES IN SEVERAL AREAS IN S………………………………………………….. 21 TABLE 44 HOTSPOT DENSITIES FROM JICA DATA…………………………………………………………… 21 TABLE 45 1997 HOTSPOT DATA IN THE MUBA SITE IN RELATION TO THE 1998 LAND COVER………………… 22 TABLE 46 CUMULATIVE LAND COVER CHANGE ESTIMATES 1986…………………………………….. 26 TABLE 47 CUMULATIVE LAND COVER CHANGE ESTIMATES 1992………………………………………. 29 TABLE 48 LAND COVER CHANGES OCCURRING IN THE TM IMAGEWIDE AREA SURROUNDING THE MUBA SITE BETWEEN 1986……………………………………………………………………………… 31 iiiABBREVIATIONS AND TERMS Adat rights Customary ownership or use rights recognized by customary law ATSR Along Track Scanning Radiometer AVHRR Advanced Very High Resolution Radiometer CNRM Center National Recherches Meteorologiques DMSP Defense Meteorological Satellite Program ESRIN European Space Agency’s Space Research Institute EU European Union EU the Joint Research Centre of the European Union GIS Geographic Information system ha Hectare km Kilometer JICA/PKA Japan International Cooperation Agency/Department of Nature Conservation, Ministry of Forestry of Indonesia Landsat MSS Landsat Multispectural Scanner. An imaging system found on th
6 e first five Landsat satellites. The sys
e first five Landsat satellites. The system collects multispectral data in four non-thermal radiation ands with a spatial resolution of 79 x 79 m. Landsat TM Landsat Thematic Mapper. A multispectral scanner imaging system on board the Landsat 4, 5 and 7 satellites. The imaging system collects multispectral data in seven bands. The six non-thermal bands have a spatial resolution of 30x30 m, whereas the thermal band has a spatial resolution of 120 x 120 m. The temporal resolution is 16 days. m Meters MUBA Musi Banyu Asin NOAA National Oceanic and Atmospheric Administration, USA RTRWP Provincial land use planning Stakeholders People or groups of people interested or responsible for forest management. Includes landowners, community, industry and government organisations Spot XS Système Probatoire pour l'Observation de la Terre. A French commericial satellite program designed to collect high resolution imagery (resolution of 20 x 20 m) iv This research is supported by the United States Forest Service, CIFOR and ICRAF. We are grateful to our respondents in the study site for their cooperation and patience during our interviews. In addition, we would like to thank the Tropical Rain Forest Information Center, Basic Science and Remote Sensing Initiative, Michigan State University for providing some of the imagery used in this study. The JICA/PKA Forest Fire Prevention and Management Project in Bogor kindly provided hot-spot data and we would like to thank them for providing this valuable dataset. Finally, we would like to thank members of the EU Forest Fire Prevention and Control Project in South Sumatra, in particular Rod Bowen and Ivan Anderson, for their generous help with field
7 logistics, site selection and provision
logistics, site selection and provision of hot-spot data. v Within the framework of the CIFOR/ICRAF/USFS project on underlying causes and impacts of fires in South-east Asia, 8 sites were studied in detail by linking spatial data with socio-economic information, to provide a solid basis for a scientific study of the causes and impacts of vegetation fires. This report provides the results of an analysis of the causes and impacts of vegetation fires in the Musi Banyu Asin (MUBA) coastal swamp area in South Sumatra Province, Sumatra, Indonesia. The 250,000 ha study area can be generally classified as coastal swamps with a fringe of mangroves and nipah (Nypa fruticans) palm situated along the tidal rivers and seacoast. Inland from the coast, most of the swamp forests have disappeared due to logging (both legal and illegal), fires and transmigration development. In 1997, large-scale fires burned up to 45 % of the land area of the site, destroying most of the remaining, albeit degraded, swamp forest. The largest, single, contiguous burnt area was almost 32,000 ha in size producing much smoke in the process. The results of the socio-economic research indicate that the majority of large fires in 1997 were started as small, deliberate fires which rapidly got out of control. The large-scale fires in the degraded swamp forest were identified as being caused by the activities of illegal loggers and fishermen. Drainage of these swamps since the early 1980s for transmigration has caused a general drying out of the swamps, thus making them vulnerable to fire. The influx of transmigrants and the improved access to the area since the early 1980s has created a high fire risk as activities such
8 as illegal logging, fishing and swamp r
as illegal logging, fishing and swamp rice cultivation have increased. 1 1. INTRODUCTION Largescale fires and associated smoke are an increasing problem in Indonesia and surrounding countries. For instance, major fires occurring in the El Niño years 1982/1983, 1987, 1991, 1994, and 1997/1998 (Dennis, 1999) devastated large areas of forest and caused significant economic losses, both in Indonesia where most fires occurred and in neighboring countries. The economic costs of the 1997/98 fires in Indonesia have been estimated to exceed 9 billion US$ with carbon emissions high enough to elevate Indonesia to one of the largest polluters in the world (Asian Development Bank (ADB), 1999; Barber and Schweithelm, 2000). The major causes of these fires are, however, still largely unclear. Some have blamed small-scale farmers, others large-scale estates for causing fires, suggesting that these actors deliberately set fires to forest to open up land for plantations or agriculture. In 1994, the Indonesian government blamed slashburn activity by smallholders as the major cause of fire, and they estimated that these people were responsible for more than 85 % of the 5,000,000 ha burned (Jakarta Post, 7 October 1994). Environmental NGOs, however, blamed activities by forest concessionaires and plantation owners as the major cause of fires (Jakarta Post, 3 October 1994). In contrast, taking advantage of data obtained from fire hot-spot information and satellite imagery, all institutions including government agencies believe that large-scale land clearing for plantations of fast growing trees for pulpwood and oil palm were the major causes of fire in 1997 and 1998. Yet, fires occurred at m
9 ultiple scales and for many reasons, and
ultiple scales and for many reasons, and impacts on local communities and forest had a variety of complex causes. In this report, the Center for International Forestry Research (CIFOR), the International Centre for Research in Agroforestry (ICRAF), and the United States Forest Service (USFS) provide a study of the underlying causes and impacts of vegetation fires in Indonesia. The aim is to answer questions about the reasons (why), nature (what), perpetrators (who), and locations (where) that were associated with the fires. Several methods of information gathering were used, ranging from satellite-derived remote sensing imagery at the landscape level to in-depth field investigations at the village level. When used in combination, a more complete picture of fire can be developed. For example, satellite imagery information on the location, extent, and the type of land cover burned. However, only through extensive interviews with local people combined with on-ground participatory mapping, can an answer be found to whom was responsible for the fires and what were their underlying reasons. From the field investigations 2 and the use of a Geographic Information System (GIS), a more accurate estimate of what burned can be determined at the landscape level. This study will apply three levels of spatial analysis: islandwide, province, and site. At the sitespecific level, the study focuses on the relationship between fire and land cover/land use change. The province wide (Landsat TM-level) study will concentrate on general land cover change, burn scars and hot-spots, and compare these pattern with the site-level findings. Finally, hotspots for Sumatra as a whole will be compared to th
10 ose for the province and the site. The M
ose for the province and the site. The Musi Banyu Asin (MUBA) site was chosen for a number of reasons. The occurrence of hot spots in the area during 1997 fires was dense, when compared to other parts of Sumatra and Kalimantan. Of all the eight study areas, the swamp forest areas surrounding MUBA to the north and east appears to have burned the most extensively. This was confirmed in the provincelevel analysis using full Landsat TM images. Additionally, since much of the area that burned was formerly swamp forest, the peat soils and corresponding vegetation were likely responsible for much of the smoke that drifted across Indonesia and other portions of Southeast Asia. In addition, the EU Forest Fire Prevention and Control Project based in Palembang, South Sumatra, suggested that this was an important area of study that was outside their focus sites. As such our results would provide important input to this project and complement existing studies. 3 2. SITE DESCRIPTION The fourth site in the series of eight fire studies covering Sumatra and Kalimantan is Musi Banyu Asin (MUBA). The MUBA site is located in the eastern coastal lowlands of Sumatra in the Bayung Lincir and Sungsang sub-districts, Musi Banyu Asin District, South Sumatra Province (Figure 2-1 and 2-2). The dimensions of the site discussed here are 67 km (west to east) by 44 km (south to north) covering an area of 253,400 ha. This site is low-lying and flat with an elevation of less than 50 m above sea level. A geomorphological survey conducted by the Directorate General of Forest Protection and Nature Conservation (PHPA) and Asian Wetland Bureau (AWB), classified most of our site as tidal lowlands (Danielsen and V
11 erheugt, 1990). The Musi Banyu Asin estu. The Musi Banyu Asin estu")
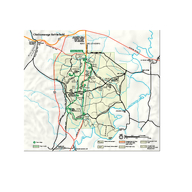
erheugt, 1990). The Musi Banyu Asin estuary system dominates the hydrology. Four main rivers are located in the study site: the Banyu Asin, Calik, Lalang, and Sembilang Rivers. Figure 2 Location of study site 4 This site is typical of the tidal lowlands, which cover approximately 20 % of the total area of Sumatra (Danielsen and Verheugt, 1990). The area is geologically young and mainly consists of young marine clays and river sediments. The natural forest, although much has now disappeared, is a fringe of mangroves backed by freshwater swamp forests. Due to its inaccessible location, there was little human activity in this site until the early 1980s, and the area was still largely covered by natural forest. However, Javanese and Buginese immigrants living in Sungsang are engaged in small-scale logging activities, fishing and farming in the area. Sungsang is a small town located on the border of the study site. It was established by Javanese settlers at the end of the seventeenth century, while the Buginese from Sulawesi arrived in Sungsang in 1964 (Danielsen and Verheugt, 1990). Figure 2 Map of the study area, showing locations mentioned in the text and main rivers. 5 The study site is located within the former forest concession areas of PT Sukses Sumatra Timber (PT SST) and PT Nindita Bagaskari (PT NB). These concessions were granted in the 1970s. The PT SST area is located in the north of the site, north of the Sembilang River. The company was initially given 237,000 ha of land, but later this was decreased to 179,000 ha (see Section 4.2.1) to make way for transmigration scheme development. In the south-western part of our site, PT NB logged around 52,000 ha bet
12 ween 1979 and 1999. The mangroves areas
ween 1979 and 1999. The mangroves areas are classified by the Department of Forestry as Protection Forest. Since the early 1980s, this site has become dominated by two transmigration settlements which were established between 1983 and 1993. Transmigration was devised by the Soeharto government as a means of relieving population pressure on Java, Madura and Bali, increasing food production and promoting regional development. Rural people from these islands were moved to transmigration settlements on the outer islands, such as Sumatra. South Sumatra has been one of the largest recipients of transmigrants, with 800,000 people by 1990 (Danielsen and Verheugt, 1990). The first transmigration settlement established in this site is called Karang Agung Hilir. It is located in the area situated north of the Musi Banyu Asin River, east of the Lalan River, south of the Sembilang River, and west of the tidal swamp forest near the Bungin River (see Figure 2-2). The second transmigration settlement is called Karang Agung Tengah. This settlement is divided into several smaller areas. The largest is located north of the Lalan River, the second is located south of the Lalan and Calik Rivers, while a third is located along the Lalan River. Along with the development of transmigration, the swamps have been altered dramatically by drainage systems, which were established primarily for draining the swamps for navigation and access to the transmigration settlements. 6 3. METHODOLOGY 3.1 SocioEconomic Study Methods The techniques used to study the socio-economic background of the area comprised sketch mapping at the landscape level and rural rapid appraisal. These activities were conducted betwe
13 en August and November 1999. A sketch ma
en August and November 1999. A sketch map (see Figure 3-1) was developed based on a 1998 Landsat TM image and a land use/development map of South Sumatra Province (scale 1:250,000) issued by the Transmigration Department. Subsequently, formal and informal community leaders, community members, logging companies and local government officers were interviewed, and several field visits for additional information were made. Information obtained through interviews included the history of the plantations and villages, the history of land clearing and planting, land clearing techniques, fire history, demography, land use, agricultural activities, and land tenure conflicts. The information provided through these interviews was added onto the existing base maps, and checked during the field visits. Figure 3 Sketch map of the MUBA site 7 3.2 Remote Sensing and GIS 3.2.1 Sitewide methodology Through the use of remote sensing and Geographic Information System (GIS), burn scar size and distribution were determined and the historic and current patterns of land cover and land use change were analyzed. Selection of satellite imagery for the MUBA site (see Table 3-1) was simplified by the fact that it fell completely within the boundary of one Landsat image scene. Table 3 Remote sensing imagery analysed for the MUBA site Sensor Scene (path/row) 26 June 1986 Landsat MSS 124/62 26 June 1992 Landsat TM 124/62 1 January 1998 Landsat TM 124/62 The imagery was generally cloud free and of good quality (see Figure 3-2). The Landsat MSS image for 1986 was almost cloud free and of good quality. The June 1992 Landsat TM image was completely cloud free and of excellent quality. The next image in t
14 he time sequence, Landsat TM January 199
he time sequence, Landsat TM January 1998, was also of good quality with some patchy haze. This image (post-1997) clearly showed burn scars from the previous year. An image for 31 May 1994 was also purchased, but the cloud cover was rather high over the MUBA site. The imagery for 1986 and 1992 was purchased from the Tropical Rain Forest Information Centre at Michigan State University. In November 2000, the project received imagery for the 2001 fire research. The new imagery for the MUBA site, 1978 and 2000, extended the time series backwards and forward. These images were not classified for this current study but they were used for reference. Once the imagery was selected for classification, it was geo-referenced using 1:50,000 topographic base maps. The 1998 Landsat TM was used as the base for geo-referencing and the remaining images were co-registered to it. The map projection used was UTM Zone 48S with the Padang datum. Prior to classification, all images were spectrally enhanced and various band combinations were assessed. For Landsat MSS a 4,3,1-band combination was preferred and for Landsat TM, bands 4,5,7 were preferred as it highlighted vegetation as well as recent burn scars. 8 Figure 32 Satellite imagery selected for the MUBA site Remote sensing provides a valuable source for quantitative measurement and monitoring of burned areas (Antikidis et al., 1999; EUFREG (European Union Fire Response Group), 1998; Hoffmann et al., 1999; Liew et al., 1998; Pereira et al., 1997; Siegert and Hoffmann, 1998; Trigg and Flasse, 2000). Recent burns have a high composition of charred material and a spectral reflectance that is very distinct from vegetation. Over time, the spectral
15 reflectance of the burn scar changes, a
reflectance of the burn scar changes, as pioneer and eventually secondary vegetation grows back. Interpretation of satellite imagery, with a good knowledge of field conditions, allows burn scar maps to be created. Unless collateral information on the exact date of burning is known it is not possible to date burn scars precisely from satellite imagery alone. The next stage in the process was classification of the imagery into land cover classes. On-screen digitizing was the selected digitizing method. The 1986 image was the first to be classified and the result was then used as a template for identifying the changes in the 1992 and 1998 images. 9 3.2.2 TM image level Information about land cover surrounding the MUBA landscape area was derived from Landsat Thematic Mapper (TM). An area of 170 km by 170 km covering approximately 2.9 million ha was mapped into six land cover categories using automated computer classification techniques (Table 3-2). The advantage of analysing imagery this way is that large areas of land can be assessed rapidly. The disadvantage is that little ground verification is possible in a short time frame, except within the more detailed MUBA landscape area, and less accuracy can be expected. In order to be consistent between dates of imagery and across such a large area, land cover categories are broad. Land cover and burn scars were mapped from three dates of satellite images: 1986, 1992, and 1998. These were the same images discussed in the detailed landscape level analysis (Section 3.2.1). Unsupervised classifications (Lillesand and Kiefer, 1994) were completed for each imagery date. In this process, six of the seven image bands were used to classi
16 fy each of the three TM images. The ther
fy each of the three TM images. The thermal infrared band from Landsat TM was not used due to data integrity problems. Using unsupervised classification methods, sixty spectral classes were derived from each image and, based upon analyst interpretation, each was assigned to one of the six classes in Table 3-2. Maps were manually edited in areas of smoke, haze, cloud, and cloud shadows to more accurately reflect land cover. Additionally, checks were made between the three dates of maps so that unreasonable errors could not occur. For example, areas mapped as natural forest on the 1998 image were cross-referenced with the 1992 and 1986 maps to ensure they were also classed as natural forest. This was an important step, since vegetation re-growth occurs rapidly and plantations and other forests can be confused with natural forest after a short time. Once the land cover maps were finalized, overlay analysis techniques using a GIS were applied to determine 1) land cover changes between 1986, 1992 and 1998; and 2) relationships these changes had to the burn scars in 1998. These maps provide insight into the progression of changes and provide a spatial overview of where circumstances similar to the MUBA site may be occurring. For example, where are other areas mapped as burn scar in 1998 and mapped as natural forest in 1992? Using multiple dates of imagery, these areas are distinguishable from those areas that burn frequently such as rice fields or grasslands. 10 Table 32 Land cover categories that were mapped for each of the three dates of satellite imagery Cover Category Description 1. Cloud/shadow Clouds and cloud shadows removed from all images 2. Water Lakes, reservoirs, w
17 ide river bodies 3. Agriculture/bare/ot
ide river bodies 3. Agriculture/bare/other Crops, bare ground, grassy areas, villages 4. Other forest Partially logged areas, regrowth, plantations, agroforestry 5. Natural forest Forests not burned, harvested, or visibly disturbed by humans 6. Burn scars Burned areas evident from satellite imagery 3.2.3 Postfire digital aerial image collection In August 1999, an aerial reconnaissance flight over the MUBA study site was completed to observe how areas had changed as a result of the 1997 fires. Over two hundred digital camera images were collected at regular intervals from approximately 300 meters above ground level. The helicopter flight, based out of Palembang, flew south and north covering the MUBA site and surrounding areas that burned extensively in 1997–1998. Figure 3-3 shows the flight of the helicopter path as charted by the on-board global positioning system (GPS). The backdrop for the helicopter positions is the January 18, 1998 Landsat TM satellite image. The GPS provides a new location for the aircraft every second and stores a digital file that can be converted to a GIS file and plotted over the satellite imagery or other map in a GIS. Digital camera images were collected simultaneously with the GPS unit onboard the helicopter. Approximately 200 digital camera images are stored on a small removable card located on the camera. Each image has a time stamp associated with it that is stored to the nearest minute. Prior to the helicopter flight the camera was synchronized with the GPS unit so both recorded the same time. Following the flight, the digital camera images were downloaded to a laptop computer and linked with the GPS file in a GIS.
18 11 Figure 33 Landsat TM satelli
11 Figure 33 Landsat TM satellite imagery from January 1998 overlaid with flight path of the helicopter. The blue squares represent a sample of the digital camera images. Each image is manually matched with the corresponding GPS location. The “hotlinking” routine in ArcView was used to create the link between the GPS and the digital camera images. This process resulted in a GIS file of the helicopter flight path linked to the digital camera images. Once created, the flight path can be displayed and digital camera images previewed by clicking on a location along the flight path. This is a simple way of indexing the digital camera images without actually referencing them to a map. These images are not meant to be a base for mapping but rather a source of reference information for interpretation of the satellite imagery. Figure 3-4 shows the post-fire 1998 Landsat TM satellite image of the MUBA site and four digital camera images located along the helicopter flight. The digital camera image labeled “A” is coastal mangrove forest not visually affected by the fires. This area shows up as a reddish/purple color on the Landsat TM image. The black and light blue areas on the satellite image are burn scars. Digital camera images “B” and “C” were taken in areas that burned and show water and low-growing, shrub- vegetation following the fires. The digital camera image labeled “D” shows remnants of burnt trees with a grass-like under story. The Landsat TM Palembang Airport 12 image from 1992 shows this area as natural forest. These digital camera images were used to assist in the interpretation of the satellite imagery and al
19 so provide an historic record of the phy
so provide an historic record of the physical effects of the fires. Figure 34 MUBA site (center) from January 1998 Landsat TM showing location of helicopter flight path and digital camera images. Orange triangles represent “hot spots” discussed in section 4.1.2. Derivation of fire hot spots Hotspots data from NOAA-AVHRR imagery were available from various sources and covered 13 periods between 1992 to 1999 (for more detail refer to Appendix II). The study area for hot-spot detection in this site is shown in Figures 3-5 and 3-6. Hot-spot data from the MUBA site cannot be directly compared to the whole of South Sumatra Province, as, unlike the whole of the Province, the MUBA site is mostly located in a swamp area with many transmigration areas established in and near the study site. Hot-spot density and distribution in the Palembang site was therefore not only be compared to the hot-spots data from South Sumatra but also to a similar swamp area, the Menggala swamp study site (see Suyanto et al., 2000), and to other wetlands and transmigration areas in Sumatra. C B D 13 Figure 35 Overview of the MUBA study site, the location of wetlands, and transmigration areas, overlaid with 1997 hot- Figure 36 The MUBA study site and 1997 hot- 14 3.2.5 Integration of social science and remote sensing/GIS In order to improve the analysis of underlying causes of fire, a methodology was developed that integrates some of the results of the socio-economic research with the results of the remote sensingbased change analysis. A GIS was used for this integration. Not all outputs from the socioeconomic research are compatible with a GIS and from site to site, the types of ou
20 tputs vary slightly. For the MUBA site,
tputs vary slightly. For the MUBA site, the focus was on integrating local people’s narratives and sketch maps with land cover change maps and burn scar maps. Using the functionality of the GIS, it was possible to calculate the types and size of land cover changes. In addition, local people’s narrative could be added to the land cover change results to provide an insight into how and why these changes occurred. For the 1997 fires, sketch maps were overlaid with the burn scar maps and compared to provide both a quantitative and qualitative assessment of the fires. Digital air photos were also used to enhance the interpretation of satellite imagery. 15 4. RESULTS AND DISCUSSION 4.1 Fires 4.1.1 Landscape level The largest burnt area in 1997, identified during the fieldwork, is located north of the Karang Agung Hilir transmigration settlement (see Figures 3-1 and 4-1). Analysis of satellite imagery, dated 1 January 1998, shows that the size of the area burned is approximately 25,359 ha. This area contained degraded swamp forest designated as State land reserved for transmigration settlement. Drainage and logging of this area made it very vulnerable to fire. Drainage systems in the swampy transmigration areas were built for irrigated rice cultivation, for transportation, and to avoid flooding in the settlements. Furthermore, logging companies also dig canals to transport logs. The use of a drainage system allows water level management, so that rice planting is possible every year. There are, however, also negative environmental impacts of these drainage systems. The continued lowering of the water table leads to desiccation of the swamp soils and vegetation, which incre
21 ases the fire risk in dry seasons. The
ases the fire risk in dry seasons. The results of fieldwork indicate that carelessness of fishing people and illegal loggers was a major cause of fire in this area. In the dry season, fishing significantly contributes to the livelihood of people in this site. Rivers and pools surrounding the rivers are the main places for fishing activities. During the rainy season, river water floods the swamps, including the pools, and carries with it the river fishes. Then when during the dry season the water recedes, fish accumulate in the swamp pools, making them easy to harvest. Usually, fisherman burn vegetation (shrubs) to improve their access to the pools, while other activities such as cooking and smoking, also contribute to the fire hazard. There is a considerable amount of money involved in these fishing activities. To harvest fish a lease contract is required from the local Government for the use of swamp pools. According to the Fisheries Services (Sriwijaya Post, 28 June 1989, in Danielsen and Verheugt, 1990) average lease prices in South Sumatra were 10 million Rupiah per area per year (US $ 5,650). In 2000, the lease price in the area left of the Bungin River was 25 million Rupiah per year (US $3,350). 16 Similar to fisherfolk, the activities of loggers such as cooking and smoking are also potential fire hazards. Along with the operation of forest concessions and the availability of transmigration labor, illegal logging activity has increased. After the big fire in 1997, however, illegal logging activities decreased, because fire destroyed most of trees in this swamp area. North and south of the Karang Agung Tengah transmigration settlement, burning was less common (see Fi
22 gure 2-2 and 3-1). The burnt area in the. The burnt area in the")
gure 2-2 and 3-1). The burnt area in the northern part is on State land, which is classified as APL (Areal Pengunaan Lain or Other Land Use) under the forest land use classification (Tata Guna Hutan Kesepakatan or TGHK). The area burned in the southeast is located within a former timber concession. In 1994 and 1997, transmigrants of Karang Agung Tengah cultivated the areas for growing rice. Since this area is swamp, they could only cultivate during droughts. This system is similar to the sonor system, a traditional rice cultivation technique practiced by indigenous Sumatran people living in the region’s swamps (see Suyanto, et al., 2000; Suyanto and Ruchiat, 2000). The yield of rice production varies between the transmigration villages. Villages that are located near rivers and swamp areas have lower rice yields. This is because of the significant influence of uncontrolled fluctuations in the watertable, and because higher levels of pest species attacking crops. These include rodents living inside the scrub and bushes of secondary forest. Because of this, farmers tend to burn the swamp forest that is located outside their village, away from rivers and swamp forest, for planting rice. Moreover, villages that are located near uncultivated swamps tend to enlarge their village areas by burning into the swamp forest. For example in 1997, around 1,950 ha were cleared by using fire for enlargement of the Karya Mukti, Galih Sari, Agung Jaya, Jaya Agung, and Suka Makmur villages. 4.1.2 Burn scars Post1997 burn scars were mapped from Landsat TM imagery dated 1 January 1998. Through ground checking of the imagery, it was found that recent (within a few months of the date of the image
23 ry) burn scars showed a distinctive spec burn scars showed a distinctive spec")
ry) burn scars showed a distinctive spectral reflectance. In some cases older burn scars could be identified from satellite imagery but in general, the older the burn, the more likely it is that vegetation will have grown up. Field experience gained through this project has shown that the distinctive spectral reflectance of burn scars is due to a combination of charred woody vegetation and a young vigorous growth of pioneer species such as grasses. 17 Spatial analysis of the imagery identified large burn scars resulting from the 1997 fires, see Figure 4-1. The total number of individual burn scars identified on this imagery is 56 covering a total area of 101,789 ha, and equating to 40 % of the study area. The mean burn scar size is 1,817 ha, the largest being 31,730 ha and the smallest being 4.6 ha. Figure 4 Burn scar locations 1997 Of all the 8 sites studied so far in this Project, the burn scars found in this site are the largest, for example the largest single burn scar found in the Menggala site (Site 2) was 1,562 ha compared to 31,730 ha for this site (see Suyanto, et al., 2000). Further analysis shows that 87 % of the total burnt area is accounted for by only six of the burn scars with the following sizes: 31,730 ha, 25,359 ha, 13,770 ha, 9,451 ha, 4,927 ha, and 3,014 ha. The 50 remaining burn scars are relatively small. The 1992 pre-burn composition of the areas affected by fire in 1997 is shown in Table 4-1, below. Although there is a 5½ year gap between the images in the time series, fieldwork carried out in 2000 confirms that there was little change during this period. Assessment of the Landsat TM imagery dated 31 May 1992, which was not interpreted due to hig
24 h cloud cover, confirms that in mid-1994
h cloud cover, confirms that in mid-1994 there was little change from the June 1992 image. 18 Table 4 1992 land cover composition of the 1997 burn scars 1997 Burn Scar/Land Cover Class in 1992 Size of area (ha) Burn scars 8,826 Dry swamp scrub 62 High density estuarine forest 43 Low density estuarine forest 2,191 High density swamp forest 2,224 Low density swamp forest 60,249 Mangrove 320 Riverine forest 843 Scrubland/grassland 22,289 Swamp scrubland 1,630 Agriculture 3,088 Total 101,765 The largest land cover class affected by the fires in 1997, based on the 1992 land cover classification, is low-density swamp forest (see Table 4-1). Sixty % of the burnt areas in 1997 were previously low-density swamp forest. The largest burnt area identified during the 2000 fieldwork, north of Karung Agung Hilir transmigration site, was still forested in early 1997. Most of the other massive burn scars, such as in the western part of the study area were also lowdensity swamp forest prior to the 1997 fires. It is reasonable to assume that the smoke contribution from such fires was large. The remaining areas of burn scar consisted in 1992 for 9 % of burn scars, 2 % low density estuarine forest, 2 % high density swamp forest, and 22 % scrubland and grassland. Much of the area classified as burn scars in both 1992 and 1997 would have become grassland in the intervening period, a cover type prone to burning. Next to the low-density swamp forest, scrubland/grassland has been most severely affected accounting for 22 % of the 1997 burn scars. Again, this type is prone to burning during dry periods. 4.1.3 TM image level Burn scars surrounding the MUBA landscape site were mapped as p
25 art of the land cover mapping process di
art of the land cover mapping process discussed in Section 3.2.2. The burn scars, along with the earlier land cover maps derived from satellite imagery, provide information about where the fires burned, what burned, and also provide a birds-eye view of burn patterns in the area surrounding the MUBA site. The analysis for this portion of the report was completed by summarizing land cover from 19 the 1992 and 1986 images within the extent of the burn scars mapped in the 1998 image. This process provides insight into what actually burned in the 1997 fires. Since imagery spanning the period between 1992 and 1998 was not analyzed, we assume that the land cover category mapped in 1992 was what existed prior to the fires in 1997-1998. Although this may not always be the case, the discussion on the hot spot analysis in Section 4.1.4 supports the conclusion that few fires burned between these years. Visual analysis of the cloudy 1994 Landsat TM image also supports this theory. Table 4-2 shows the result of the burn scar summary analysis with land cover from 1992 and 1986. The columns display the number of hectares and percentage of land cover classes from the 1992 and 1985 maps within the 1997 burn scars. Figure 4-2 illustrates the summary analysis by color-shading the 1998 burn scars based upon the 1992 land cover. Table 42 summary of 1986 and 1992 land cover within the 1997-98 burn scars Land Cover 1986 hectares 1986 percent cover 1992 hectares 1992 percent cover Water 2,247 1% 5,789 2% Ag./bare/other 9,658 4% 27,195 11% Other forest 66,272 28% 69,277 29% Natural forest 159,894 67% 122,105 51% Burn scar 0 0% 13,704 6% Totals 238,972 100% 238,972 100% Within the TM-wid
26 e study area shown in Figure 4-2, approx
e study area shown in Figure 4-2, approximately 8 % of the area, or 238,000 ha, was mapped as burn scar in the 1998 image. This does not mean that 8 % of the area burned in 1997-98, but rather it is a snap shot of the burn scars at the time the image was taken. As is evident in Figure 4-2, most burn scars are large and contiguous and occur where “other forest” or “natural forest” existed in 1992 (red and purple). From the summary analysis in Table 4-2, approximately 51 % of the area mapped as burn scar in 1998 was still natural forest in 1992. When combined with the “other forest” category, approximately 80 % of the burn scars were mapped as some type of forest in 1992. Thus, roughly 20 % of the area was either agriculture, previously burned, or land cover other than forest. In 1986, natural forest made up approximately 67 % of the total burn scar area. By reviewing patterns revealed from the different coloration of burn scars, one can see areas appearing similar to the MUBA site. Large areas of forest burned to the west and again directly 20 south of Palembang. These areas were mostly forested in 1986 and 1992 showing that fires, at least within the TM study area, were mostly in previously forested areas. Most other fires in the image are small and scattered and burned in what was mostly “other forest”, agriculture, or burn scar in 1992. Figure 42 Land cover and burn scars from the 1998 post-fire satellite image. Burn scars are highlighted in various colors depicting the land cover type that existed in 1992. Hotspots The total number of hot-spots between 1992–1999 was 343, with an overall hot-spot density of 15.18 pe
27 r 100 km2. From the 343 hot-spots that w
r 100 km2. From the 343 hot-spots that were detected in the study area between 1992 and 1999, almost all were detected in 1997. This result indicates that 1997 was an exceptional fire year and that the area does not burn in “normal” years. From the total number of hot-spots in 1997, 45 % were located in the transmigration sites, and 35 % in the PT NB logging concession. The burn scar maps discussed in section 4.1.2 confirm this result. Table 4-3 shows the fire densities in different years and in different areas including the Menggala site (Suyanto, et al., 2000). Cloud/shado Water Ag./bare/othe Other forest Natural forest Burn - Ag. Burn - Other forest Burn - Natural forest Nort Muba Palembang 21 Table 43 Fire densities in several areas in Sumatra Density total study site Density swamp site Menggala Density Sumatra Density South Sumatra Density swamp Density transmigration 1992 0.09 0.36 0.33 0.21 1.31 0.78 1993 0.00 0.73 0.18 0.38 0.45 0.52 1996 0.00 3.64 2.17 2.97 4.59 4.53 1997 14.96 18.57 3.68 8.35 11.46 8.27 1998 0.00 0.00 2.04 0.32 7.72 2.93 1999 0.13 0.55 2.01 3.32 5.75 3.81 Average 2.53 3.98 1.74 2.59 5.21 3. The locations of burn scars in 1992 and 1997 show very little correlation with the hot-spots data used (data from EU-Palembang station) for these years. However, other hot-spot data from the Japanese International Cooperation Agency (JICA) indicate a higher correlation with burn scars location. Unfortunately, these data are only available for 1997 and 1998 (see Table 4- The JICA data in Table 4-4 show an overall higher number of hot-spots throughout Sumatra than the EU data. The data show a good correlation between 1997 ho
28 t-spots and burn scars from the land cov
t-spots and burn scars from the land cover interpretation (77 % of the hot-spots are within burn scars). Table 44 Hot-spot densities from JICA data Density study site Density South Sumatra Density Sumatra 1997 138.91 38.8 10.81 1998 0.39 1.92 4.26 Average 20.36 7.54 In January 1998, both the high number and density of hot-spots identifies large areas as burned. To understand the burn scars seen on the 1998 imagery, the 1992 land cover data were used (see Table 4-5). In 1992, burn scars were still low-density swamp forest (60 %), scrub and grassland (20 %), and burn scars (9 %). The fires between 1992 and 1997 thus seem to have mainly destroyed low-density, degraded, logged-over swamp forest. The burning of scrub and grasslands is probably more common than the burn scars indicate, as these areas are known to burn easily. However, the sites recover quickly in terms of vegetation cover. The quick 22 recovery is indicated by comparing the 1997 hot-spot data and the 1998 land cover interpretation. There are 314 hot-spots detected in 1997 in areas that are classified as scrub and grasslands in 1998. Apparently, the burn scars cannot be detected anymore in this vegetation type after 3-4 months. Table 45 1997 hot-spot data in the MUBA site in relation to the 1998 land cover Land cover 1998 Area in km2 Number of hot- Density per 100 km2 burn scars 1,018 2,425 238 Cloud 12 10 81 high density estuarine forest 68 10 15 low density estuarine forest 113 13 11 low density swamp forest 8 6 74 mangrove forest 60 65 108 riverine vegetation 4 7 189 scrub and grassland 386 314 81 Shadow 8 2 25 mixed agriculture/settlement 509 207 41 Water 280 36 13 wetland cultivation 67
29 43 64 Total 2,533 3 124 (= mean density
43 64 Total 2,533 3 124 (= mean density) In 1997, mangrove vegetation shows high hot-spot density. Since the land cover interpretation is from a later date than the hot-spot data, this means that the hot-spot detection was false or that the dense vegetation in these areas makes it impossible to detect (small) burn scars. A high number of hot-spots were detected in grasslands and mixed agriculture/settlement. The large numbers of fires in the mixed agriculture/settlement are all on the edge between burn scars and the mixed agriculture area. Since the geo-position of the hot-spot data is not very accurate (errors of 2 km are possible) these hot-spots are probably misplaced and are likely to be in the burn scar areas. 23 4.2 Land Cover/Use Changes 4.2.1 Qualitative landscape level changes During the period 1979 to 1997, the PT SST logging company operated in the northern part of the study site. Following the termination of the concession in 1997, the Ministry of Forestry and Estate Crops assigned some of this area to the State logging company PT Inhutani V. According to the Provincial Spatial Planning Map (RTRWP) of South Sumatra Province, the area of the ex-concession holder PT SST is classified as Production Forest (91,500 ha) and agricultural land (87,500 ha). In the southwestern part of our site, PT NB obtained a 52,000 ha forest concession in 1979. This concession was terminated in 1999. It appears that there have been inconsistencies in the land allocation policy in this site since the transmigration areas were developed within the forest concession. Between 1982 and 1985, the Karang Agung Hilir transmigration settlement was first established within the former loggin
30 g concession area, and, between 1987 and
g concession area, and, between 1987 and 1993, Karang Agung Tengah followed. Therefore, in 1991, the Government (based on the Minister of Forestry Degree no. 578/Kpts-II/1991) reallocated 58,000 ha of land within the logging concession (including the transmigration settlements of Karang Agung Hilir and Karang Agung Tengah) to be reserved for transmigration. Thus, since 1991, PT SST saw its concession decrease to 179,000 ha. Only half of the former concession area was developed for transmigration, the rest remained as degraded forest which ultimately burned in 1997. The establishment of transmigration settlements in this site is a major cause of land cover change both directly and indirectly. Presently, the Karang Agung Hilir settlement consists of eight villages with around 4,300 households, while Karang Agung Tengah consists of 23 villages with around 9,100 households. Each transmigrant household received 2.25 ha of land, consisting of 0.25 ha for housing and home garden, 1 ha for producing subsistence food and income for the family, and 1 ha for obtaining an income beyond subsistence. Results from interview surveys indicate that illegal logging activities in the MUBA site increased in tandem with legal logging by the forest concession and with the establishment of transmigration settlements in 1983. According to Danielson and Verheugt (1990) South Sumatra ranked second as the province with the largest rate of illegal logging in Indonesia. Danielsen and Verheugt (1990) also estimated that as many spontaneous migrants come to a transmigration 24 area as official transmigrants. This trend was seen here with the in-migration of illegal loggers from neighboring districts (Ogan
31 Komering Ilir and Musi Rawas) to the MUB to the MUB")
Komering Ilir and Musi Rawas) to the MUBA area. According to the Head of the Provincial Forest Service of South Sumatra Province, the Ogan Komering Ilir and Musi Rawas Districts were involved in the largest, smallscale, illegal logging industry in this province up until 1984. By then, the forest area had been reduced so much that loggers were forced to migrate to other areas, including the present study site. From 1983 to 1986, there were approximately 25 large illegal logging groups in Karang Agung Hilir, most of whom owned sawmills. Until 1986, these illegal loggers sold the timber to PT SST and to a private timber trader from Palembang. In 1986, PT SST stopped buying timber from illegal loggers, which caused a reduction in illegal logging activities. During that period, the number of illegal logging groups decreased from 25 to 15. Along with the increasing demand for timber in the early 1990s, the activity of illegal logging increased again. During that time, the large illegal logging concerns increased to 70 illegal logging groups, most of which own sawmills. In 1995, the Government closed the illegal sawmills in the Musi Banyu Asin District, which included more than 50 % of the sawmills in the study site. Subsequently, when, in 1997, a large fire destroyed most of the trees in the Karang Agung Hilir swamp forests, the rest of the sawmills in this area closed down. Summarizing the above information, three main causes of land cover change in the study site, in chronological order, can be identified as; 1. The activities of legal logging concessions; 2. The development of transmigration settlements, both inside and outside those concessions; 3. Illegal logging activities thr
32 oughout the area; and 4. Fire.
oughout the area; and 4. Fire. 25 4.2.2 Quantitative landscape level changes Quantitative assessment of land cover change at the landscape level was carried out for three different dates: 26 June 1986, 26 June 1992 and 1 January 1998. The change analysis will be discussed for two time periods 1986–1992 and 1992–1998. Cloud and shadow did not present problems for interpretation as the image quality was good. The Landsat MSS proved more difficult to classify than the Landsat TM, due to the low spectral and spatial resolution. However this was expected. The results of the classifications can be seen in Figure 4-3 below. A number of different types of analyses were carried out on the land cover classifications. The analysis compared cumulative figures and percentages between years, thus giving a general picture of changes. This type of analysis gives an insight into the predominant land cover change processes. Change trajectory matrices were also calculated. These matrices are provided in Appendix II. Figure 43 Land cover classifications 1986 26 The first time period covered by the change analysis is 1986–1992. During this period there were considerable changes in the extent and quality of the natural forest. The total deforestation over this six-year period was 14 % , or 2.4 % per annum (see Table 4-6). The forest type most affected was high-density swamp forest, which was reduced by 82,741 ha, or 95 %. In tandem with the reduction in high-density swamp forest was a sharp increase in low-density swamp forest. Analysis of the change trajectory matrix Table in Appendix II, shows that 80 % of the high density swamp forest in 1986 had become low-density by
33 1992. This is a change expected with inc
1992. This is a change expected with increased logging intensity. A large percentage of the swamp forest in this site in 1986 was within area allocated to two logging concessions, as discussed in 4.2.1. Both these companies started their activities in the late 1970s and by 1986 the impact on the forest as seen from satellite imagery was still minimal, however by 1992, the forest canopy was more open as the companies had been logging for over 13 years. Table 46 Cumulative land cover change estimates 1986– 1986 1992 change Class name (ha) (%) (ha) (%) (ha) (%) Natural forest 127,588 50 109,380 43 - - High density swamp forest 86,723 34 3,982 2 - - Low density swamp forest 7 3 74,160 29 66,936 927 High density estuarine forest 11,412 5 7,847 3 - - Low density estuarine forest 14,191 6 16,025 6 1,834 13 Mangrove forest 8,038 3 7,366 3 - - Other vegetation 59,042 23 50,102 20 - - Riverine 5,049 2 4,2 2 - - Scrub and grassland 51,397 20 43,580 17 - - Swamp scrub 2,596 1 1,953 1 - - Dry swamp scrub 0 0 271 271 - Agriculture 8,505 3 46,239 18 37,735 444 Mixed agriculture (transmigration) 8,505 3 42,224 17 33,720 396 Wetland cultivation 0 0 4,015 2 4,015 - Other land cover 58,266 23 47,680 19 - - Burn scars 28,573 11 19,275 8 - - Settlement 1,699 1 412 - - Water 27,993 11 27,993 11 0 0 Cloud/shadow 0 0 0 0 0 - Total Area 253,401 100 253,401 100 27 Other forest types in the area include the nipah palm and mangrove forests along the estuary and tidal rivers. There has also been a reduction here with a 31 % loss of high-ty estuarine () forest. Again, much of this loss has been converted to lower density estuarine forest, 27 % of the high density estuarine
34 had become low-density forest by 1992,
had become low-density forest by 1992, see Appendix II. The largest change in this site between 1986 and 1992 is the expansion of the transmigration areas and this is shown clearly in the land cover change. From Table 4-6, it can be seen that there was a 443 % increase in agriculture (+ 37,735 ha), the class in which transmigration areas fall. However, the following results show that much of the area converted to transmigration sites was already scrub and grassland on the 1978 imagery and not forest. Note that 3–5 years are usually spent preparing a transmigration site before the transmigrants arrive. The first transmigration site, Karung Agung Hilir, was established between 1982 and 1985 (see Section 4.2.1). The 1986 land cover classification (see Figure 4-1) shows this very clearly as an area with some drainage canals, mixed agriculture and scrub/grassland where the site had been cleared. The area immediately to the north of the transmigration area was annexed from the PT SST concession. Earlier imagery from 22 June 1978, shows that much of this area was already scrub/grassland in 1978 with some areas of high- swamp forest in the area near the Lalan River. Between 1986 and 1992, only 7,348 ha of natural forest was converted for the transmigration schemes whereas 34,585 ha of scrub/grassland and burn scars became transmigration areas in the same period. It is likely that much of the scrub/grassland was cleared using fire to make way for the establishment of the transmigration site. How the forest areas were cleared is not evident from the 1986 imagery, although clear felling and fire could have been tools in that process. The second transmigration site, Karung Agung Tengah
35 , was established between 1987 and 1993
, was established between 1987 and 1993 (see Section 4.2.1). The classified image for 1986 (see Figure 4-3) shows this transmigration site, north and south of the Lalan river, as an area of burn scars with some drainage canals. The accuracy of the burn scars is not 100 %, but the spectral characteristics of the area are similar to burn scars seen on Landsat TM. The 1978 image shows that all of this area was scrub/grassland in 1978 and not swamp forest. As with the pattern seen for the earlier transmigration site, the Karung Agung Tengah site was probably drained and cleared with fire beginning in 1986/87. 28 Forest loss due to transmigration development is also seen on the Rimau (= tiger) Island south of the Calik river, in the southern part of the study area. By 1986, a network of drainage canals is evident on the satellite imagery, and the transmigration site is at a similar stage of establishment as Karang Agung Hilir. The western part of this transmigration site, was mainly scrub and grassland in 1978, however, the eastern part, which is approximately 8,000 ha, was still high-density swamp forest in 1978. The next period in the time sequence is 1992–1998. Without a doubt, the most striking change in this period is the almost complete loss of all swamp forest due to fires, which took place in 1997. During this 6-year period, there was an overall reduction in natural forest of 77.36 %, equivalent to a 12.8 % annual decrease (see Table 4-7). We know from fieldwork (see Section 4.1.1.), that much of this loss took place during the El Niño of 1997. From Table 4-7, it can be seen that 45 % of the land area of the site comprises burn scars, 26 % is within transmigration sc
36 hemes, 17 % is scrub and grassland and o
hemes, 17 % is scrub and grassland and only 11 % is natural forest such as nipah palm and mangrove. Analysis of the change matrix in Appendix II, shows that the pre-burn composition of the burns scars was 60 % low density swamp forest and 22 % scrub/grassland. Legal and illegal logging and burning were cited in Section 4.2.1 as the main driving factors of deforestation in this area. Unfortunately, it is difficult to draw conclusions on logging activities from the satellite imagery. It is virtually impossible to discriminate between legal and illegal logging activities from satellite imagery alone. The only concrete evidence for the impact of logging is seen between 1986 and 1992 during which time most of the high-density swamp forest became low density. Clear logging tracks and railway lines are seen in the forest areas, which were not evident in 1986. Between 1978 and 1986 there is a decline in the area of swamp forest but it is not known whether this was due to logging alone, or a combination of logging followed by development of transmigration schemes. There is a chance that logging activities and subsequent fires in the 1970s were responsible for creation of some of the scrub/grassland areas seen in 1986 in close proximity to the high-density swamp forests. 29 Table 47 Cumulative land cover change estimates 1992- TM image level In this section, discussions on land cover changes will be limited to deforestation and how it relates to fire. Since we are only looking at a period of twelve years, it is assumed that areas being deforested are being converted to a land cover other than natural forest. That is, natural forest cannot be removed and returned to natural forest w
37 ithin the twelve years between 1986 and
ithin the twelve years between 1986 and 1998. Figure 4-4 is a composite map showing the progression of deforestation derived from the three dates of satellite imagery discussed earlier: 1986, 1992, and 1998. Areas mapped as natural forest in 1998 are shown as yellow. Areas mapped as natural forest in 1992 are shown as light green and include the yellow. Finally, areas mapped as natural forest in 1986 are shown as dark green and include those areas shown as light green as well as yellow. 1992 1998 change Class name (ha) (%) (ha) (%) (ha) (%) Natural forest 109,380 43 24,760 10 - - High density swamp forest 3,982 2 0 0 - - Low density swamp forest 74,160 29 717 - - High density estuarine forest 7,847 3 6,755 3 - - Low density estuarine forest 16,025 6 11,331 4 - - Mangrove forest 7,366 3 5,956 2 - - Other vegetation 50,102 20 39,090 15 - - Riverine 4, 2 371 - - Scrub and grassland 43,580 17 38,718 15 - - Swamp scrub 1,953 1 0 0 - - Dry swamp scrub 271 0 0 - - Agriculture 46,239 18 57,623 23 11,384 24.62 Mixed agriculture (transmigration) 42, 17 50,942 20 8,717 20.65 Wetland cultivation 4,015 2 6,681 3 2,666 66.41 Other land cover 47,680 19 129,895 51 82,216 172.43 Burn scars 19,275 8 101,789 40 82,515 428.10 Settlement 412 113 - - Water 27,993 11 27.993 11 0 0.00 Cloud/shadow 0 0 2,033 1 2,033 - TOTAL AREA 253,401 100 253,401 100 - - 30 Figure 44 Changes in natural forest for the TM-wide study area between 1986 and 1998. Yellow areas are natural forest that remained in 1998 after the fires. Light and dark green show where natural forest occurred in 1992 and 1986 respectively. A quantification of land cover
38 changes is shown in Table 4-8. Natural
changes is shown in Table 4-8. Natural forest decreased from 25 % of the total image area in 1986 to just under 4 % in 1998. The midpoint date of satellite imagery shows that 19 % of the area was still natural forest in 1992. Thus, only 6 % of the area was converted from natural forest in the six years between 1986 and 1992. Using these figures, the average annual decrease in natural forest between 1986 and 1992 is approximately 1 %. The period between 1992 and 1998 saw a decrease of 15 % in natural forest, effectively tripling the rate of deforestation to almost three percent annually. Approximately 22 % (one fifth) of this change may be accounted for in the burn scars mapped from the 1998 image (see Section 4.1.3). N 0 30 km 60 km MUBA Natural forest - 1986 Natural forest - 1992 Natural forest - 1998 31 Since very few hot spots were visible in the years prior to 1997-98 (see section 4.1.4), much of the conversion of natural forest may have occurred as a result of activities other than fire. Figure 45 shows graphically the changes taking place in the study site. Note that as the occurrence of natural forest has decreased, the occurrence of other forest and agriculture has increased. Table 48 Land cover changes occurring in the TM image-wide area surrounding the MUBA site between 1986- Land Cover 1986 hectares 1986 percent cover 1992 hectares 1992 percent cover 1998 hectares 1998 percent cover Clouds 302,313 10% 302,313 10% 302,313 10% Water 273,488 9% 287,514 10% 242,986 8% Agriculture 197,728 7% 378,993 13% 510,496 18% Other forest 1,288,285 44% 1,325,339 46% 1,513,253 52% Natural forest 847,709 25% 546,943 19% 102,402 4% Burn scar 0 0% 68,419 2%
39 238,072 8% Total 2,909,522 100% 2,909,5
238,072 8% Total 2,909,522 100% 2,909,522 100% 2,909,522 100% 32 Figure 45 Graphical portrayal of land cover changes occurring in the TM-wide study area surrounding the MUBA site between 1986 and 1998. Other forest Natural forest Burn scar 1986 1992 1998 400,000600,000800,0001,200,0001,400,0001,600,000Land CoverYear 33 5. UNDERLYING CAUSES The results of this research indicate that the majority of large fires in 1997 in this site were started as small, deliberate fires that rapidly got out of control and escaped into areas of degraded swamp forest. Estimates based on the analysis of satellite imagery and field research indicate that 45 % of the land area of this site burned in 1997. The size of burn scars is the largest of any of our sites in Sumatra. The underlying causes of these fires were mainly the activities of illegal loggers and fishermen and the development of transmigration schemes. Transmigration developments started in this area in the late 1970s and since that time many changes have taken place that have created a fire-prone landscape. The extensive network of drainage canals not only opened up access to the area but also lowered the water table in the surrounding swamp forests. Illegal logging in the swamp forests surrounding the transmigration areas increased rapidly in the 1980s. In combination with legal logging, these illegal activities severely degraded the swamp forests to the point where fire became a threat. In addition to social and biophysical conditions which predisposed these forests to fire, the confusion over land status and the absence of official management also reduced the incentive to stop fires. In the degraded swamp forests which w
40 ere destroyed by fire in 1997, the activ
ere destroyed by fire in 1997, the activities of illegal loggers and fishermen were directly involved. Some of the activities of these people included the setting of small fires, such as cooking fires, which rapidly got out of control in the dry conditions of the 1997 El Niño. In addition, fishermen used fire as a tool in clearing areas for fishing. Again, the lack of and confusion over management of these forest areas meant that there was no incentive to control the fires. Another source of fire in some small parts of the area was in the preparation of land for swamp rice, many of these fires burned beyond the area of intention and into forest areas. 34 6. POLICY IMPLICATIONS Based on the analysis of the underlying causes of fire in the Musi Banyu Asin site, some policy implications for both the national and provincial level are outlined below. 1. Review the land allocation policy in swamp areas, particularly those on deep peats, including to restrict or to reduce the allocation of swamp forest for establishment transmigration settlements in the future national and regional planning. 2. Identify a better land and fire management of swamp areas and provide technical assistance for the existing transmigration schemes in swamp areas. For example, some of tidal transmigration schemes should be converted from rice to aquaculture. 3. The management of Protection Forest needs to be strengthened to avoid degradation of mangroves from the establishment of shrimp ponds. The 2000 Landsat imagery shows that large areas of mangroves have already been converted to shrimp ponds within a two-year period. 4. Provide increased resources to local institutions in education, awareness and
41 for community participation in fire pre
for community participation in fire prevention and fire suppression. 35 7. REFERENCES Asian Development Bank (1999). Causes, extent, impact and costs of 1997/98 fires and drought. Final report, Annex 1 and 2. Planning for fire prevention and drought management project. Asian Development Bank TA 2999-INO. Fortech, Pusat Pengembangan Agribisnis, Margueles Pöyry, Jakarta, Indonesia. Antikidis, E., Arino, O., Janodet, E. & Achard, F. (1999). Development of a new method for burned forest area assessment in Borneo during the 1997 exceptional fire event. In: Proceedings of the FIMP-INTAG International Conference: Data management and modelling using remote sensing and GIS for tropical forest land inventory. 26-29 October 1998 (L. Y., B. King, C. Legg and K. Rennolls, eds.), Jakarta, Indonesia. Barber, C.V. & Schweithelm, J. (2000). Trial by fire. Forest fires and forestry policy in Indonesia's era of crisis and reform. World Resources Institute (WRI), Forest Frontiers Initiative. In collaboration with WWF-Indonesia and Telapak Indonesia Foundation, Washington D.C, USA. Danielsen, F. & Verheugt, W. (1990). Integrating conservation and land-use planning in the coastal region of South Sumatra. The Directorate General of Forest Protection and Nature Conservation (PHPA) and Asian Wetland Bureau (AWB-Indonesia), Bogor, Indonesia. Dennis, R.A. (1999). A review of fire projects in Indonesia 1982 - 1998. Center for International Forestry Research, Bogor. EUFREG (European Union Fire Response Group) (1998). Assessment of the 1997 fires in Indonesia. European Union, Ministry of Forestry and Estate Crops, Jakarta, Indonesia. Hoffmann, A.A., Hinrichs, A. & Siegert, F. (1999). Fire damage in
42 East Kalimantan in 1997/98 related to l
East Kalimantan in 1997/98 related to land use and vegetation classes: Satellite radar inventory results and proposal for further actions. IFFM-SFMP Report No.1a. MOFEC, GTZ and KfW, Samarinda, East Kalimantan. Liew, S.C., Lim, O.K., Kwoh, L.K. & Lim, H. (1998). A study of the 1997 forest fires in South East Asia using SPOT quicklook mosaics. In: 1998 International Geoscience and Remote Sensing Symposium, 6-10 July 1998, Seattle, USA. Lillesand, T.M. & Kiefer, R.W. (1994). Remote Sensing and Image Interpretation, Wiley, USA. Pereira, J.M.C., Chuvieco, E., Beaudoin, A. & Desbois, N. (1997). Remote sensing of burned areas: a review. In: A review of remote sensing methods for the study of large wildland fires (E. Chuvieco, ed.), pp. 127-183, Universidad de Alcalá, Alcalá, Spain. 36 Siegert, F. & Hoffmann, A.A. (1998). Evaluation of the 1998 forest fires in East Kalimantan (Indonesia) using multitemporal ERS-2 SAR images and NOAA-AVHRR data. In: Proceedings of the FIMP-INTAG International Conference: Data management and modelling using remote sensing and gis for tropical forest land inventory. 26-29 October 1998 (L. Y., B. King, C. Legg and K. Rennolls, eds.), Jakarta, Indonesia. Suyanto, S., Dennis, R.A., Ruchiat, Y., Kurniawan, I., Stolle, F., Maus, P. & Applegate, G. (2000). The underlying causes and impacts of fires in South-east Asia. Site 2. Menggala, Lampung Province, Indonesia. CIFOR, ICRAF and USFS, Bogor, Indonesia. Suyanto, S. & Ruchiat, Y. (2000). The underlying cause and impacts of fires in South-east Asia: Impacts of human activities and land tenure conflict on fire and land use change: Case study of MenggalaSumatra. Socio-economic report no. 2. CIFOR, ICRAF and
43 US-Forest Services, Bogor, Indonesia. Tr
US-Forest Services, Bogor, Indonesia. Trigg, S. & Flasse, S. (2000). Characterizing the spectral-temporal response of burned savannah using in situ spectroradiometry and infrared thermometry. International Journal of Remote Sensing 21(16): 3161- 37 APPENDIX I: SOURCES FOR HOT-SPOT DATA Source Dates Analytic technique EUPalembang station 1997: 11 Sep – 31 Dec 1998: 18 Jan – 20 Oct 1999: 26 Mar – 26 Oct see below 1. EU 1996: 19 Jan – 28 Dec 1997: 2 Feb – 15 Oct processed by a contextual algorithm ESRIN 1993: 3 Jan – 3 Dec processed by a contextual algorithm; day time images CNRM 1992: 26 Apr – 31 Dec 1993: 1 Jan – 28 Mar processed with same contextual algorithm as EU-JRC data ATSR 1996: 1 Nov – 31 Dec 1997: 1 Jan – 31 Dec 1998: 1 Jan – 31 Dec 1999: 1 Jan – 31 Dec background value of 308 Kelvin used; night time data DMSP 1997: 1 Jun – 31 Dec various extraction methods 1. These hot-spot data were hand processed. Both night and daytime images were used. Initially, several objects that might be fire were calibrated to establish background temperatures, after which fire locations were extracted. Subsequently, limited tests were carried out to check data and consistency. 38APPENDIX II: LAND COVER CHANGE MATRICES 1992 1986 high density swamp forest low density swamp forest high density estuarine forest low density estuarine forest mangrove forest riverine vegetation transmigration scheme wet land cultivatio settlement scrub and grassland swamp scrub dry swamp scrub burn scars water Grand Total High density swamp forest 3,982 0 0 0 0 0 0 0 0 0 0 0
44 0 900 1 188 0 0 0 0
0 900 1 188 0 0 0 0 0 low density swamp forest 0 0 64 0 0 0 0 0 0 0 0 395 5 293 4 0 0 700 10 0 0 0 0 0 0 High density estuarine forest 0 0 0 0 0 0 0 0 9 0 0 0 0 0 86 1 0 0 0 0 382 3 0 0 low density estuarine forest 0 0 0 0 0 0 0 0 0 0 43 0 0 0 0 0 0 0 0 0 64 0 0 0 mangrove forest 0 0 0 0 0 0 0 0 0 0 3 0 0 0 0 0 669 8 0 0 0 0 0 0 0 0 riverine vegetation 0 0 0 0 0 0 0 0 0 0 549 11 0 0 0 0 174 3 0 0 0 0 28 1 0 0 transmigration scheme 0 0 0 0 0 0 0 0 0 0 0 0 412 5 0 0 686 8 0 0 0 0 0 0 0 0 0 0 0 0 0 0 0 0 0 0 0 0 259 15 0 0 0 0 0 0 0 0 0 0 scrub and grassland 0 0 0 0 0 0 0 0 0 0 0 0 153 0 0 0 0 0 0 0 swamp scrub 0 0 0 0 0 0 0 0 0 0 0 0 0 0 0 0 0 0 0 0 271 10 561 22 0 0 burn scars 0 0 0 0 0 0 0 0 0 0 0 0 644 2 0 0 0 0 0 0 0 0 0 0 0 0 0 0 0 0 0 0 0 0 0 0 0 0 0 0 0 0 0 0 0 0 0 0 0 2 Grand Total 3,982 412 0 271 0 0 1998 1992 low density swamp forest high density estuarine forest low density estuarine forest mangrove forest riverine vegetation tr
45 ansmigration scheme wetland cultivation
ansmigration scheme wetland cultivation settlement scrub and grassland burn scars water unknown Grand Total High density swamp forest 310 0 0 0 0 0 0 0 0 0 0 0 0 0 36.34 2,225 55.87 0 0 0 w density swamp forest 407 0 0 0 0 0 0 0 0 0 0 12.87 0 710 High density estuarine forest 0 0 86.09 0 0 0 0 0 0 0 0 0 929 0 95 low density estuarine forest 0 0 0 0 0 0 0 9 0 0 0 15.01 2,191 13.67 0 112 mangrove forest 0 0 0 0 0 0 80.86 0 36 0 0 0 16.86 0 0 0 riverine vegetation 0 0 0 0 0 0 0 0 371 0 0 0 0 27.02 0 0 0 transmigration scheme 0 0 0 0 0 0 0 0 0 0 2,984 0 0 45 wet land cultivation 0 0 0 0 0 0 0 0 0 0 988 2,259 56.26 0 2 0 59 0 0 0 0 0 0 0 0 0 0 0 0 0 0 0 0 394 0 0 0 412 scrub and grassland 0 0 0 0 0 0 0 0 0 0 0 913 swamp scrub 0 0 0 0 0 0 0 0 0 0 0 0 0 0 0 0 322 1,630 83.49 0 0 0 dry swamp scrub 0 0 0 0 0 0 0 0 0 0 0 0 0 0 0 0 209 0 0 0 271 burn scars 0 0 0 0 0 0 0 0 0 0 18.84 8,826 45.79 0 100 0 0 0 0 0 0 0 0 0 0 0 0 0 0 0 0 0 0 0 0 0 0 Grand Total 717