
Understanding the Options for Local Governments Justin Barnes North Carolina Solar CenterDSIRE March 22 2012 Justinbarnesncsuedu Background Created by the NC Solar Center in 1995 Funded by the US DOE EERE ID: 314801
Download Presentation The PPT/PDF document "Incentives for Renewable Energy and Ener..." is the property of its rightful owner. Permission is granted to download and print the materials on this web site for personal, non-commercial use only, and to display it on your personal computer provided you do not modify the materials and that you retain all copyright notices contained in the materials. By downloading content from our website, you accept the terms of this agreement.


Slide1
Incentives for Renewable Energy and Energy EfficiencyUnderstanding the Options for Local Governments
Justin Barnes
North Carolina Solar Center/DSIRE
March 22, 2012
Justin_barnes@ncsu.eduSlide2
Background
Created by the NC Solar Center in 1995
Funded by the US DOE (EERE)
Administered by NREL
Approximately 2,600 entries
Renewable energy and energy efficiency
Rules, regulations, policies, and incentives
Approximately 170,000 unique visitors/monthSlide3
Database ContentAll
State
incentives and policies – including DC and territories
All
Federal
incentives and policies
Most
Utility
incentives
Some
Local
policies and incentives – examples and largest cities/countiesSlide4
Database Content
Incentives
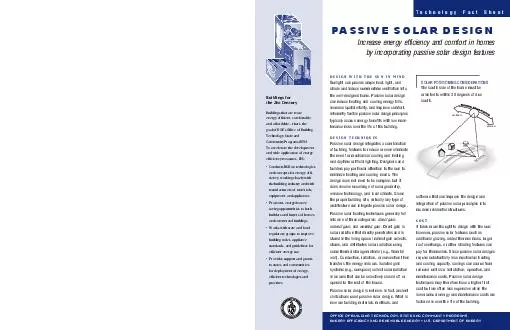
Green Building Incentives
Industry Recruitment/Support
Leasing Programs
Rebate Programs
PACE Financing
Production Incentives (RE)
Property and Sales Tax IncentivesGrants ProgramsLoan Programs
Rules, Regulations, Policies
Appliance/Equipment
Efficiency Standards
Building Energy Codes
Contractor
Licensing
Energy
Efficiency Resource Standards
Energy
Standards for Public Buildings
Generation
Disclosure Requirements
Interconnection
Net Metering (RE)
Public
Benefits Fund
Renewables
Portfolio Standard
Solar/Wind
Access Policy
Solar/Wind Permitting
Standards
Line Extension AnalysisSlide5
Not Found in DSIREPrivate foundation grant opportunities
Research and development (R&D) incentives
Commercialization incentives
Demonstration projects
One-time grants or RFPsSlide6
Tips
Click on a state to browse
Use the search function to find a specific incentive type
Always check expiration dates, date of last review, and the program website Slide7
RESULTS!
Search for Incentives for Renewable Energy and Energy Efficiency in “Massachusetts” for “Local Governments”
Pare down the list by further limiting the criteria to efficiency or renewables or for a specific technology (e.g., PV, Lighting)Slide8
Direct Incentives for Local Governments
L
ocal governments are eligible for any programs for electric or gas ratepayers (SBC, EEPS, RPS charges)
Renewable energy programs sometimes offer higher incentives to offset lack of access to tax credits (not EE programs)
RE Structure: $/W, $/kWh, $/Annual kWh (or
therms
)
EE Structure: $/system or $/Annual kWh (or
therms)Many programs offer technical assistance services, subsidized energy audits, special assistance for small projects.Slide9
Loans for Local GovernmentsMany states have revolving loan programs specifically for units of government
Programs often provide a combination of technical assistance and financing, and can be used in conjunction with energy savings performance contracts (ESPCs)
Renewables may be tough to integrate into a loan package due to loan limits on payback
Some utility programs exist, but not common Slide10
Net Metering
State policy
Voluntary utility program(s) only
www.dsireusa.org / March 2012
*
State policy applies to certain utility types only (e.g., investor-owned utilities)
WA:
100
OR:
25/2,000*
co-ops &
munis
: 10/25
CA:
1,000*
MT:
50*
NV:
1,000*
UT:
25/2,000*
AZ:
no limit*
ND:
100*
NM:
80,000*
WY:
25*
HI:
100
KIUC: 50
CO:
no limit
co-ops &
munis
: 10/25
OK:
100*
MN:
40
LA: 25/300
AR:
25/300
MI:
150*
WI:
20/100*
MO:
100
IA: 500*
IN:
1,000*
IL:
40*
FL:
2,000
KY:
30*
OH:
no limit*
GA:
10/100
WV:
25/50/500/2,000
NC:
1,000*
VT:
20/250/2,200
VA:
20/500*
NH:
1,000
MA: 60/1,000/2,000/10,000*
RI:
5,000
*
CT:
2,000*
NY:
10
/
25/500/1,000/2,000*
PA:
50/3,000/5,000*
NJ:
no limit*
DE:
25/100/2,000
co-ops &
munis
: 25/100/500
MD:
2,000
DC:
1,000
Note: Numbers indicate individual system capacity limit in kW. Some limits vary by customer type, technology and/or application. Other limits might also apply.
This map generally does not address statutory changes until administrative rules have been adopted to implement such changes.
NE:
25
KS:
25/200*
ME:
660
co-ops &
munis
: 100
PR:
25/1,000
AK:
25*
43 states
+ DC & PR have adopted a net metering policy
DCSlide11
Net Metering
Net metering: Allows for electricity to flow to and from the customer
Not all policies are created equal
In some cases local governments are permitted to use arrangements not available to other customers (e.g., meter aggregation).Slide12
Meter Aggregation/Virtual Net Metering
DC
Aggregation of some from authorized by stateSlide13
VariationsOwnership requirements
Contiguous vs. non-contiguous properties
Multiple customers
Multiple generators
Modified system/aggregate system size limits
Rollover rates
Distance limitations
Number of accounts
Addressing multiple tariffs(Almost) Universal Restriction: Accounts must be located in same utility service territorySlide14
Third-Party Ownership Options
Solar power developer finances, owns and operates the system
Customer receives benefits of on-site electric generation (i.e., lower electric bill) and compensates the owner through electricity purchases or lease payments
Benefits: Tax incentive utilization, up-front costs reduced/eliminated, lower “hassle factor”
Property leases are a distinctly different option.
Customer makes lease/electricity payment to system owner
Utility purchases RECs from system owner
Utility credits customer for net excess generation
Customer purchases traditional electricity from utility
Customer supplied with solar electricity by system owner
System owner transfers REC to utilitySlide15
Third-Party Ownership Options
Customer makes lease/electricity payment to system owner
Utility purchases RECs from system owner
Utility credits customer for net excess generation
Customer purchases traditional electricity from utility
Customer supplied with solar electricity by system owner
System owner transfers REC to utility
Lower,
predictable
e
nergy
c
osts
Might be packaged together with an energy service performance contract (ESPC)Slide16
3
rd
-Party Solar PV Power Purchase Agreements (PPAs)
www.dsireusa.org / February 2012
Apparently disallowed by state or otherwise restricted by legal barriers
Status unclear or unknown
Authorized by state or otherwise currently in use, at least in certain jurisdictions within in the state
Puerto Rico
At least 21 states + PR authorize or allow 3
rd
-party solar PV PPAs
Note: This map is intended to serve as an unofficial guide; it does not constitute legal advice. Seek qualified legal expertise before making binding
financial decisions related to a 3rd-party PPA. See following slides for additional important information and authority references.
UT
: limited to
certain sectors
AZ
: limited to
certain sectors
VA: see notesSlide17
Additional ResourcesESPC Financing Options:
http://www2.presidentsclimatecommitment.org/documents/ccitoolkit/Energy_Performance_Contracting_Financing_Options.pdf
NREL PPA Checklist of Local Governments:
http://www.nrel.gov/docs/fy10osti/46668.pdf
DOE Solutions Center, ESPCs:
http://www1.eere.energy.gov/wip/solutioncenter/buildings/performance_contracting.html
Energy Services Coalition: http://www.energyservicescoalition.org/ Solar Powering Your Community - A Guide for Local Governments: http://solaramericacommunities.energy.gov/resources/guide_for_local_governments
/
Slide18
Questions??