
McLeod MA Baker MG Wilson N Kelly H Kiedrzynski T Kool JL Protective Effect of Maritime Quarantine in South Pacific Jurisdictions 191819 Influenza Pandemic Emerg Infect Dis 2008143468470 httpsdoiorg103201eid1403070927 ID: 1017336
Download Presentation The PPT/PDF document "Figure Figure. Comparison of at..." is the property of its rightful owner. Permission is granted to download and print the materials on this web site for personal, non-commercial use only, and to display it on your personal computer provided you do not modify the materials and that you retain all copyright notices contained in the materials. By downloading content from our website, you accept the terms of this agreement.


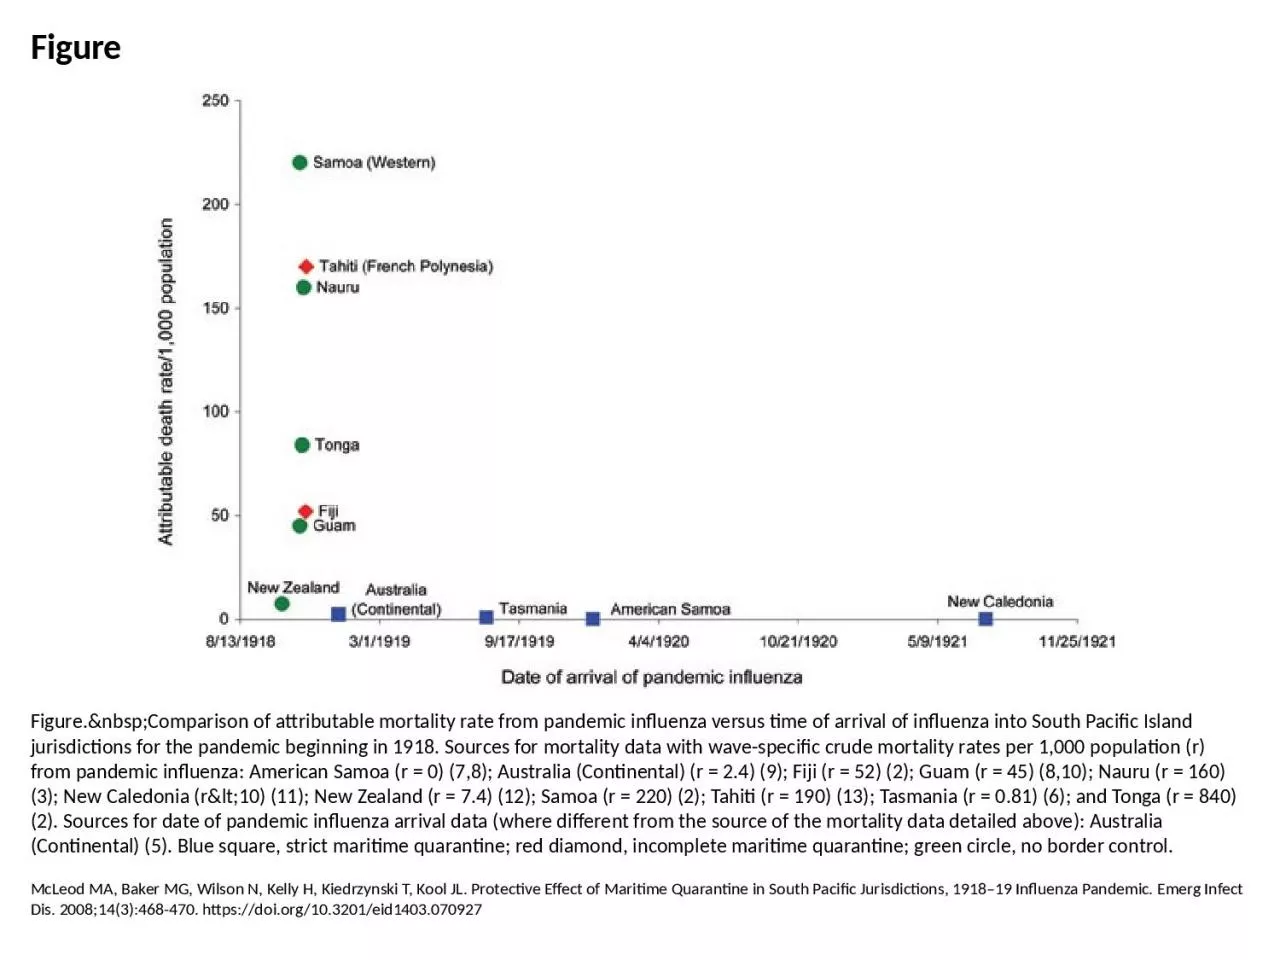
1. FigureFigure. Comparison of attributable mortality rate from pandemic influenza versus time of arrival of influenza into South Pacific Island jurisdictions for the pandemic beginning in 1918. Sources for mortality data with wave-specific crude mortality rates per 1,000 population (r) from pandemic influenza: American Samoa (r = 0) (7,8); Australia (Continental) (r = 2.4) (9); Fiji (r = 52) (2); Guam (r = 45) (8,10); Nauru (r = 160) (3); New Caledonia (r<10) (11); New Zealand (r = 7.4) (12); Samoa (r = 220) (2); Tahiti (r = 190) (13); Tasmania (r = 0.81) (6); and Tonga (r = 840) (2). Sources for date of pandemic influenza arrival data (where different from the source of the mortality data detailed above): Australia (Continental) (5). Blue square, strict maritime quarantine; red diamond, incomplete maritime quarantine; green circle, no border control.McLeod MA, Baker MG, Wilson N, Kelly H, Kiedrzynski T, Kool JL. Protective Effect of Maritime Quarantine in South Pacific Jurisdictions, 1918–19 Influenza Pandemic. Emerg Infect Dis. 2008;14(3):468-470. https://doi.org/10.3201/eid1403.070927