
Precipitation mechanisms Rainall maps Rainfall hyetographs Nexrad measurement of rainfall Reading Applied Hydrology Sections 35 to 36 on Evaporation for Thursday Precipitation Precipitation water falling from the atmosphere to the earth ID: 1022846
Download Presentation The PPT/PDF document "CE 394K.2 Precipitation" is the property of its rightful owner. Permission is granted to download and print the materials on this web site for personal, non-commercial use only, and to display it on your personal computer provided you do not modify the materials and that you retain all copyright notices contained in the materials. By downloading content from our website, you accept the terms of this agreement.


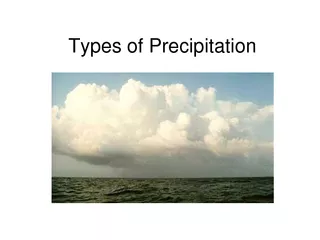
1. CE 394K.2 PrecipitationPrecipitation mechanismsRainall mapsRainfall hyetographsNexrad measurement of rainfallReading: Applied Hydrology Sections 3.5 to 3.6 on Evaporation for Thursday
2. PrecipitationPrecipitation: water falling from the atmosphere to the earth.RainfallSnowfallHail, sleetRequires lifting of air mass so that it cools and condenses.
3. Mechanisms for air liftingFrontal liftingOrographic lifting Convective lifting
4. Frontal LiftingBoundary between air masses with different properties is called a frontCold front occurs when cold air advances towards warm airWarm front occurs when warm air overrides cold airCold front (produces cumulus cloud) Cold front (produces stratus cloud)
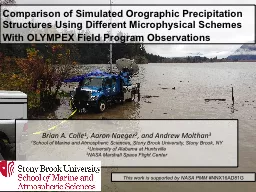
5. Orographic liftingOrographic uplift occurs when air is forced to rise because of the physical presence of elevated land.
6. Convective liftingHot earth surfaceConvective precipitation occurs when the air near the ground is heated by the earth’s warm surface. This warm air rises, cools and creates precipitation.
7. CondensationCondensation is the change of water vapor into a liquid. For condensation to occur, the air must be at or near saturation in the presence of condensation nuclei. Condensation nuclei are small particles or aerosol upon which water vapor attaches to initiate condensation. Dust particulates, sea salt, sulfur and nitrogen oxide aerosols serve as common condensation nuclei. Size of aerosols range from 10-3 to 10 mm.
8. Precipitation formationLifting cools air masses so moisture condensesCondensation nucleiAerosols water molecules attachRising & growing0.5 cm/s sufficient to carry 10 mm dropletCritical size (~0.1 mm)Gravity overcomes and drop falls
9. Forces acting on rain dropFdFdFbFgDThree forces acting on rain dropGravity force due to weightBuoyancy force due to displacement of airDrag force due to friction with surrounding air
10. Terminal VelocityTerminal velocity: velocity at which the forces acting on the raindrop are in equilibrium. If released from rest, the raindrop will accelerate until it reaches its terminal velocityRaindrops are spherical up to a diameter of 1 mmFor tiny drops up to 0.1 mm diameter, the drag force is specified by Stokes lawFdFdFbFgDVAt standard atmospheric pressure (101.3 kpa) and temperature (20oC), rw = 998 kg/m3 and ra = 1.20 kg/m3
11. Rainfall patterns in the US
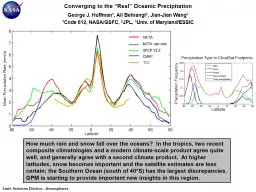
12. Global precipitation pattern
13. Spatial RepresentationIsohyet – contour of constant rainfallIsohyetal maps are prepared by interpolating rainfall data at gaged points.Austin, May 1981 Wellsboro, PA 1889
14. Texas Rainfall Maps
15. Temporal RepresentationRainfall hyetograph – plot of rainfall depth or intensity as a function of timeCumulative rainfall hyetograph or rainfall mass curve – plot of summation of rainfall increments as a function of timeRainfall intensity – depth of rainfall per unit time
16. Rainfall Depth and Intensity
17. Incremental RainfallRainfall Hyetograph
18. Cumulative RainfallRainfall Mass Curve
19. Arithmetic Mean MethodSimplest method for determining areal averageP1P2P3P1 = 10 mmP2 = 20 mmP3 = 30 mmGages must be uniformly distributedGage measurements should not vary greatly about the mean
20. Thiessen polygon methodP1P2P3A1A2A3Any point in the watershed receives the same amount of rainfall as that at the nearest gageRainfall recorded at a gage can be applied to any point at a distance halfway to the next station in any directionSteps in Thiessen polygon methodDraw lines joining adjacent gages Draw perpendicular bisectors to the lines created in step 1Extend the lines created in step 2 in both directions to form representative areas for gagesCompute representative area for each gageCompute the areal average using the following formulaP1 = 10 mm, A1 = 12 Km2P2 = 20 mm, A2 = 15 Km2P3 = 30 mm, A3 = 20 km2
21. Isohyetal methodP1P2P3102030StepsConstruct isohyets (rainfall contours)Compute area between each pair of adjacent isohyets (Ai)Compute average precipitation for each pair of adjacent isohyets (pi)Compute areal average using the following formulaA1=5 , p1 = 5A2=18 , p2 = 15 A3=12 , p3 = 25 A4=12 , p3 = 35
22. Inverse distance weightingP1=10P2= 20P3=30Prediction at a point is more influenced by nearby measurements than that by distant measurementsThe prediction at an ungaged point is inversely proportional to the distance to the measurement pointsStepsCompute distance (di) from ungaged point to all measurement points. Compute the precipitation at the ungaged point using the following formulad1=25d2=15d3=10p
23. Rainfall interpolation in GISData are generally available as points with precipitation stored in attribute table.
24. Rainfall maps in GISNearest Neighbor “Thiessen” Polygon InterpolationSpline Interpolation
25. NEXRADNEXRAD TowerNEXt generation RADar: is a doppler radar used for obtaining weather informationA signal is emitted from the radar which returns after striking a rainfall dropReturned signals from the radar are analyzed to compute the rainfall intensity and integrated over time to get the precipitationWorking of NEXRAD
26. NEXRAD WSR-88D Radars in Central Texas(Weather Surveillance Radar-1988 Doppler)scanning range = 230 kmStage I: Just RadarStage II: gages, satellite, and surface temperatureStage III: Continuous mosaic from radar overlapsNEXRAD Products:Source: PBS&J, 2003EWX – NEXRAD Radar in New Braunfels
27. NEXRAD dataNOAA’s Weather and Climate Toolkit (JAVA viewer)http://www.ncdc.noaa.gov/oa/wct/ West Gulf River Forecast Centerhttp://www.srh.noaa.gov/wgrfc/National Weather Service Precipitation Analysishttp://www.srh.noaa.gov/rfcshare/precip_analysis_new.php