
Data Analysis Dr Allan Tucker Intelligent Data Analytics Group Department of Computer Science Brunel University London The Talk The IDA Group at Brunel Some characteristics of disease progression ID: 779389
Download The PPT/PDF document "Trajectories Through the Disease Process..." is the property of its rightful owner. Permission is granted to download and print the materials on this web site for personal, non-commercial use only, and to display it on your personal computer provided you do not modify the materials and that you retain all copyright notices contained in the materials. By downloading content from our website, you accept the terms of this agreement.


Slide1
Trajectories Through the Disease Process: Cross Sectional and Longitudinal Data Analysis
Dr Allan TuckerIntelligent Data Analytics Group,Department of Computer Science, Brunel University London.
Slide2The Talk
The IDA Group at BrunelSome characteristics of disease progressionCross section and longitudinal dataModelling longitudinal data
Non-stationary state space modelsModelling cross section dataTemporal bootstrap for sequence reconstruction
Calibrating with longitudinal data
Disease subclasses
Slide3Intelligent Data Analytics at Brunel
Founded in 1995IDA focuses on combination of algorithm / experts and usersApplications in Environment, Health, Bioinformatics, Software Engineering
Slide4Image Analysis of Retinal Blood Vessels
Slide5Epidemiology in Kazahkstan
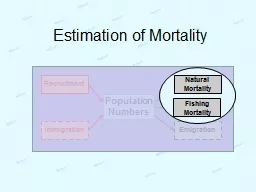
Slide6Fisheries Ecology
Tucker, A. and Duplisea, D. (2012) 'Bioinformatics tools in predictive ecology: Applications to fisheries'.
Philosophical Transactions of the Royal Society: Part B
, 367 (1586). pp. 279 - 290.
doi
:
10.1098/rstb.2011.0184
Slide7Fisheries Ecology
Trifonova, N. , Kenny, A. , Maxwell, D. , Duplisea, D. , et al. (2015) '
Spatio-temporal Bayesian network models with latent variables for revealing
trophic
dynamics and functional networks in fisheries ecology'.
Ecological Informatics
, 30 pp. 142 - 158.
doi
:
10.1016/j.ecoinf.2015.10.003
Slide8Regulatory Gene Networks
(2011)
Anvar
, SY., Tucker, A.,
Vinciotti
, V.,
Venema
, A., van
Ommen
, GB., van
der
Maarel
, SM.,
Raz
, V. and 't
Hoen
, PAC., Interspecies translation of disease networks increases robustness and predictive accuracy,
PLoS
Computational Biology 7 (11) : e1002258
Slide9Heat stress and photosynthesis
Biotic
stress
Regulatory Gene Networks
Bo, V. , Curtis, T. , Lysenko, A. , Saqi, M. , et al. (2014) 'Discovering Study-Specific Gene Regulatory Networks'.
PLoS One
9 (9) e106524
Slide10Focus on Glaucoma
Glaucoma is a leading cause of irreversible blindness in the world.Visual Field Data: measures sensitivity of field of vision
Also use HRT Data: anatomical info of retina
Slide11State Space Models for Classification, Feature Selection & Forecasting
Flexibility as n
odes can represent: Class labels (e.g.
d
isease outcome)
Variables at “points in time”
L
atent variables via EM / Baum Welch
Slide12Cross Section Studies
Record attributes (test results, demographics etc.)Across a (typically largish) sample of the populationCarried out at a single window of time
Gives a “snapshot” of a disease over the populationAdvantages:No issues in following upCaptures diversity of disease in large cohort
Can capture genuine healthy and v early stages of disease
Disadvantages:
No measure of temporal characteristics of disease
Slide13Longitudinal Studies
Measure clinical tests etc. of a (normally small) cohort over timeAdvantages:Measure genuine disease progression over time
DisadvantagesCohort usually diagnosed already or “at-risk”Expensive
Difficult to acquire healthy time-series (e.g. ageing)
Slide14Degenerative Disease Progression
“Continuing deterioration of organs or tissue over time”Whilst intervention can slow or sometimes temporarily reverse symptoms, inevitable progression:Pre-symptomatic to ...
Early symptoms to ...Diagnosis to ...Advanced stages
Slide15Degenerative Disease Progression
Trajectories observed through dataThese depend on many factors:Selected clinical variables
Data quality, sample size etc.Disease type (monotonic increase
in symptoms)
Slide16Subclasses of Disease
Subclasses due to diseases often being “umbrella terms”:CancersGlaucoma
Etc. Etc.Unsupervised methods to identify subsets of patients with similar symptoms – personalised medicineAlso similarities based on temporal constructs:Disease progression (trajectories)
Disease dynamics
Response to intervention
Slide17Subclasses of Disease
Also similarities based on temporal constructs:
Disease progression (trajectories)
Disease dynamics
Response to intervention
Slide18Subclasses in Glaucoma:
Ceccon
, S. Garway-Heath, DF. Crabb, DP. Tucker, A. Exploring
early glaucoma and the visual field test: Classification and clustering using
Bayesian networks, Biomedical
and Health Informatics, IEEE Journal of 18 (3),
1008-1014, 2014.
Slide19Subclasses of Disease
Slide20Subclasses of Disease
Slide211 Non-Stationary Time-Series
Glaucoma involves the Optic Nerve Head (ONH) undergoing structural changesAs a result the relationships between different physiological parts of the eye will change over timeDBNs and other time-series are often stationary
Slide22Non-Stationary Time-Series
Glaucoma involves the Optic Nerve Head (ONH) undergoing structural changesAs a result the relationships between different physiological parts of the eye will change over timeDBNs and other time-series are often stationary
Slide23Non-Stationary Time-Series
Glaucoma involves the Optic Nerve Head (ONH) undergoing structural changesAs a result the relationships between different physiological parts of the eye will change over timeDBNs and other time-series are often stationary
Slide24Non-Stationary DBNs
Relatively recent that approaches to model non-stationary DBNs appeared:Talin & Hengartner
(2005): MCMC approach but limited to fixed no. of segments & undirected edgesXuan & Murphy (2007): also limited to undirected edgesRobinson &
Hartemink
(2010): all degrees of freedom except parameters
Grzegorczyk
&
Husmeier
(2009): retained stationarity of structure but modelled parameter non-stationarity
Ceccon
et al. (2012): All degrees of freedom using heuristic search (simulated annealing)
Slide25SA for Non-Stationary DBNs
Ceccon et al. 2012Search all degrees:Changepoints
StructuresParametersSimulated AnnealingWarp operator
Switch operator
BIC metric
Tucker
,
A. Li
,
Y.
Ceccon, S. Swift, S. Trajectories
Through the Disease Process: Cross Sectional and Longitudinal Studies.
Foundations of Biomedical Knowledge Representation
2015:
189-205
Ceccon
,
S.
Garway
-Heath
,
DF,
Crabb
,
DP, Tucker, A. Non-stationary
clustering
Bayesian
networks for G
laucoma,
International
Conference on Machine
Learning
2012. Edinburgh
Slide26Subclasses in Dynamics:
SA for Non-Stationary DBNs
Glaucoma patient data
Slide272 Pseudo Time-Series
Take labelled cross-sectional data
Exploit labels and distance metrics
Build realistic “trajectories”
Starting at healthy / early disease stages
Finish at advanced disease
Slide28Temporal Bootstrap
Take labelled cross-sectional data
Combine resampling
and shortest path
G
enerate multiple trajectories
Floyd, RW. Algorithm 97: Shortest path,
Commun
. ACM
5(6), 1962.
Tucker, A. & Garway-Heath, D. The
pseudotemporal
bootstrap for predicting glaucoma from cross-sectional visual field data,
IEEE Trans
Inf
Technol
Biomed
14(1), 2010
Slide29Simulating Cross Sectional Data
Simulate
Data with HMM
Three states
S
ample 1000 time series
Randomly select one
d
atum
from each series
Can we re-engineer original
HMM model?
Slide30Modelling Progression - Time
Slide31Modelling Progression - Time
Slide32Modelling Progression - Time
Slide33Visual Field & HRT
Slide34Trajectory Subclasses: VF & HRT
Identifying interesting points in trajectories
Use unsupervised learning to cluster areas in the trajectories
Interpreting clusters
Exploring state transitions
Slide35Calibrating with Real MTS:
Dynamics
Dynamic Parameters
Gold Standard
Slide36Calibrating with Real MTS:
Population Sensitivities
NFB1
NFB2
NFB3
NFB4
NFB5
NFB6
Gold Standard
Slide37Applicable to other clinical studies
Parkinson’s Disease:
Found cluster of controls with mild symptomsBreast Cancer:
Found key variable with apparent “tipping point”
B-Cell Microarray Data:
B-Cells and soon LUMC data: Biobank
Slide38Applicable to other clinical studies
B-Cell
Microarray Data:B-Cells and soon LUMC data: Biobank
Parkinson’s Disease:
Found cluster of controls with mild symptoms
Breast Cancer:
Found key variable with apparent “tipping point”
Slide39Conclusions
Cross sectional and Longitudinal studies offer different advantages in modelling progressive disease Novel methods to model non-stationary progression
Sequence reconstruction techniques to build approximate time-series models Data Integration may offer best of both worlds (diversity of symptoms and genuine temporal data)
Ability to discover subclasses of disease based on their dynamics
Slide40Extensions
Other diseases & genomic data: biobank
Key junctions / endpoints etc.
Subclass discovery – latent variables
Constraining trajectories to be “realistic”
Thanks to
Dr Stefano Ceccon & Dr Yuanxi Li
David Garway-Heath,
Moorfields
Eye Hospital / Institute of Ophthalmology