
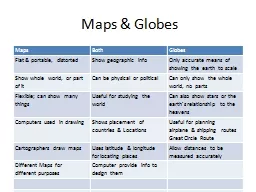
Globe is a threedimensional scale model of Earth Presents the most accurate depiction of geographic information Map is a symbolic representation of all or part of the earth on a flat piece of paper Maps can be useful in showing small areas in great detail ID: 530370
Download Presentation The PPT/PDF document "From Globes to Maps" is the property of its rightful owner. Permission is granted to download and print the materials on this web site for personal, non-commercial use only, and to display it on your personal computer provided you do not modify the materials and that you retain all copyright notices contained in the materials. By downloading content from our website, you accept the terms of this agreement.

Slide1
From Globes to MapsSlide2
Globe
is a three-dimensional scale model of Earth. Presents the most accurate depiction of geographic information. Slide3
Map
is a symbolic representation of all or part of the earth on a flat piece of paper. Maps can be useful in showing small areas in great detail. Slide4
From 3-D to 2D
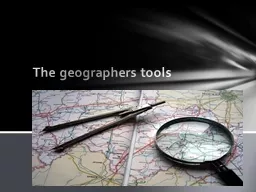
Cartographers
use mathematical formulas to transfer information from a round globe to a flat map.
To create maps, cartographers project the round earth onto a flat surface –
making a map projection.Slide5
Basic Categories of Map Projections
Planar
– Shows the earth centered in such a way that a strait line coming from the center to any other point represents the shortest distance. It is most accurate at its center (the poles). Slide6
Basic Categories of Map Projections
Cylindrical
– is based on the projection of the globe onto a cylinder. This projection is most accurate near the equator.Slide7
Basic Categories of Map Projections
Conic
– Is created by placing a cone over part of the globe. It is best suited for showing limited east-west areas that are not too far from the equator. Slide8
Map ProjectionsSlide9
Winkel Tripel Projection
Most widely used map in the world. Provides good balance between the size and shape of land areas as they are shown on the map.Slide10
Robinson Projection
The continents appear much as they do on the globe however, there is minor distortion near the polesSlide11
Goode's Interrupted Equal-Area Projection
A map that looks something like a globe that has been cut apart and laid flat. Shows the true size and shape of earth’s landmasses but the distances are somewhat distorted. Slide12
Mercator Projection
Once the most commonly used projection, increasingly distorts size and distance as it moves away from the equator. Slide13
Map FeaturesSlide14
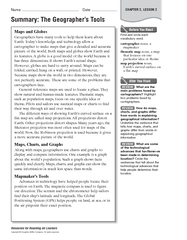
Cartography
Has been described as the meeting place of art and science.The primary purpose of a map is to show information or a geological concept or relationship.Maps must show an accurate relationship between objects and featuresSlide15
Basic Map Elements
Compass RoseShowing North
Illustrates Cardinal DirectionsSlide16
Basic Map Elements
Map Scale
The relationship between a distance on a map and the corresponding distance on the earth's surface.
Slide17
Basic Map Elements
Map Legend
A
table of symbols used on a map or chartSlide18
What is required in your map
TitleGeographic GridScaleCompass RoseLegendPolitical (Cities, Countries, States) and Physical features (Landforms and bodies of water)DateName of Cartographer