
DrChayada Bhadrakom Agricultural and Resource Economics Kasetsart University Cluster analysis Lecture Tutorial outline Cluster analysis Example of cluster analysis Work on SPSS Introduction ID: 1035703
Download Presentation The PPT/PDF document "Cluster analysis Presented by" is the property of its rightful owner. Permission is granted to download and print the materials on this web site for personal, non-commercial use only, and to display it on your personal computer provided you do not modify the materials and that you retain all copyright notices contained in the materials. By downloading content from our website, you accept the terms of this agreement.


1. Cluster analysis Presented by Dr.Chayada BhadrakomAgricultural and Resource Economics, Kasetsart University
2. Cluster analysis Lecture / Tutorial outlineCluster analysisExample of cluster analysisWork on SPSS
3. IntroductionExampleMarketing research: Customer survey on brand awareness
4. QuestionIs there a linear relation between brand awareness and yearly income?Hypothesis: The higher a person's income, the higher his/her brand awareness.
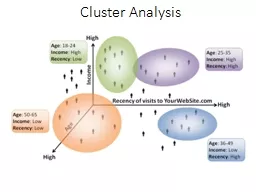
5. QuestionIs there structure in the brand awareness dataset?Are there clusters for the combination of yearly income and brand awareness?
6. Cluster AnalysisIt is a class of techniques used to classify cases into groups that are relatively homogeneous within themselves and heterogeneous between each other, on the basis of a defined set of variables. These groups are called clusters.
7.
8. Cluster Analysis and marketing researchMarket segmentation. E.g. clustering of consumers according to their attribute preferencesUnderstanding buyers behaviours. Consumers with similar behaviours/characteristics are clusteredIdentifying new product opportunities. Clusters of similar brands/products can help identifying competitors / market opportunitiesReducing data. E.g. in preference mapping
9. Steps to conduct a Cluster AnalysisFormulate the problemSelect a distance measureSelect a clustering algorithmDetermine the number of clustersValidate the analysis
10.
11. Problem FormulationPerhaps the most important part of formulating the clustering problem is selecting the variables on which the clustering is basedBasically, the set of variables selected should describe the similarity between objects in terms that are relevant to the marketing research problemThe variables should be selected based on past research, theory, or a consideration of the hypotheses being tested. In exploratory research, the researcher should exercise judgment and intuition
12. Defining distanceMost common EuclideanDij distance between cases i and jxki value of variable Xk for case jThe Euclidean distance is the square root of the sum ofthe squared differences in values for each variable.
13. Choosing a clustering procedureSequentialThreshold ParallelThresholdOptimizingPartitioningSingleCompleteAverageClustering ProceduresNonhierarchicalHierarchicalAgglomerativeDivisiveWard’s MethodLinkageMethods VarianceMethodsCentroidMethods
14. Clustering proceduresHierarchical proceduresAgglomerative (start from n clusters, to get to 1 cluster)Divisive (start from 1 cluster, to get to n cluster)Non hierarchical proceduresK-means clustering
15. Agglomerative clustering
16. Agglomerative clusteringLinkage methodsSingle linkage (minimum distance)Complete linkage (maximum distance)Average linkageWard’s methodCompute sum of squared distances within clustersAggregate clusters with the minimum increase in the overall sum of squaresCentroid methodThe distance between two clusters is defined as the difference between the centroids (cluster averages)
17. Linkage Methods of ClusteringSingle Linkage or Nearest neighbor Minimum DistanceComplete Linkage orFurthest NeighborMaximum DistanceAverage DistanceCluster 1Cluster 2Cluster 1Cluster 2Cluster 1Cluster 2Average LinkageBetween-groups Linkage
18. Other Agglomerative Clustering MethodsWard’s ProcedureCentroid Method
19. Example of hierarchical method: Single linkage
20. Example of hierarchical method: Complete linkage
21. K-means clusteringThe number k of cluster is fixedAn initial set of k “seeds” (aggregation centres) is providedFirst k elementsOther seedsGiven a certain treshold, all units are assigned to the nearest cluster seedNew seeds are computedGo back to step 3 until no reclassification is necessaryUnits can be reassigned in successive steps (optimising partioning)
22. Hierarchical vs Non hierarchical methodsHierarchical clusteringNo decision about the number of clustersProblems when data contain a high level of errorCan be very slowInitial decision are more influential (one-step only)Non hierarchical clusteringFaster, more reliableNeed to specify the number of clusters (arbitrary)Need to set the initial seeds (arbitrary)
23. Suggested approachFirst perform a hierarchical method to define the number of clustersThen use the k-means procedure to actually form the clusters
24. Defining the number of clusters: elbow rule (1)n
25. Elbow rule (2): the scree diagram
26. Validating the analysisImpact of initial seeds / order of casesImpact of the selected methodConsider the relevance of the chosen set of variables
27. SPSS Example
28.
29. Number of clusters: 10 – 6 = 4
30.
31. Open the dataset Cluster_small.sav
32.
33.
34.
35.
36.
37.
38.
39.
40.
41. Open the dataset supermarkets_update.sav
42. The supermarkets.sav dataset
43. Cluster analysis: basic stepsApply Ward’s methodsCheck the agglomeration scheduleDecide the number of clustersApply the k-means method
44. Analyse / Classify
45. Select the component scores
46. Select Ward’s algorithm
47. Output: Agglomeration schedule
48. Number of clustersIdentify the step where the “distance coefficients” makes a bigger jump
49. The scree diagram (Excel needed)
50. Number of clustersNumber of cases 150 NStep of ‘elbow’ 145 S__________________________________Number of clusters 5 N-S
51. Now repeat the analysisChoose the k-means techniqueSet 5 as the number of clustersSave cluster number for each caseRun the analysis
52. K-means
53. K-means dialog box
54. Save cluster membership
55. Cluster membership
56. Interpret