
Acquiring T1Weighted Transverse T2Weighted Sagittal Adult Equine Tarsus 1 Weighted Slice Thickness Flip Angle View cm Resolution mm pixel placed in extended position solenoidal human extremit ID: 938053
Download Pdf The PPT/PDF document "LOWFIELD MAGNETIC RESONANCE IMAGING EQUI..." is the property of its rightful owner. Permission is granted to download and print the materials on this web site for personal, non-commercial use only, and to display it on your personal computer provided you do not modify the materials and that you retain all copyright notices contained in the materials. By downloading content from our website, you accept the terms of this agreement.


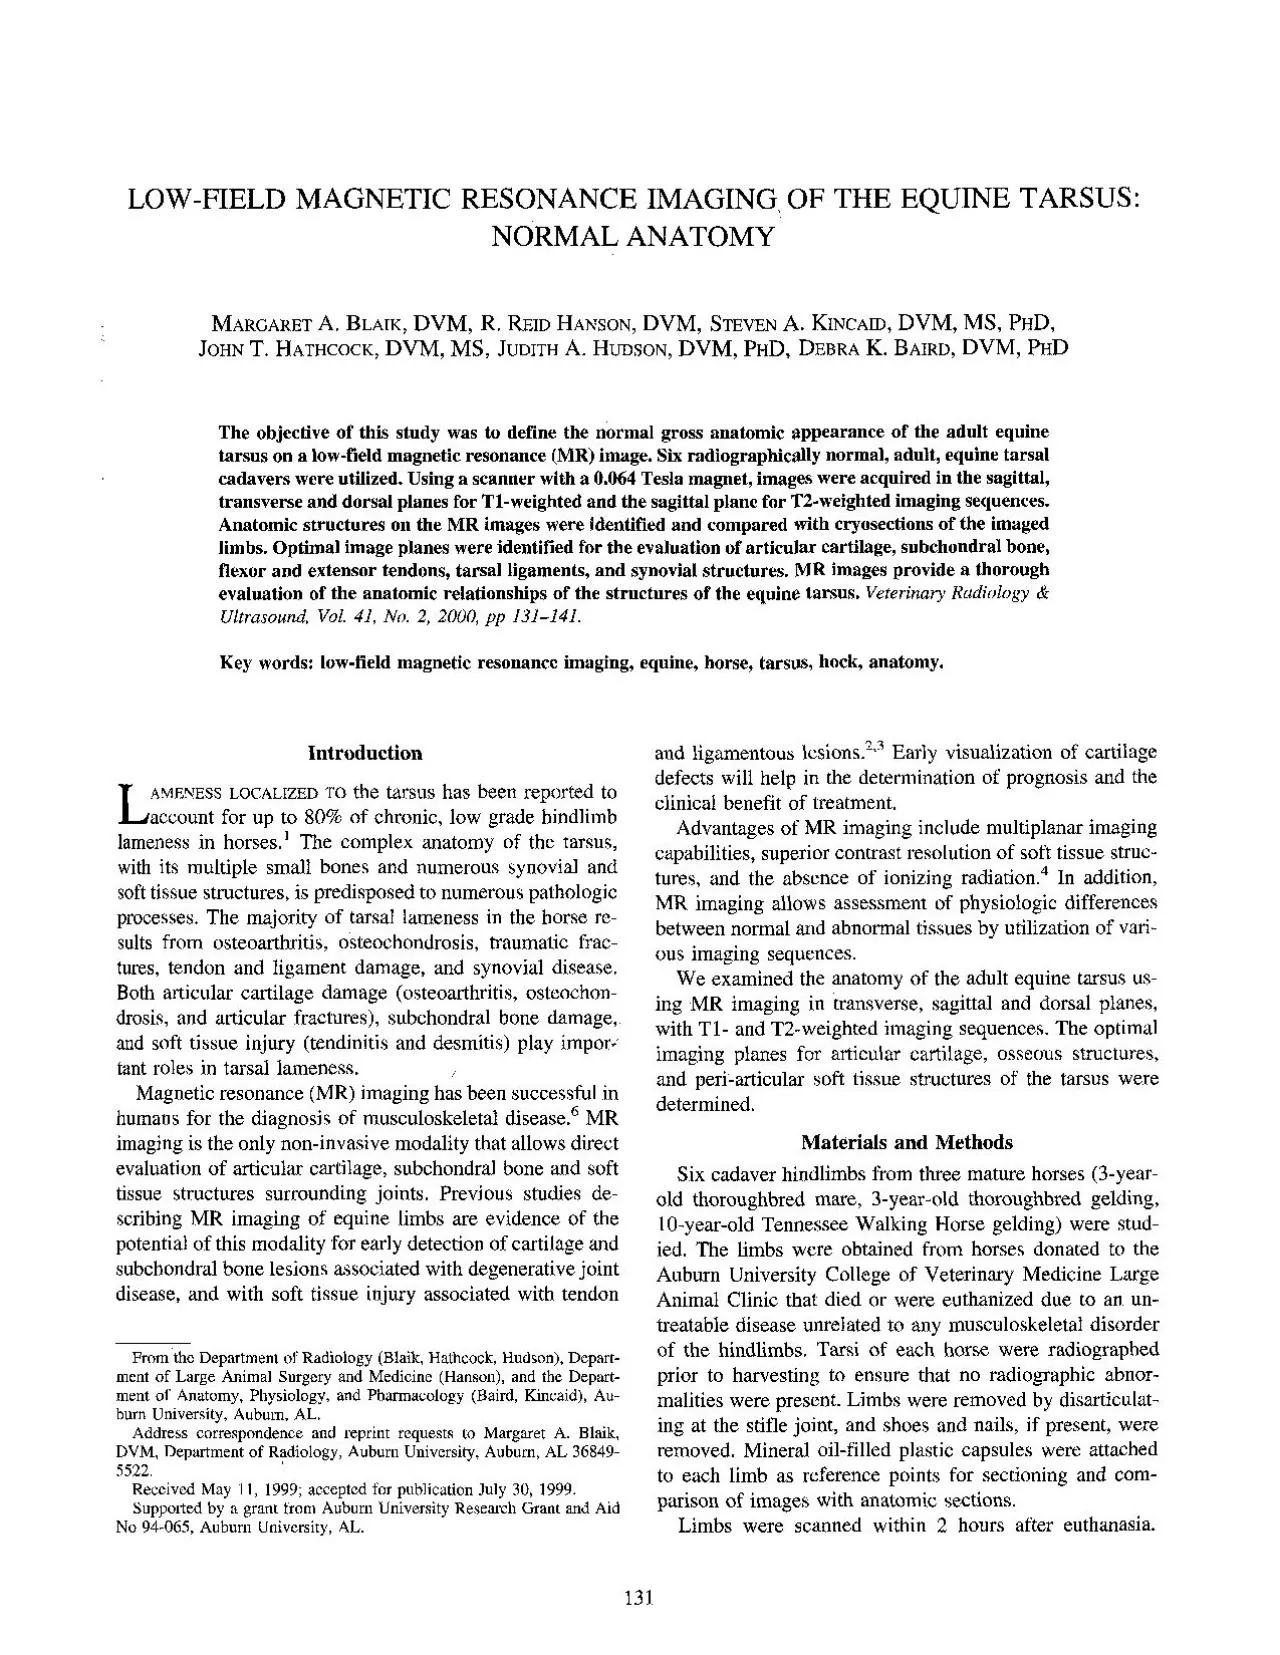
LOW-FIELD MAGNETIC RESONANCE IMAGING EQUINE TARSUS: NORMAL ANATOMY study was to define Acquiring T1-Weighted Transverse, T2-Weighted Sagittal Adult Equine Tarsus. 1 -Weighted Slice Thickness Flip Angle View (cm) Resolution (mm pixel) placed in extended position solenoidal human extremity coil imaged with Tesla magnet.* imaging protocol consisted locator image, followed three dimensional Fourier trans- form (3DFT) T1-weighted transverse plane gradient echo "Access, Toshiba San Francisco, images, dorsal plane 3DFT gradient echo images, sagittal plane 3DFT T1-weighted gradient echo images, plane 2DFT T2-weighted images (Table After imaging, the limbs were frozen at -18 in the same position they had been imaged with the mineral capsule markers still place. The limbs were into 4 sections corresponding the three image planes (three dorsal, two transverse one sagittal). comparison to FIG. 1. (A) Lateral plane T1-weighted image gross anatomic section the level the lateral trochlea b) subchondral d) synovium trochlea tali; plantar ligament; h) tendon long digital digital flexor muscle; k) fourth tarsal bone; central tarsal bone; m) third tarsal bone; n) metatarsal muscle; p) tendon peroneus tertius muscle; q) common calcaneal tendon. Mid-sagittal plane T1-weighted image and section. a) marrow the tibia; digital flexor muscle; central tarsal bone; third tarsal bone; p) tendon peroneous tertins calcanean tendon; s) tendon perficial digital flexor; t) digital flexor; tali; w) talus; medial tendon tibialis cranialis m
uscle (cunean tendon); caudal aspect intermediate ridge tarsocmral synovium; aa) calcanean bursa; bb) tendon sheath deep digi- tal flexor (tarsal sheath). Medial sagittal plane T1-weighted MR image and anatomic section at the the medial trochlea the talus. a) marrow tibia; i) digital flexor central tarsal bone; m) third tarsal bone; p) tendon peroneus tertius mon calcanean tendon; superficial digital flexor; sustentaculum tali; w) talus; tarsocrural synovium; aa) calcanean bb) tendon sheath digital flexor (tarsal sheath); fused first second tarsal bone. Cranial dorsal plane T1-weighted gross anatomic section. a) tibia; e) lateral ridge trochlea tali; central tarsal bone; tarsal bone; r) cranial aspect intermediate ridge cochlea; cc) tarsal bones; lateral digital extensor collateral ligaments lateral collateral ligaments hh) dorsal ii) metatarsal IV; lateral malleolus medial malleolus trochlea tali. anatomic struc- this study are formatted as sequential image and corresponding gross anatomic section. Anatomy texts were consulted for the identification and confirmation various anatomic dorsal, and transverse T1-weighted images weighted images shown. T1-weighted sagittal plane ages begin laterally (Figs. dorsal plane images begin craniodorsally (Figs. transverse images begin proximally (Figs. T2-weighted images are shown in the sagittal plane and also begin laterally (Figs. 10 and 11). and trabecular bone (presumably to fat content within the bone marrow) a bright white indicating high signal intensity. Corti
cal and subchon- dral bone had a black to low signal intensity, allowed for clear differentiation between subchondral or cortical bone from trabecular bone. Tendon had low signal appeared dark gray black. Muscle intermediate signal intensity and appeared in various gray. Articular cartilage appeared as a single layer homogenous intermediate high signal intensity adja- the low signal subchondral bone at articular in- terfaces. Synovial tissue and synovial fluid appeared dark weighted images provide excellent anatomic detail the peri-articular structures. the T2 weighted images, the synovium signal intensity, whereas cartilage subchondral bone appeared dark due to low signal intensity. bone interface weighted images was difficult establish. Trabecular bone intermediate signal inten- sity, and ligamentous structures were signal intensity. The images allowed better visual- the synovium; however, the detail the images was not as clear as in T1-weighted images. 2 lists the characteristic appearance various normal tissues on and T2-weighted MR images. -weighted imaging planes provided useful infor- mation for evaluation osseous structures. dorsal planes allowed evaluation articular alignment, 6 LOW-FIELD MAGNETIC RESONANCE IMAGING EQUINE TARSUS: NORMAL ANATOMY image and anatomic section. trochlea tali; digital flexor muscle; central tarsal bone; m) third tarsal bone; caudal aspect fused first tarsal bones; medial collateral ligaments tarsus; gg) lateral collateral ligaments tarsus; mm) proximal tubersity medial r
idge trochlea tali. the transverse plane provided the detailed evalu- the smaller tarsal bones. Specific sites interest were more clearly defined certain planes. the talus were well visualized in The contour these ridges articular cartilage non-weight bearing aspect the sagittal images (Figs. the obliquity these ridges, was not follow a continuous line articular cartilage along a single sagittal plane. In dorsal transverse planes, articular cartilage the trochlear ridges was more clearly delineated (Figs. The articular cartilage surface distal tibia had a similar appearance could be visualized all three planes. Other important osseous landmarks, in- cluding both the lateral and medial tibia and the proximal distal tuberosities the talus, were better visualized in the dorsal plane images (Figs. sustentaculum tali the calcaneus imaged in the transverse plane (Figs. Its relationship to the tarsal best evaluated cross section. The transverse plane provided the complete visualization the mul- tiple small intertarsal articulations, and allowed the integrity the small tarsal bones (Figs. ever, care must be taken the T2-weighted images (Figs. appeared as a bright white signal within articular spaces and surrounding tendons within the sheathed portions. The plantar portion was well in the the T1-weighted images as and low The transverse sagittal planes were best for evalua- the tendinous ligamentous structures surround- the equine tarsus (Figs. The linear fiber these structures seen best in the sagittal plane. the t
ransverse extensor tendons, their as- their relationships to osseous struc- were well intensity and peared dark. in the deep digital flexor tendon the more transverse images (Figs. Transverse plane gross anatomic section the level distal tibia. a) marrow tibialis cranialis muscle; peroneus tertius muscle; superficial digital flexor; t) tuber calcanei; aa) calcaneal bursa; nn) tendon lateral digital extensor muscle; medial head pp) tibial and saphenous vein; cranial tibial vessels. This most likely represents the presence fibers in these proximal sections. images provided the best resolution anatomic structures; however, con- trast between the high signal intensity sheaths and low signal intensity tendons provided weighted images made it easier to define boundaries. Specific tendinous and ligamentous structures were best defined in different planes. superficial digital flexor well visualized in transverse and sagittal plane T1-weighted images as signal intensity coursing along the plantar aspect the limb. However, was not identified in the dorsal images obtained. Trans- verse plane T1-weighted images provided the plete evaluation the deep digital flexor tendon (DDFT) and its associated tarsal sheath as it, passed over the plan- taromedial aspect the tendon was evident in the sagittal transverse plane images where the tendon crossing the sustentaculum tali (Figs. 7). The T1-weighted images also allowed adequate visualization, and the sagittal T2-weighted images provided excellent con- trast between the DDFT
the synovial fluid and tissues the tarsal sheath 10). The, long and lateral digital extensor tendons were clearly evaluated in the trans- verse plane T1-weighted images as round oval low signal intensity structures that passed over the dorsal and lateral the tarsus, respectively (Figs. The sagittal less than optimal these structures. The medial tendon the tibialis cranialis muscle (cunean tendon) seen in cross section on the mid-sagittal image as oval structure signal intensity situated on the dorsal aspect the tarsus (Fig. 2). This tendon was not clearly visualized. Ligamentous structures importance include the medial and lateral collateral ligaments and the long plantar liga- ment. Collateral ligaments are separated into short and long divisions; however, these separations were not known origin insertion points) on the gross images. Collateral ligaments were best evaluated the T1-weighted transverse plane images; however, they were incompletely visualized in the T1-weighted dorsal plane images and not visualized all in the MAGNETIC RESONANCE Transverse plane image and anatomic section the trochlear ridges the talus. lateral ridge h) tendon the long digital extensor; p) tendon peroneus tertius muscle; superficial digital deep digital flexor, medial collateral ligaments gg) lateral collateral ligaments medial ridge trochlea tali; proximal tuberosity talus; nn) tendon digital extensor pp) tibial nerve and saphenous vessels; deep peroneal and cranial tibial vessels. images (Figs. long plantar ligament (LPL)
thoroughly evaluated in the T1-weighted trans- plane as rounded structure signal intensity originated on the plantar aspect the calcaneus and distally to the proximal fourth metatarsal bone T1-weighted sagittal plane useful for relationship between the and calcaneus long plantar ligament was not included in the T1-weighted dorsal plane images. Neurovascular Structures Several neurovascular structures were visualized in the saphenous vessels and cranial tibial vessels seen in transverse plane images as small, focal, white areas high signal intensity in both images that were plantar to the DDFT dorsal to trochlear ridges talus, respectively (Figs. metatarsal artery imaged in the dorsal plane discrete circular focus high signal intensity located just lateral to the distal intertarsal tive nerves, could not differentiated as distinct structures from the vessels. equine tarsus is well suited for magnetic resonance imaging. Its narrow linear profile and minimal soft tissue coverage allows for the close placement surface radio- frequency receiver coils. this study, 0.064 Tesla magnet used to obtain and T2-weighted magnetic resonance cadaver tarsi. Our goal to obtain good quality the peri-articular soft tissue structures and articu- lar surfaces for comparison with gross anatomic sections. This required adequate signal-to-noise ratio Imaging time, although primary factor, was recorded since horses undergoing MRI at institution will general anesthesia and timely imaging would The continuum signal intensities seen in
this study are similar to those previously reported for low-field images provided the greatest anatomic detail, improved signal-to-noise ratio (SNR). articular tendinous ligamentous structures were well defined in both the T2-weighted images, with the T2-weighted images providing excellent visualization Transverse plane image and proximal row tarsal bones. g) h) tendon the long tarsal bone; p) tendon peroneus tertius muscle; superficial digital digital flexor; tarsus; nn) tendon lateral digital medial head peroneal nerve and cranial tibial vessels. Transverse plane anatomic section at the distal row bones. g) plantar ligament; h) tendon long digital fourth tarsal third tarsal bone; digital flexor; flexor; cc) fused first and second tarsal bones; nn) tendon lateral digital extensor; medial head peroneal nerve and cranial tibial vessels. MAGNETIC RESONANCE TARSUS: NORMAL ANATOMY T2-weighted MR image. a) marrow g) long plantar flexor muscle; cranialis muscle; p) tendon the peroneus tertius s) tendon the superficial t) tuber talus; x) medial tendon cranialis muscle tibia; b) subchondral bone tarsocrural joint; p) cartilage the tendon sheaths. Articular cartilage well visualized on the T1-weighted images as single homogenous layer high to intermediate signal intensity immediately adjacent of low signal intensity subchondral bone single plane was not adequate for complete evaluation the articular cartilage the troch- lear ridges the talus. Signal volume averaging curved surfaces may have contributed to this ne
r sections through the area have reduced this effect but would have also reduced the signal resulting in lower Fat and bone marrow high signal intensity images because their large number highly mobile hydrogen protons, images were useful for evaluating high signal intensity bright white these images. Like the T1-weighted images, T2-weighted images excellent definition ligamentous structures but T2-weighted im- ages also provided excellent visualization tendon sheaths other synovial structures. However, ages had less resolution than the -weighed images their lower SNR. Although the reduced resolution T2-weighted images less optimal for studying anatomic structures, they may useful in disease processes. T2-weighted images, greater signal production comes tissues with longer relaxation times. Consequently, relaxation time abnormal tissues longer because more mobile hydro- protons associated with tent (i.e., edema, the three imaging planes contributed formation concerning and soft tissue structures tarsus. However, certain anatomic structures were better vi- 2. Appearance Tissues on and T2-Weighted Low-Field Magnetic Resonance Images SubchondralKortical Bone Black Articular Cartilage Light Gray Variable Gray Dark Gray to Gray to Dark Gray FIG. 12. Close up view tibia; b) subchondral v) sustentaculum tali; w) talus. Articular between arrowheads. one or more planes. Additionally, the use oblique reconstruction techniques been useful delineating structures, especially small tarsal bones where images often contain
ed slices through both distal rows Cadaver limbs are commonly this study very simi- previously reported studies using primary difference between live limbs is signal intensity Vascular struc- this study appeared high signal intensity which that recorded in live animals. Blood flow vessels normally prevents good signal acquisition, therefore, vascular structures live animals low signal intensities generated other tissues study should be similar vivo imaging. relaxation times existed, should not have affected im- age quality enough anatomic struc- Magnet configuration (open versus tunnel designed limits the size the patient and be imaged. Open magnets allow larger patients; however, these magnets field strength. field strength implies a lower signal- ratio that results or longer imaging times a higher strength quality is a debatable issue, because contrast-to-noise ratio (CNR), the ratio of difference between background noise, tends be higher lower field strengths." generally be- lieved that image quality clinically relevant parameter type from another (i.e., general lesion Low-field magnets offer additional ad- a lower fringe field that can accommodate an- esthetic equipment magnets have lower start-up costs, require less not need cryogens." addition, it its probable that portable magnets will use in industry. Inevitably, these of low field strength. of these make low-filed magnets attractive to the veterinary profes- is important that normal low-field anatomic structures be recog- indicate that low-field us
ed to anatomic components has the potential become a useful imaging tool orthopedic disease. and study such as teochondrosis, tendinitis and and intraarticular fractures involving tarsal Additional studies utilizing these pathologic condi- RJ, Hodgson DR. Hindlimb Abnormalities. Rose and Equine Practice. Philadelphia: W.B. Saunders, 1993: 112. 2. Matrinelli Magnetic resonance imaging degenerative joint diagnostic techniques. Equine North America 1994;32:291-311. Crass JR, Genovese RL, Render JA, Bellon nance, ultrasound and histopathologic correlation tendon injuries. Ultrasound 1992;33:210-216. 4. Peterfy CG, Linares resonance imaging musculoskeletal system. Radiologic Clinics NORMAL ANATOMY R, Schummer Wille KH. domestic animals The locomotor domestic mammals. New York: Springer-Verlag. Getty R. Equine osteology. In: Getty R. Sisson and domestic animals, WB Saunders, Equine syndesmology. R. Sisson and Gross- the domestic animals, ed. Philadelphia: Saunders, 1975. myology. In: Getty R. Sisson and Grossman’s domestic animals, WB Saunders, Rnmph PF, Kincaid field magnetic resonance imaging of the Ultrasound 1998;39:87-97. 10. Rothschild L et al. MR imaging a 0.064-T permanent magnet. Radiology 11. Rothschild Gronemeyer DHW, D’Amonr P. Midfield and magnetic resonance imaging Magn Reson Imag 12. Kramer DM, Guzman RJ, Carlson Kaufman L. low field 13. Chakers DW, Schmalbrock P. In: Chakeres DW, Schmalbrock P. Fundamentals imaging. Baltimore: Williams and Wilkins, 1992. Rutt, BK, Lee field strength on