
Lessons from Recent CRBSpecific Scientific Studies Upper Colorado River Commission CRWUA Las Vegas NV December 11 2019 Brad Udall Senior ScientistScholar Colorado State University BradleyUdallcolostateedu ID: 814936
Download The PPT/PDF document "Water and Climate in the 21st Century:" is the property of its rightful owner. Permission is granted to download and print the materials on this web site for personal, non-commercial use only, and to display it on your personal computer provided you do not modify the materials and that you retain all copyright notices contained in the materials. By downloading content from our website, you accept the terms of this agreement.


Slide1
Water and Climate in the 21st Century: Lessons from Recent CRB-Specific Scientific StudiesUpper Colorado River CommissionCRWUA Las Vegas, NVDecember 11, 2019
Brad Udall Senior Scientist/ScholarColorado State UniversityBradley.Udall@colostate.edu
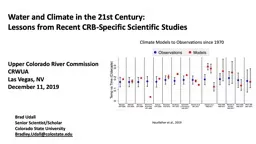
Hausfather
et al., 2019
Climate Models to Observations since 1970
Slide2Talk Outline Climate Change in 20198 Key CRB Climate Change Studies since 2011Lower Basin Flow Loss EvidenceDoing more than just adaptingConclusions
Slide3Notable 2019 Climate Change Events2019 2nd Warmest in Recorded HistoryAlaska Record Temperatures way above normalUS only place cool globallyMidwest Floods
2 European Heat Waves: Nimes 114 °FJohn Martin Reservoir in Colorado 112 °FHuge Melt event on Greenland Ice sheetImelda 40 Inches Rain in HoustonArctic Sea Ice Record LowsVenice FloodingCalifornia Fires (yet again)CRB Flash Drought Late WY 2019Changing Politics Nationally and Internationally
Slide4Source: Adapted from Udall &
Overpeck, 2017Data thru September 2019Current Colorado River Reservoir, Flow, Precipitation and Temperatures in Long-Term Context
Powell + Mead Contents 2000 to 2019
Thru August 1, 2019
Slide58 Key CRB Climate Change Studies Last 8 YearsUnderstanding Uncertainties in Colorado River StreamflowsVano et al., 2014The Importance of Warm Season Warming to Western US streamflow changes
Das et al., 2011Increasing Influence of Air Temperature on Upper Colorado River StreamflowWoodhouse, 2016The Colorado River Hot Drought and Implications for the FutureUdall & Overpeck, 2017On the Causes of Declining Colorado River FlowsXiao, Udall and Lettenmaier, 2018Climate-Driven Disturbances in the San Juan River sub-basin of the Colorado RiverBennett et al., 2018Causes for the Century-Long Decline in Colorado River Flow Hoerling
et al., 2019Chris Milly new study on Temperature SensitivityUnder Review, 2020Note: many others, but I have elected to focus on these 8 that deal specifically with temperature increases and flow reductions / implications
Slide6Introduced 2 key concepts (among many other things)
Precipitation ElasticityRatio of the change in runoff to a 1% change in precipitation
Approximately 2 to 3 (unitless number)2 means 1% change in precip means 2% change in runoff
Temperature Sensitivity
Reduction in flow (as %) to 1°C temperature riseApproximately -3 % to -10 % / °CAlways negative (implies flow loss)
With 1°C rise, -5%/C sensitivity means 5% flow loss
Slide7Hydrology Model Study over 4 Big Western River BasinsWarming applied by single month/season
CRB most sensitive to annual warming: -16% flow loss with 3C warming (implies ~5%/°C loss)Summer Warming most important.Affects flow that summer and following summer via soil moisture deficits.
Slide8Temperature can be a major flow driver (normally we just think about precipitation)
Since 1988 flows have been less than expected given winter precipitationWarm temperatures exacerbated modest precipitation deficits in the Millennium Drought- 2016
Slide9Precipitation declines only partially explain flow loss
~ 66% of the loss
Temperature increases explain the remainder
~ 33% of the loss
Why?
More Evaporation
Thirstier Atmosphere
Temperature-Induced Losses
Now = ~6%
2050 = ~20%
2100 = ~35%
Udall and
Overpeck
, WRR, 2017
- 2017
Slide104 Key Basins (Green + Blue) produce ~55% of all runoff
Findings~50% of Decline due to Higher Temperatures
More Evaporation of all kinds
~50% of Decline due to Changing Precipitation PatternsShift to less productive basins
Hydrology Model-based Study using Historical DataRun model with and without temperature change
Slide1120% Flow Decline over last century50% of that due to climate change (i.e. 10% flow loss)
Climate models show 1.2°C warming and 3% precip declinePrecipitation Elasticity of ~ 2Temperature Sensitivity of ~ -2.8% to -7% /°CWarming is 1/3 of the decline (~3 % of flow)
Precipitation Loss is 2/3 of decline (~7 % of flow)
What’s New: 1. Attribution of 1981- 2010 precipitation decline to climate change
2. Lower Temperature Sensitivity
Hoerling
,
Barsugli
,
Livneh
,
Eischeid
, Quan, Badger, 2019
With Climate Change
Without Climate Change
Precipitation
Runoff
Temperature
Climate Model Results 1981-2010
Sophisticated Multi-model Multi-Ensemble GCM Effort with and without added greenhouse gasses
Slide12Wildfire, Drought, Pests expected to change forests significantly – lots of shrubs to replace treesFew studies quantify both climate change and land cover disturbance‘Robustly calibrated’ VIC ModelEnd-century streamflow is at least 6-11% lower than climate change only
January, 2018
Slide13Chris Milly’s (USGS – NOAA GFDL Lab) new study Lead Author of ‘Stationarity is Dead’Effort is ‘In Review’ at an important journalAttempt to ‘reconcile’ the wide range of CR Temperature SensitivitiesAnswer: -9.3 %/°C !Mid-century flow loss (only T)
-14% to -26% RCP4.5-19% to -31% RCP8.5Mid-century flow loss (both T&P)+5% to -24%+3% to -40%Key Finding: As shiny, reflective snow declines, absorbed radiation goes up (2/3 of the cause)
Slide14Emerging Evidence of Lower Basin Inflow Loss
Unpublished WorkLower Basin inflows from 1980 show strong downward trendsTotal Loss ~ 250,000 af/year (~ 16% of total inflow)
Makes Structural Deficit Worse
Loss is from the LB Rivers, not channel losses (Paria, LCR, Virgin, Bill Williams)
Source: Reclamation Natural FlowsAnalysis: Udall
Lower Basin Inflows (Rivers + Gains/Losses)
4
maf
3
maf
2
maf
1
maf
4
maf
3
maf
2
maf
1
maf
Slide15Adapting is not enoughUS now 2nd largest emitter on annual basisUS largest cumulative emitter by farUS per capita emissions 2x China, Europe, 4x IndiaEmissions continue to rise but solution requires net zero emissions ASAP
Enormous Gap between 2°C Target and current path (~3.2 °C ) (CRB / Land Higher)World Leadership Desperately NeededWithdrawing from the only international agreement (Paris) is wrongInaction will be increasingly expensive
Russia
Japan
China
EU-28
Global
India
USA
CO2 Emissions by Country
UN Emissions Gap Report, 2019
Slide16We know how to solve this…Price on CarbonImportant but only a pieceTax CreditsInvestmentsProduction (e.g. wind)Renewable Portfolio StandardsResearch and Development $
Technologically possible solutions now appearing for difficult to de-carbonize sectors, e.g. aviation.
Slide17Conclusions
Concepts of Temperature Sensitivity and Precipitation Elasticity are usefulAllow us to separate two important changesWide Variety of recent CRB studies point to declining flowsUp to half of the current 20% decline is climate changeTwo Cumulative Causes of Flow DeclinesTemperature (most studies)Precipitation (Hoerling
et al, 2019)Two studies explicitly quantifies future lossesBut Implicit in all studiesTemperature Impacts Carry Over from Year to YearSoil Moisture Memory Important
Some emerging evidence for Lower Basin Flow LossFirst Place we’d expect to see lossesIn the face of a planet changing event, adapting is not enough.We have to address the root cause of these changes
Runoff is partly lagged, mimics
first-in – first-out buffer
A depleted buffer reduces runoff at a later time
Old Water
New Water
Slide18Slide19Bradley.udall@colostate.edu@bradudall
Slide20Russia
Japan
China
EU-28
Global
India
USA
Slide21Slide22