
α and AMPK Food Biomedical Science Lab Yaoyao Jia Sep 23 th 2014 3 rd International Conference and Exhibition on Nutrition amp Food Sciences September 2325 2014 Valencia Spain ID: 490575
Download Presentation The PPT/PDF document "Cyanidin-3-O-glucoside ameliorates lipid..." is the property of its rightful owner. Permission is granted to download and print the materials on this web site for personal, non-commercial use only, and to display it on your personal computer provided you do not modify the materials and that you retain all copyright notices contained in the materials. By downloading content from our website, you accept the terms of this agreement.


Slide1
Cyanidin-3-O-glucoside ameliorates lipid and glucose accumulation in C57BL/6J mice via activation of PPAR-α and AMPK
Food Biomedical Science Lab.Yaoyao JiaSep 23th, 2014
3rd International Conference and Exhibition onNutrition & Food SciencesSeptember 23-25, 2014 Valencia, SpainSlide2
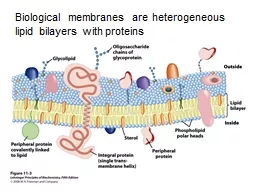
characteristics
Background
Antioxidant
Anti-inflammatory
effects
↓ Cardiovascular Diseases
↓ Cancer
↓ Obesity
↓ Diabetes
Grapes
Berries
CherriesApplesPlums Red cabbage Red onion
Natural organic pigment
functions
objectives
To investigate the effects and molecular mechanisms of cyanidin-3-O-glucoside (C3G)
?
Molecular targetSlide3
Background
* RXR: retinoid X receptor PPRE: peroxisome proliferator hormone response elements
PPRE
Nucleus
ligands
Peroxisome proliferator-activated receptors (
PPAR
s
):
Nuclear receptors
Containing
3 isoforms: PPARα,
PPARγ
,
PPARδ/β
PPARα:
A major regulator of lipid metabolism in the liverFatty acid uptake (fatty acid transport)Fatty acid utilization (fatty binding and activation)Fatty acid catabolism (peroxisomal and mitochondrial fatty acid β-oxidation)
Ketogenesis
Triglyceride turnoverLigands:Synthetic ligands include the fibrate drugs (hyperlipidemia) Endogenous ligands include fatty acids and various fatty acid-derived compounds
AMP-activated protein kinase (AMPK):
An
enzyme plays a role in cellular energy homeostasis Consists of three proteins (subunits): α
, β, and γ Three subunits together make a functional
enzyme
AMPK:
Stimulate:
Fatty acid
o
xidation
Ketogenesis
Inhibit:
Lipogenesis
Triglyceride synthesis
Gluconeogenesis
α
β
γ
AMPK
P
Thr172
Lipid metabolism
Glucose metabolism
AMP:ATP
ratio
↑
Exercise
(
muscle stimulation
)
Berries containing C3G regulate lipid and glucose metabolismsSlide4
Experimental design
Molecular targets of C3GBIAcore Surface plasmon
resonance (SPR)Time resolution-fluorescence resonance energy transfer (TR-FRET) coactivator assay
AMPK activity assay
Physiological relevance
& molecular mechanisms of C3G
Body & organ weight measurement
Plasma lipid, glucose, insulin & hormone measurement
Liver & adipose tissue histology & analysis
Liver lipid concentration measurement
Oral glucose tolerance test (OGTT)
Insulin tolerance test (ITT)Autophagy pathway analysisqPCR & immunobloting
Animal/cell experimental design
HFD: High fat diet (45%)
FF: 100 mg/kg body weight of
fenofibrate
(FF)
C3G: 100 mg/kg body weight of cyanidin-3-O-glucoside (C3G)
SacrificeSample (plasma & organs) collectionHepG2 cells
Lipid-loading for 24 h
Treatment with C3G for 24 h
Lipid contents
Fatty acit oxidation/synthesisAutophagy analysis
Gluconeogenesis Slide5
A
B
D
C
K
D
values and EC
50
values of C3G and positive controls
C3G
Positive controls
PPAR
α
PPAR
γ
PPAR
δ
PPAR
α
PPAR
γ
PPAR
δ
GW7647
TT
GW0742
SPR
456
nM
1.36 μ
M
4.96 μ
M
13.2
nM
377
nM
102
nM
TR-FRET
1126
nM
10.8 µM
31.05
μ
M
26.9
nM
82.3
nM
10.25
nM
C3G induces PPAR
α
coactivator
activity via direct binding to PPAR
α
K
D
, the
equilibrium dissociation constant ('binding constant
');
EC
50
, Half
maximal effective
concentration
Surface Plasmon Resonance (
BIAcore
SPR)
Time resolution-fluorescence resonance energy transfer (TR-FRET)
coactivator
assay
C3G
C3G
C3GSlide6
A
B
C3G induces AMPK
α
1
activity
via direct interaction with AMPK
α
1
EC
50 (nM)A1/B1/G1
A2
/B1/G1
A-769662
262
457C3G
599
1010α
β
γ
AMPK
A-769662
C3G directly activates PPAR
α
and AMPKSlide7
C3G reduces lipid accumulation in mouse livers & hepatocytes
A
B
D
C
AST, Aspartate Aminotransferase;
ALT, Alanine AminotransferaseSlide8
B
A
D
C3G induces hepatic fatty acid oxidation and
ketogenesis
while decreases fatty acid synthesis via regulation of PPAR
α
& AMPK
α
1
C
E
ACC, acetyl-CoA carboxylase
CPT1
,
carnitine
palmitoyltransferase
1;
LPL, lipoprotein lipase;HMGCS2,
3-hydroxy-3-methylglutaryl-CoA synthase 2
C3G reduces lipid accumulation via increases fatty acid oxidation,
ketogenesis, whereas inhibits fatty acid synthesisSlide9
C3G induces phosphorylation of AMPK thus blocks the mTOR-S6K1 axis
mTOR
, mammalian target of
rapamycin
; S6K1, P70-S6 Kinase 1
p-mTOR
T2446
m
TOR
p-S6K1
T389
S6K1
p-AMPK
T172
AMPK
HFD
FF
C3G
β
-actinSlide10
C 1 10 50
LC3I
LC3II
β
-actin
GW7647 C3G (µM)
HFD FF C3G
α
-tubulin
LC3I
LC3II
A
B
C
D
C3G induces hepatic autophagy pathway
STF, STF-62247
C3G reduces lipid accumulation via activates hepatic autophagy pathwaySlide11
A
B
C
D
C3G reduces plasma glucose & insulin concentrations and improves insulin sensitivity
HOMA-IR, Homeostatic Model Assessment - Insulin Resistance;
AUC, Area under the curveSlide12
A
B
C3G reduces gluconeogenesis
CE-TOF &
QqQMS
:
Selected component
analysisSlide13
p-AMPK
AMPKp-CRTC2
CRTC2p-HDAC5HDAC5
HFD
FF
C3G
β
-actin
C3G reduces gluconeogenesis via increases plasma
adiponectin
concentration & inhibits FOXO and CREB activity
A
B
FOXO1,
Forkhead
box protein O1; CREB,
cAMP
response element-binding protein;
HDAC5, Histone deacetylase 5; CRTC2, CREB regulated transcription coactivator 2; PEPCK, Phosphoenolpyruvate
carboxykinas; G6Pase, Glucose 6-phosphatase
C
PEPCK
G6Pase
CRTC2
HDAC5
X
C3G reduces glucose accumulation via inhibits hepatic gluconeogenesisSlide14
Organ weight of mice
HFD
FF
C3G
Epididymal
Fat (g)
2.45
±
0.16
a
2.43
±
0.26
a
2.41
±
0.19
a
Visceral
Fat (g)
1.67
±
0.11
a
0.71
±
0.09
bc
0.98
±
0.19
c
Perirental
Fat (g)
1.52
±
0.10
a
1.02
±
0.09
bc
1.19
±
0.15
ac
Total White Adipose Tissue (WAT, g)
5.63
±
0.20
a
4.16
±
0.42
bc
4.58
±
0.52
ac
Brown Adipose Tissue (BAT, g)
0.29
±
0.03
ab
0.22
±
0.03
a
0.36
±
0.04
b
WAT/BAT
20.81
±
2.07
a
19.90
±
1.52
a
12.90
±
0.87
b
Skeletal
M
uscle
(g)
0.68
±
0.04
a
0.55
±
0.08
a
0.76
±
0.06
a
WAT/Skeletal Muscle
8.43
±
0.49
a
7.98
±
0.58
ab
5.85
±
0.80
b
Liver (g)
1.59
±
0.13
a
1.46
±
0.05
a
1.37
±
0.17
a
Liver/Body weight
0.036
±
0.002
a
0.040
±
0.001
a
0.034
±
0.003
a
C3G reduces body weight, visceral fat weight & adipocyte size
A
C
BSlide15
A
B
C3G increases energy expenditure via induces thermogenesis gene expressions in brown adipose tissue (BAT)
PGC-1
α
, Peroxisome proliferator-activated receptor gamma
coactivator
1-alpha;
UCP1
, uncoupling protein 1
C3G reduces body weight via increases energy expenditure and thermogenesis in brown adipose tissueSlide16
Conclusion
C3G
C3G
Fatty acid oxidation
Energy
expenditure
Autophagy
Gluconeo
-genesis
Fatty acid synthesis
Insulin
sensitivity
↓ Body
weight, visceral
fat
weight & adipocyte size
↓
Lipid accumulation in
liver
↓
Glucose & insulin concentrations in plasma
Improves insulin sensitivity
↓
A
therosclerosisSlide17
Acknowledgement
Food Biomedical Science Lab.Supervisor Prof. Sung-Joon
LeeFBS lab. Members
Ji
Hae
Lee
Chunyan
Wu
Bobae
kim
Ji Ah KimSoyoung KimBoram Mok
Rural Development Administration of Korea
Ewha
Women’s University
Prof. Young-Suk Kim
Minyoung SoSlide18
Thank you for your attention!