
MCH Hemoglobin MCHC Total bilirubin Triglyceride Platelet count Creatinine Smoking Fibrinogen Homocysteine Albumin CeD MCV MCH RBC distribution width Hemoglobin Triglyceride ID: 1009534
Download Presentation The PPT/PDF document "MCV RBC distribution width" is the property of its rightful owner. Permission is granted to download and print the materials on this web site for personal, non-commercial use only, and to display it on your personal computer provided you do not modify the materials and that you retain all copyright notices contained in the materials. By downloading content from our website, you accept the terms of this agreement.


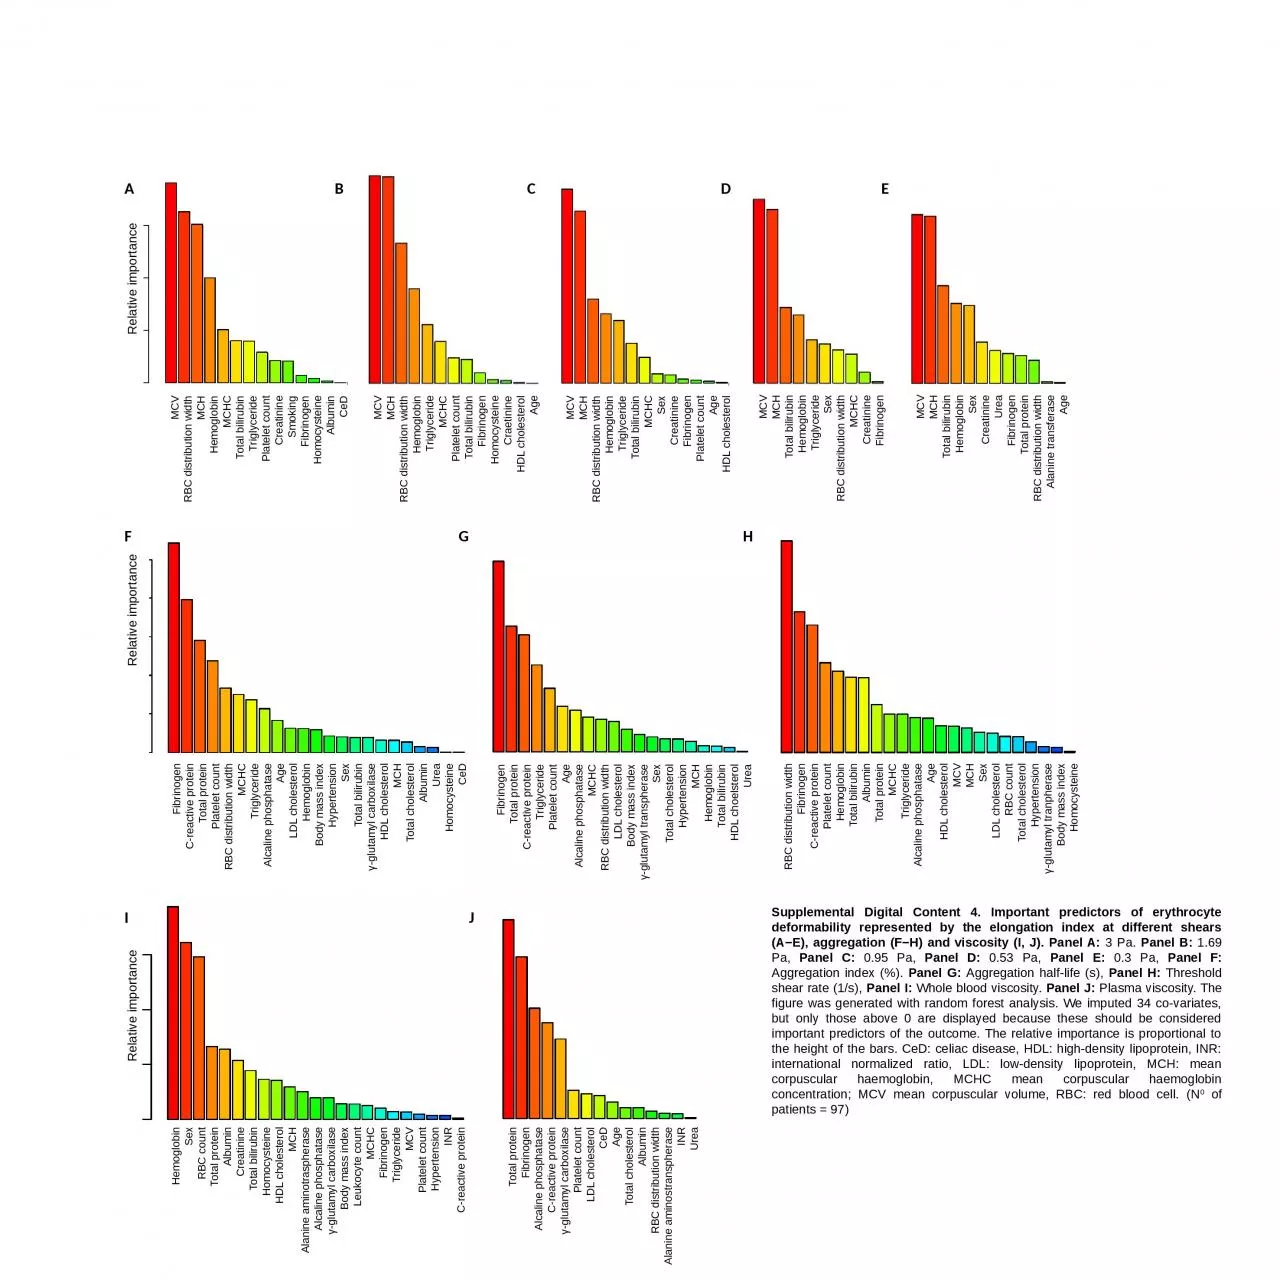
1. MCVRBC distribution widthMCHHemoglobinMCHCTotal bilirubinTriglyceridePlatelet countCreatinineSmokingFibrinogenHomocysteineAlbuminCeDMCVMCHRBC distribution widthHemoglobinTriglycerideMCHCPlatelet countTotal bilirubinFibrinogenHomocysteineCraetinineHDL cholesterolAgeMCVMCHRBC distribution widthHemoglobinTriglycerideTotal bilirubinMCHCSexCreatinineFibrinogenPlatelet countAgeHDL cholesterolMCVMCHTotal bilirubinHemoglobinTriglycerideSexRBC distribution widthMCHCCreatinineFibrinogenMCVMCHTotal bilirubinHemoglobinSexCreatinineUreaFibrinogenTotal proteinRBC distribution widthAlanine transferaseAgeRelative importanceABCDESupplemental Digital Content 4. Important predictors of erythrocyte deformability represented by the elongation index at different shears (A−E), aggregation (F−H) and viscosity (I, J). Panel A: 3 Pa. Panel B: 1.69 Pa, Panel C: 0.95 Pa, Panel D: 0.53 Pa, Panel E: 0.3 Pa, Panel F: Aggregation index (%). Panel G: Aggregation half-life (s), Panel H: Threshold shear rate (1/s), Panel I: Whole blood viscosity. Panel J: Plasma viscosity. The figure was generated with random forest analysis. We imputed 34 co-variates, but only those above 0 are displayed because these should be considered important predictors of the outcome. The relative importance is proportional to the height of the bars. CeD: celiac disease, HDL: high-density lipoprotein, INR: international normalized ratio, LDL: low-density lipoprotein, MCH: mean corpuscular haemoglobin, MCHC mean corpuscular haemoglobin concentration; MCV mean corpuscular volume, RBC: red blood cell. (N0 of patients = 97)FibrinogenC-reactive proteinTotal proteinPlatelet countRBC distribution widthMCHCTriglycerideAlcaline phosphataseAgeLDL cholesterolHemoglobinBody mass indexHypertensionSexTotal bilirubinγ-glutamyl carboxilaseHDL cholesterolMCHTotal cholesterolAlbuminUreaHomocysteineCeDRelative importanceFFibrinogenTotal proteinC-reactive proteinTriglyceridePlatelet countAgeAlcaline phosphataseMCHCRBC distribution widthLDL cholesterolBody mass indexγ-glutamyl transpheraseSexTotal cholesterolHypertensionMCHHemoglobinTotal bilirubinHDL choelsterolUreaRBC distribution widthFibrinogenC-reactive proteinPlatelet countHemoglobinTotal bilirubinAlbuminTotal proteinMCHCTriglycerideAlcaline phosphataseAgeHDL cholesterolMCVMCHSexLDL cholesterolRBC countTotal cholesterolHypertensionγ-glutamyl tranpheraseBody mass indexHomocysteineGHHemoglobinSexRBC countTotal proteinAlbuminCreatinineTotal bilirubinHomocysteineHDL cholesterolMCHAlanine aminotraspheraseAlcaline phosphataseγ-glutamyl carboxilaseBody mass indexLeukocyte countMCHCFibrinogenTriglycerideMCVPlatelet countHypertensionINRC-reactive proteinRelative importanceTotal proteinFibrinogenAlcaline phosphataseC-reactive proteinγ-glutamyl carboxilasePlatelet countLDL cholesterolCeDAgeTotal cholesterolAlbuminRBC distribution widthAlanine aminostranspheraseINRUreaIJ