
Applications NAMD Parallel Framework for Unstructured Meshing ParFUM Features Profile snapshots Captures the runtime of the application by segregating it into user specified intervals CUDA Profiling ID: 419802
Download Presentation The PPT/PDF document "More Charm++/TAU examples" is the property of its rightful owner. Permission is granted to download and print the materials on this web site for personal, non-commercial use only, and to display it on your personal computer provided you do not modify the materials and that you retain all copyright notices contained in the materials. By downloading content from our website, you accept the terms of this agreement.


Slide1
More Charm++/TAU examples
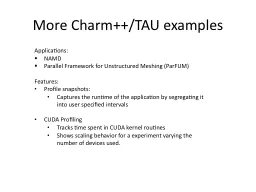
Applications:
NAMD
Parallel Framework for Unstructured Meshing (
ParFUM
)
Features:
Profile snapshots:
Captures the runtime of the application by segregating it into user specified intervals
CUDA Profiling
Tracks time spent in CUDA kernel routines
Shows scaling behavior for a experiment varying the number of devices used.Slide2
Load Balancing Phases
NAMD Snapshot Profile of over 800sec on 2048 processors
Mean Exclusive Time
Standard Deviation
enqueneSelfB
enqueneSelfA
Main
enqueneWorkB
enqueneWorkA
IdleSlide3
NAMD CUDA events
GPU efficiency gained by doubling the number of GPU from 16 to 32. These Events are broken down by routine and by device number.
Device #0
~100%
efficiency
~50%
efficiencySlide4
NAMD CUDA scaling
Non-Bonded Calculations
Sum Forces Calculations
Scaling by event and device number, Non-Bonded Calculations scale well. Sum Forces less well but the overall time is only a few microseconds.
Number of Devices
Scaling EfficiencySlide5
ParFUM CUDA speedup
Single CPU or GPU Performance on a 128x8x8 mesh. When run with GPU acceleration enabled
ParFUM
spent 9 seconds in the CUDA Kernel routines.