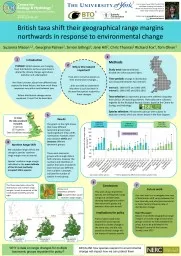
Results
The graph on the right shows that many different taxonomic groups have made significant mean shifts northwards however there was variation within and between different taxonomic groups There were taxonomic groups with enough data in both intervals however the numbers and identities of species that were included in each interval was different The numbers in brackets indicate the number of species in each group
Embed this Presentation
Available Downloads
Download Notice
Download Presentation The PPT/PDF document "Results" is the property of its rightful owner. Permission is granted to download and print the materials on this website for personal, non-commercial use only, and to display it on your personal computer provided you do not modify the materials and that you retain all copyright notices contained in the materials. By downloading content from our website, you accept the terms of this agreement.