/
Assignment 1 Crib Assignment 1 Crib

Assignment 1 Crib - PDF document

jocelyn
jocelyn . @jocelyn
Follow
345 views
Uploaded On 2021-06-28

Assignment 1 Crib - PPT Presentation

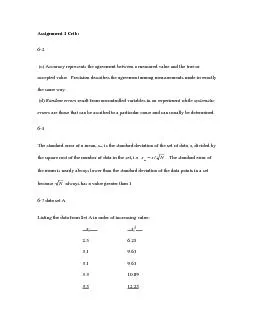
62 c Accuracy represents the agreement between a measured value and the true or accepted value Precision describes the agreement among measurements made in exactly the same way d Random er ID: 848205

ave standard deviation set standard ave set deviation data 100 472 sum confidence 494 errors 043 158 2728 089

Share:

Link:

Embed:

Download Presentation from below link

Download Pdf The PPT/PDF document "Assignment 1 Crib" is the property of its rightful owner. Permission is granted to download and print the materials on this web site for personal, non-commercial use only, and to display it on your personal computer provided you do not modify the materials and that you retain all copyright notices contained in the materials. By downloading content from our website, you accept the terms of this agreement.


Presentation Transcript

1 Assignment 1 Crib: 6-2 (c) Accuracy
Assignment 1 Crib: 6-2 (c) Accuracy represents the agreement between a measured value and the true or accepted value. Precision describes the agreement among measurements made in exactly the same way. (d) Random errors result from uncontrolled variables in an experiment while systematic errors are those that can be ascribed to a particular cause and can usually be determined. 6-4 The standard error of a mean, s m, is the standard deviation of the set of data, s, divided by the square root of the number of data in the set, i.e. Nssm/ . The standard error of the mean is nearly always lower than the standard deviation of the data points in a set because N always has a value greater than 1. 6-7 data set A Listing the data from Set A in order of increasing value: x i x i 2 2.5 6.25 3.

2 1 9.61 3.1 9.61 3.3 10.89
1 9.61 3.1 9.61 3.3 10.89 3.5 12.25 x i = 15.5 x i 2 = 48.61 (a) mean: x = 15.5/5 = 3.1 (b) median = 3.1 (c) spread: w = 3.5 – 2.5 = 1.0 (d) standard deviation: 37.0155/5.1561.482s 0.4 (e) coefficient of variation: CV = (0.37/3.1) 100% = 12% 6-9 (b) 089.008.00001.004.0222ys CV = (0.089/21.2625) 100% = 0.42% y = 21.26(0.09) 6-10 (d) 043.01003.11004.01063.11003.02161621414ysy CV = (0.043) 100% = 4.3% y = 1.6310 -14 / 1.0310 -16 = 158 s y = (0.043) (158) = 6.8 y = 158(7) 6-16 First calculate the mean transmittance and the standard deviation of the mean. mean T = 2728.04274.0268.0276.0273.0 s T = 0.0034 (a) c X = M 10252.225052728.0loglog4bT (b) For –logT, s y = (0.434)(0.0034/0.2728) = 0.0054 and -log(0.2728) = 0.5642 1225050

3 054.05642.0Xc 0107.02505125642.00053
054.05642.0Xc 0107.02505125642.00053.022XXcsC 64104.210252.20105.0XCs (c) CV = (2.410 -6 /2.25210 -4 ) 100% = 1.1% 6-18 The following spreadsheet result summarizes the calculations of means, standard deviations, and the pooled standard deviation. A B C D E F G H I J K L M 1 2 3 Sample 1 (x i -x ave ) 2 2 (x i -x ave ) 2 3 (x i -x ave ) 2 4 (x i -x ave ) 2 5 (x i -x ave ) 2 6 (x i -x ave ) 2 4 5 0.99 0.0016 1.02 0.0042 1.25 0.0021 0.72 0.0025 0.90 0.0025 0.70 0.0033 6 0.84 0.0121 1.13 0.0020 1.32 0.0135 0.77 0.0100 0.92 0.0049 0.88 0.0150 7 1.02 0.0049 1.17 0.0072 1.13 0.0055 0.61 0.0036 0.73 0.0144 0.72 0.0014 8 1.02 0.0042 1.20 0.0000 0.58 0.0081 0.73 0.0008 9 1.12 0.0

4 071 10
071 10 11 mean 0.950 1.085 1.204 0.670 0.850 0.758 12 s 0.096 0.077 0.084 0.090 0.104 0.083 13 N 3 4 5 4 3 4 14 (x i -x ave ) 2 0.0186 0.0177 0.0281 0.0242 0.0218 0.0205 15 16 s pooled 0.088 No. Sets 6 17 18 Spreadsheet Documentation N Total 23 19 (x i -x ave ) 2 0.1309 20 B11=AVERAGE(B5:B9) 21 B12=STDEV(B5:B9) 22 C4=(B5-$B$11)^2 23 C13=COUNT(C5:C9) 24 C14=SUM(C5:C9) 25 K18=SUM(C13:M13) 26 K19=SUM(C14:M14) 27 B16=SQRT(K19/(K18-K16)) 7-4

5 For Set F: x i x i 2
For Set F: x i x i 2 0.514 0.264 0.503 0.253 0.486 0.236 0.497 0.247 0.472 0.223 x i = 2.472 x i 2 = 1.223 mean: x = 2.472/5 = 0.494 standard deviation: 015.0155/472.2223.12s Since, for a small set of measurements we cannot be certain s is a good approximation of , we will use the t statistic for confidence intervals. From Table 7-3, at 95% confidence t for 4 degrees of freedom is 2.78, therefore CI for = 0.494 5015.078.2 = 0.494 0.019 The 95% confidence interval establishes the range about the mean that we can be 95% confident that the true value lies within (in the absence of systematic errors). 7-12 For the data set: 24.7x and s = 0.25 (a) 90% CL = 7.24 325.092.2 = 7.24 0.42 % lindane (b) 90% CL = 7.24 328.064.1 = 7.24 0.27 % lind