PPT-Phase Diagram for Water
Author : tatiana-dople | Published Date : 2019-11-08
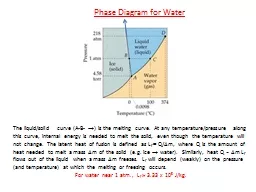
Phase Diagram for Water The liquidsolid curve AB is the melting curve At any temperaturepressure along this curve internal energy is needed to melt the solid even
Presentation Embed Code
Download Presentation
Download Presentation The PPT/PDF document "Phase Diagram for Water" is the property of its rightful owner. Permission is granted to download and print the materials on this website for personal, non-commercial use only, and to display it on your personal computer provided you do not modify the materials and that you retain all copyright notices contained in the materials. By downloading content from our website, you accept the terms of this agreement.
Phase Diagram for Water: Transcript
Download Rules Of Document
"Phase Diagram for Water"The content belongs to its owner. You may download and print it for personal use, without modification, and keep all copyright notices. By downloading, you agree to these terms.
Related Documents