PDF-1Name_______________________________Section___________________________
SO
tatyana-admore
Published 2017-11-22 | 5254 Views
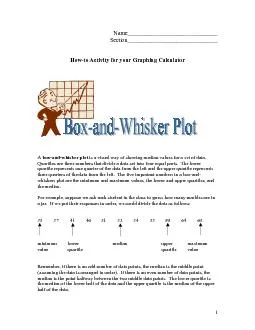
35 37 41 46 51 52 54 55 59 64 68minimumlowermedian uppermaximumvaluequartile quartilevalue
plot for the number of points scored 79 65 82 66 74 5
Download Presentation
Download Presentation The PPT/PDF document "1Name_______________________________Sect..." is the property of its rightful owner. Permission is granted to download and print the materials on this website for personal, non-commercial use only, and to display it on your personal computer provided you do not modify the materials and that you retain all copyright notices contained in the materials. By downloading content from our website, you accept the terms of this agreement.