
Analyzing Investing Activities The Balance Sheet


Description: Analyzing Investing Activities The Balance Sheet Copyright 2010 Pearson Education, Inc. Publishing as Prentice Hall 2-2 Old accountants never die; they just lose their balance --Anonymous Current (Short-term) Assets Noncurrent
Related Topics
Download Presentation
"Analyzing Investing Activities The Balance Sheet" is the property of its rightful owner. Permission is granted to download and print the materials on this website for personal, non-commercial use only, and to display it on your personal computer provided you do not modify the materials and that you retain all copyright notices contained in the materials. By downloading content from our website, you accept the terms of this agreement.
Presentation Transcript
slide1. Analyzing Investing Activities<br>
slide2. The Balance Sheet Copyright © 2010 Pearson Education, Inc. Publishing as Prentice Hall 2-2 “Old accountants never die; they just lose their balance”
--Anonymous<br>
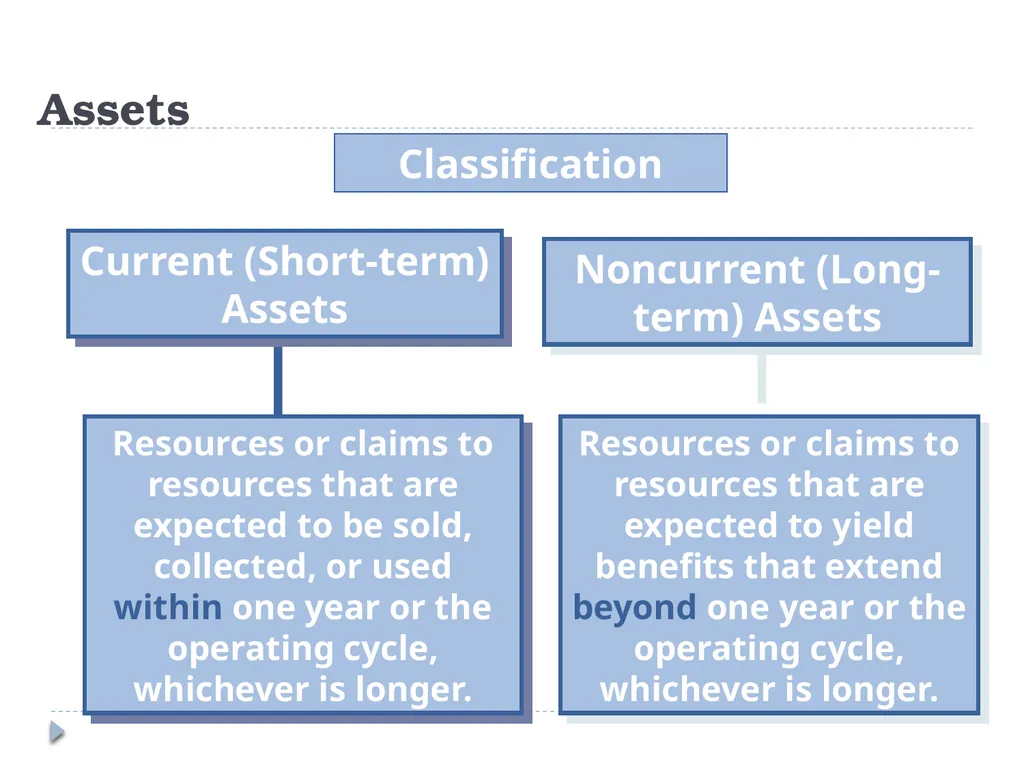
slide3. Current (Short-term) Assets Noncurrent (Long-term) Assets Resources or claims to resources that are expected to be sold, collected, or used within one year or the operating cycle, whichever is longer. Resources or claims to resources that are expected to yield benefits that extend beyond one year or the operating cycle, whichever is longer. Classification Assets<br>
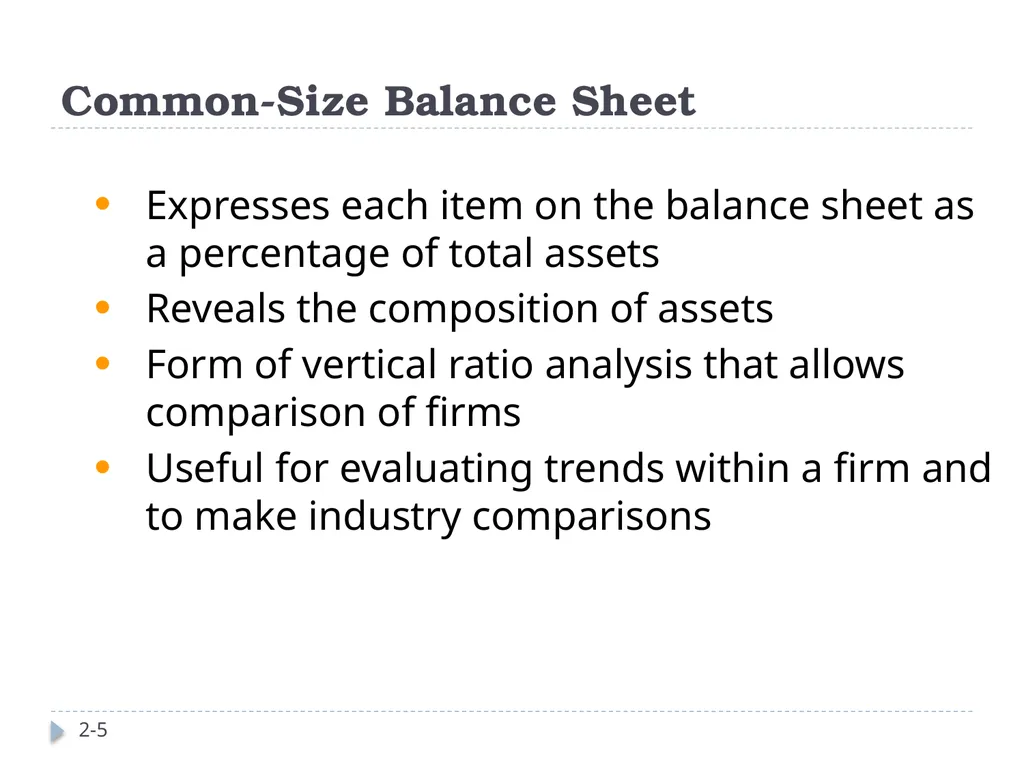
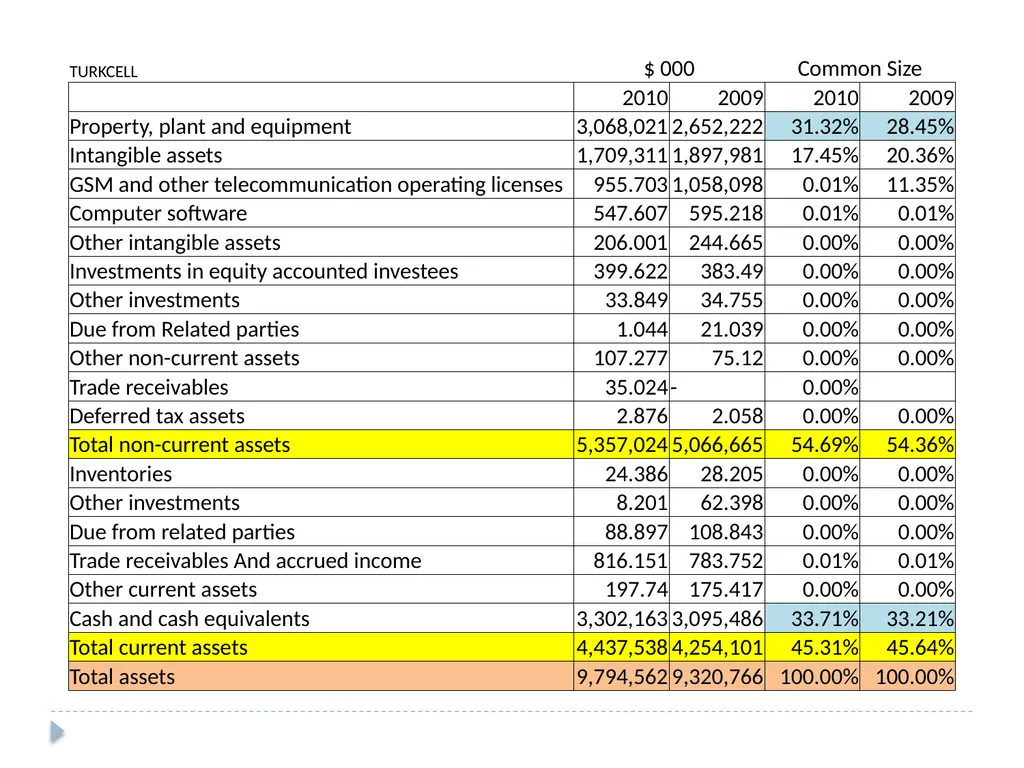
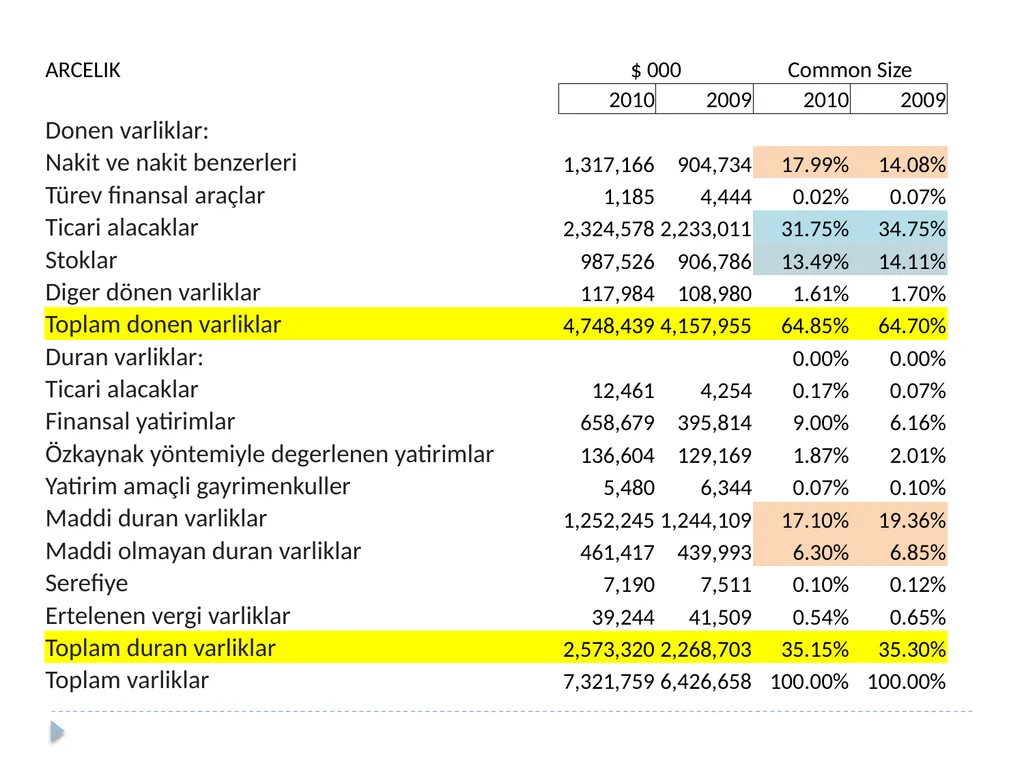
slide5. 2-5 Common-Size Balance Sheet Expresses each item on the balance sheet as a percentage of total assets
Reveals the composition of assets
Form of vertical ratio analysis that allows comparison of firms
Useful for evaluating trends within a firm and to make industry comparisons<br>
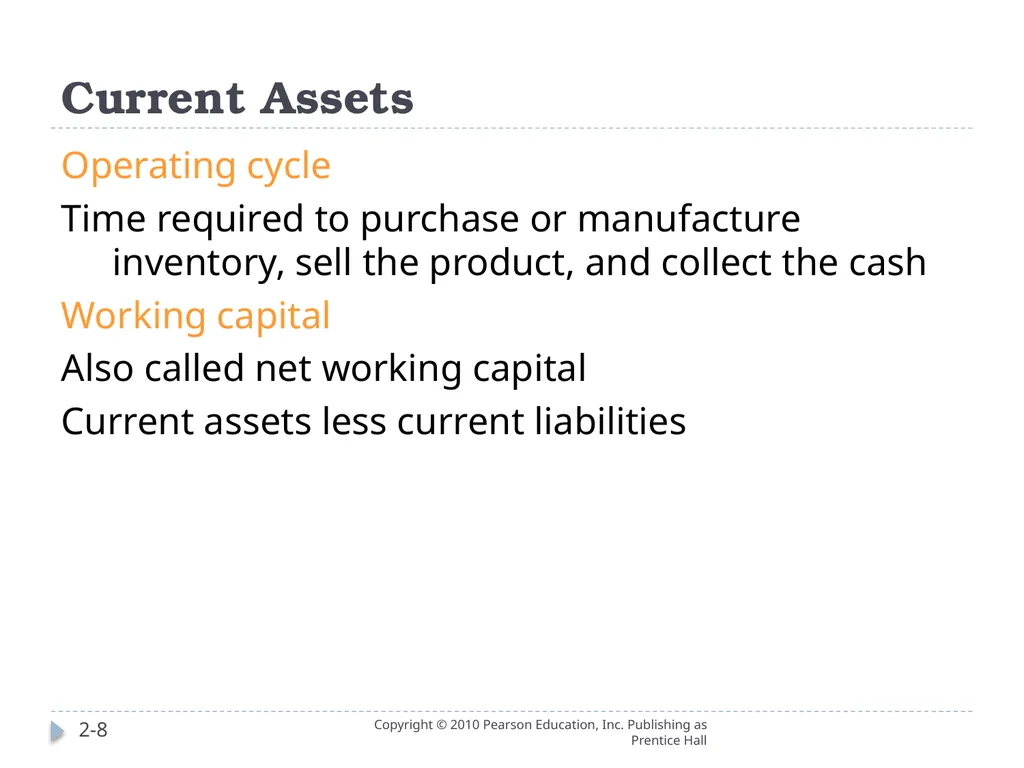
slide8. Current Assets Copyright © 2010 Pearson Education, Inc. Publishing as Prentice Hall 2-8 Operating cycle
Time required to purchase or manufacture inventory, sell the product, and collect the cash
Working capital
Also called net working capital
Current assets less current liabilities<br>
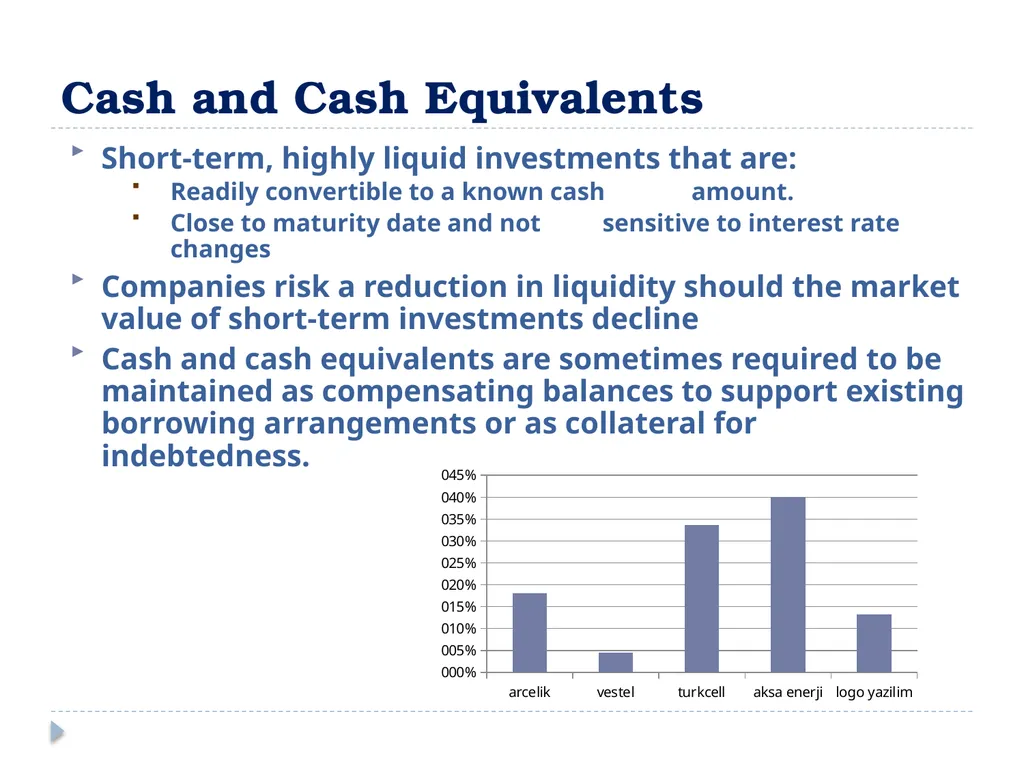
slide9. Cash and Cash Equivalents Short-term, highly liquid investments that are:
Readily convertible to a known cash amount.
Close to maturity date and not sensitive to interest rate changes
Companies risk a reduction in liquidity should the market value of short-term investments decline
Cash and cash equivalents are sometimes required to be maintained as compensating balances to support existing borrowing arrangements or as collateral for indebtedness.<br>
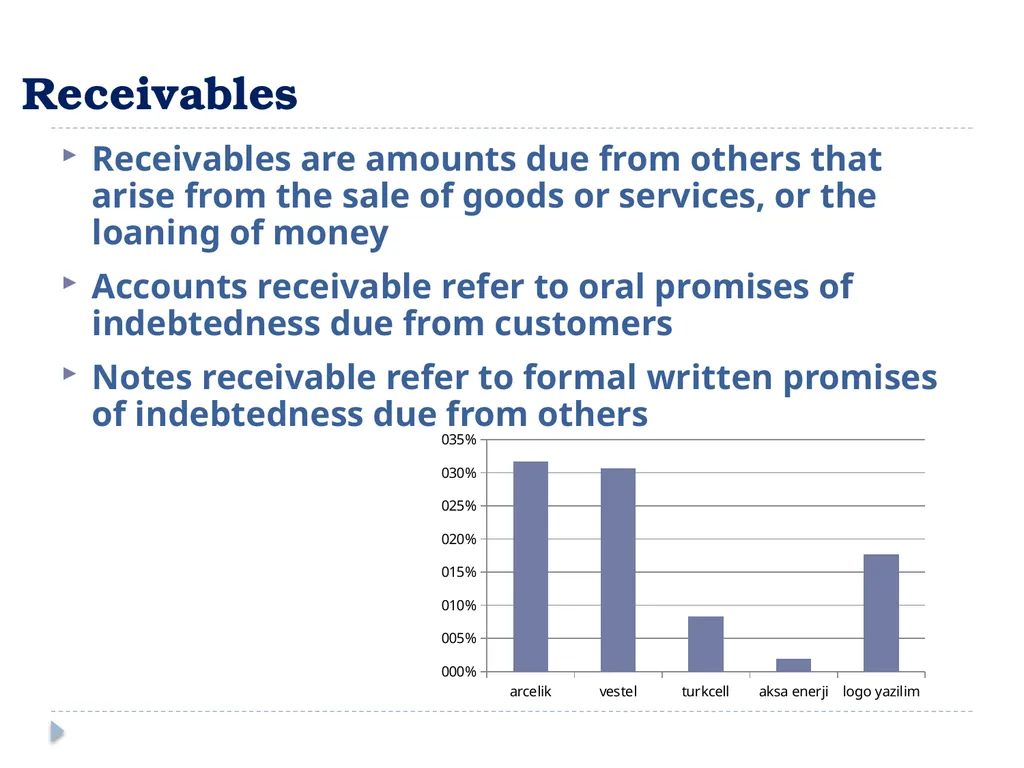
slide10. Receivables Receivables are amounts due from others that arise from the sale of goods or services, or the loaning of money
Accounts receivable refer to oral promises of indebtedness due from customers
Notes receivable refer to formal written promises of indebtedness due from others<br>
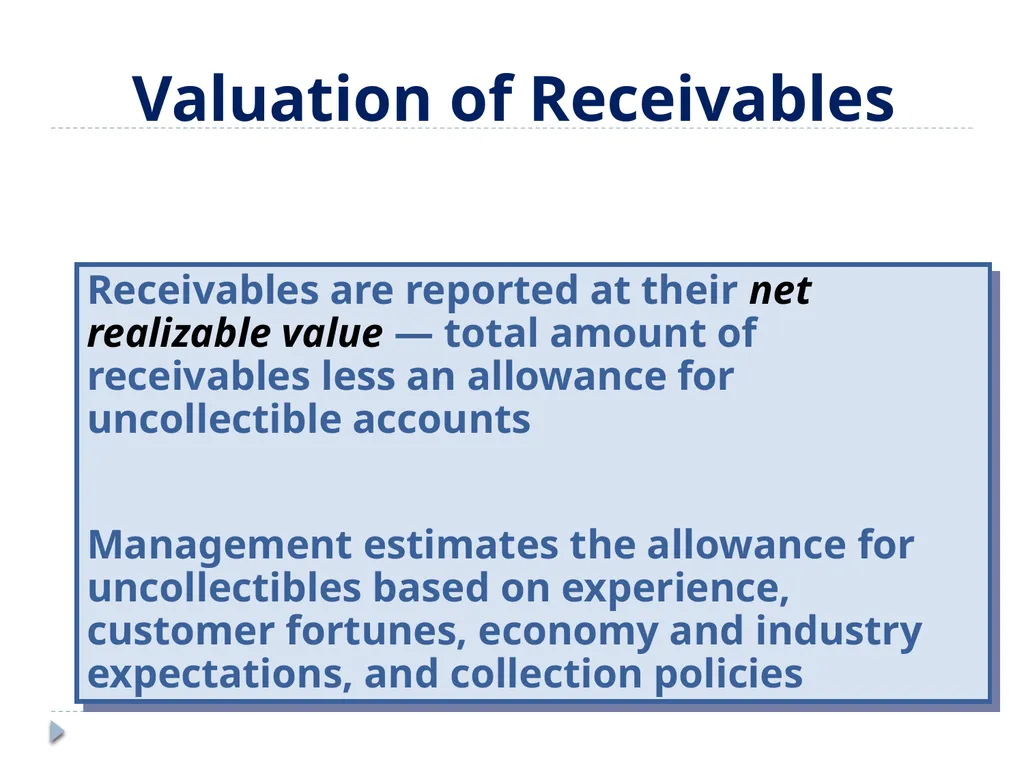
slide11. Receivables are reported at their net realizable value — total amount of receivables less an allowance for uncollectible accounts
Management estimates the allowance for uncollectibles based on experience, customer fortunes, economy and industry expectations, and collection policies Valuation of Receivables<br>
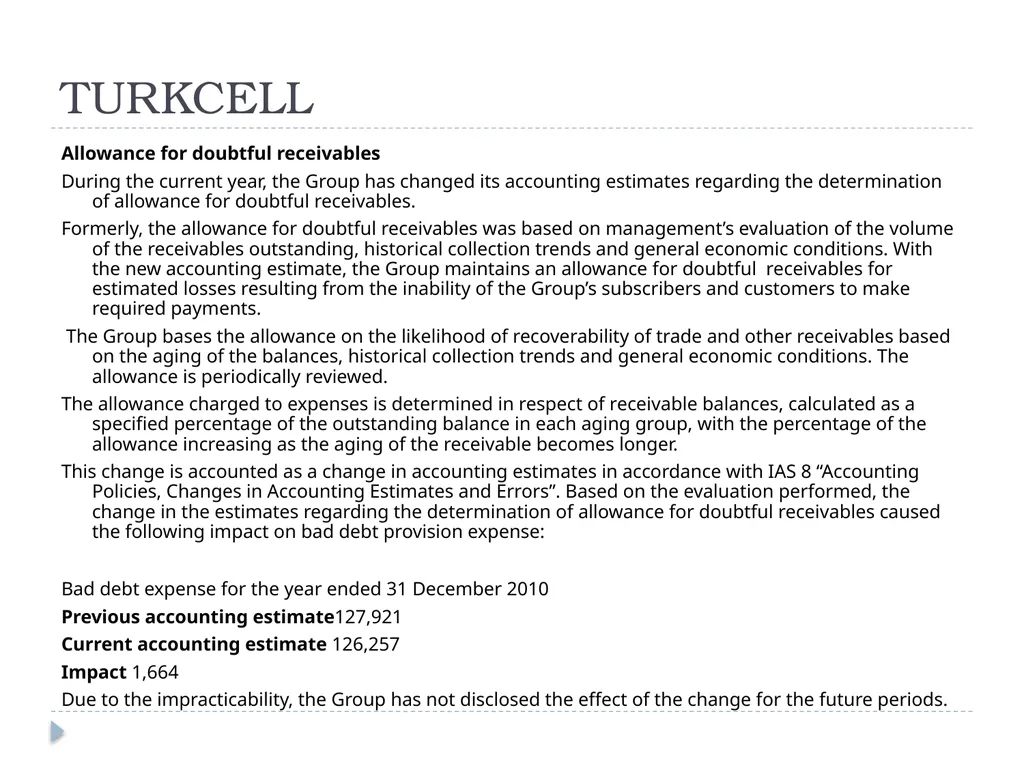
slide12. TURKCELL Allowance for doubtful receivables
During the current year, the Group has changed its accounting estimates regarding the determination of allowance for doubtful receivables.
Formerly, the allowance for doubtful receivables was based on management’s evaluation of the volume of the receivables outstanding, historical collection trends and general economic conditions. With the new accounting estimate, the Group maintains an allowance for doubtful receivables for estimated losses resulting from the inability of the Group’s subscribers and customers to make required payments.
The Group bases the allowance on the likelihood of recoverability of trade and other receivables based on the aging of the balances, historical collection trends and general economic conditions. The allowance is periodically reviewed.
The allowance charged to expenses is determined in respect of receivable balances, calculated as a specified percentage of the outstanding balance in each aging group, with the percentage of the allowance increasing as the aging of the receivable becomes longer.
This change is accounted as a change in accounting estimates in accordance with IAS 8 “Accounting Policies, Changes in Accounting Estimates and Errors”. Based on the evaluation performed, the change in the estimates regarding the determination of allowance for doubtful receivables caused the following impact on bad debt provision expense:
Bad debt expense for the year ended 31 December 2010
Previous accounting estimate127,921
Current accounting estimate 126,257
Impact 1,664
Due to the impracticability, the Group has not disclosed the effect of the change for the future periods.<br>
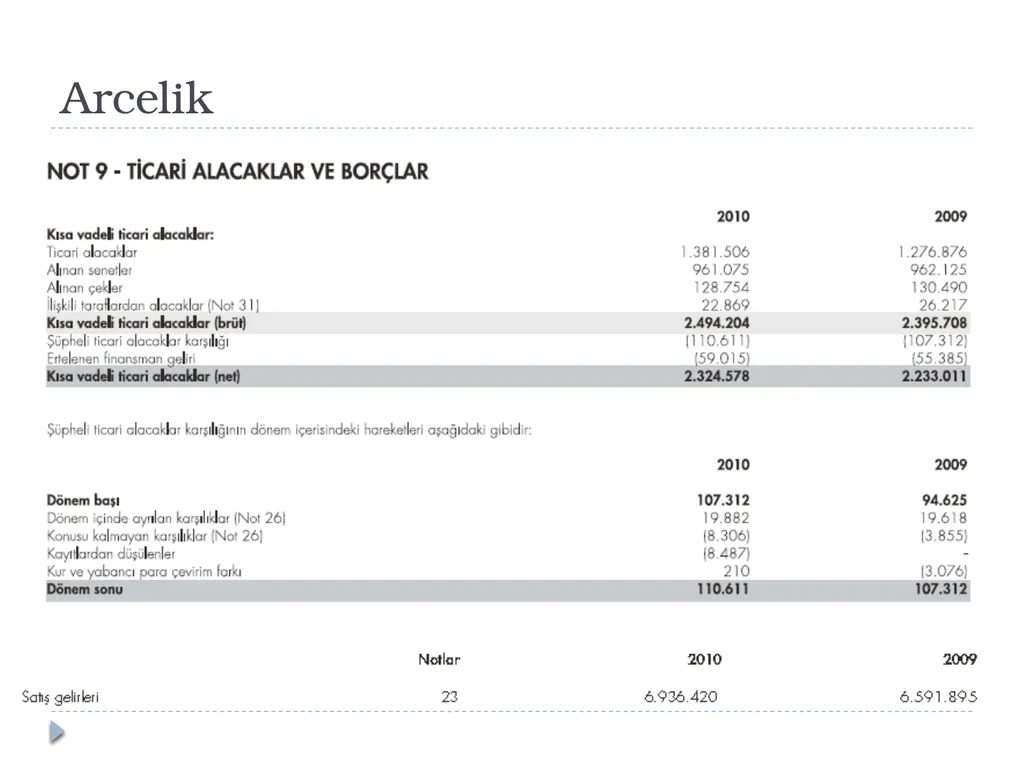
slide13. Arcelik<br>
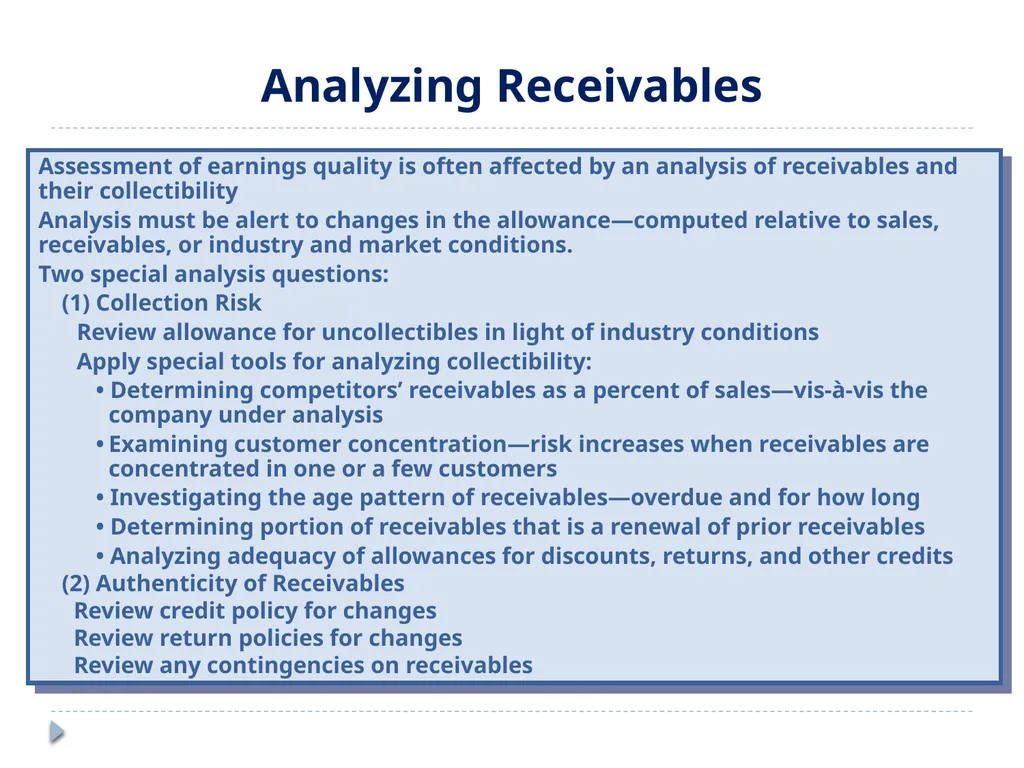
slide14. Assessment of earnings quality is often affected by an analysis of receivables and their collectibility
Analysis must be alert to changes in the allowance—computed relative to sales, receivables, or industry and market conditions.
Two special analysis questions:
(1) Collection Risk
Review allowance for uncollectibles in light of industry conditions
Apply special tools for analyzing collectibility:
• Determining competitors’ receivables as a percent of sales—vis-à-vis the company under analysis
• Examining customer concentration—risk increases when receivables are concentrated in one or a few customers
• Investigating the age pattern of receivables—overdue and for how long
• Determining portion of receivables that is a renewal of prior receivables
• Analyzing adequacy of allowances for discounts, returns, and other credits
(2) Authenticity of Receivables
Review credit policy for changes
Review return policies for changes
Review any contingencies on receivables Analyzing Receivables<br>
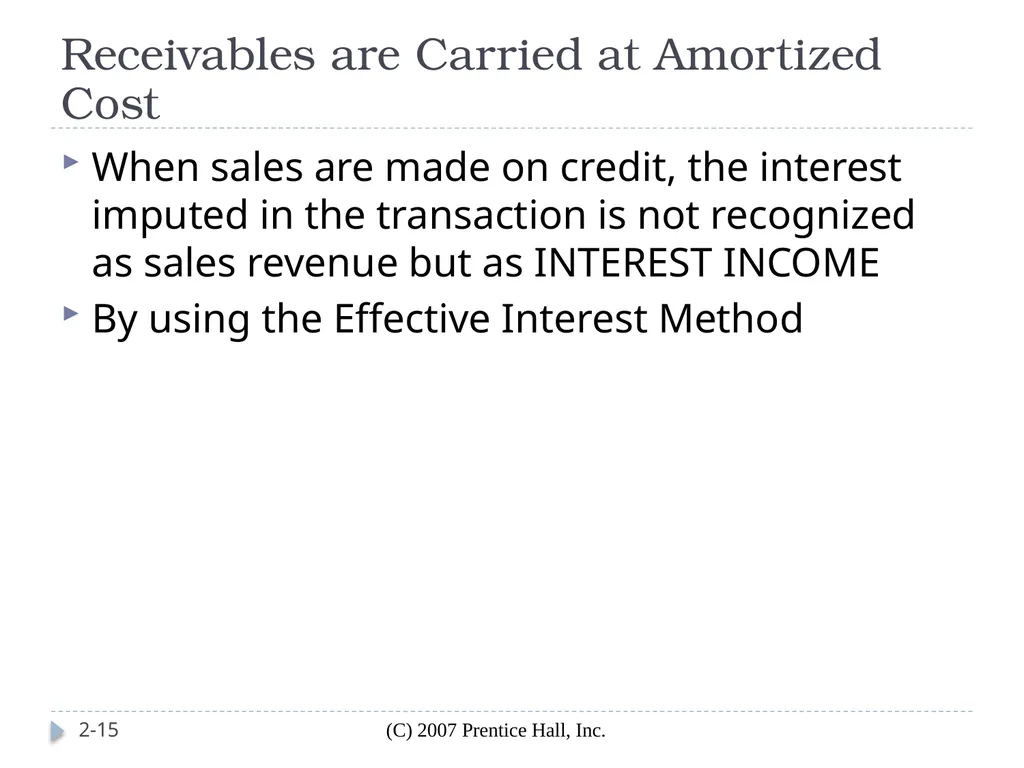
slide15. Receivables are Carried at Amortized Cost (C) 2007 Prentice Hall, Inc. 2-15 When sales are made on credit, the interest imputed in the transaction is not recognized as sales revenue but as INTEREST INCOME
By using the Effective Interest Method<br>
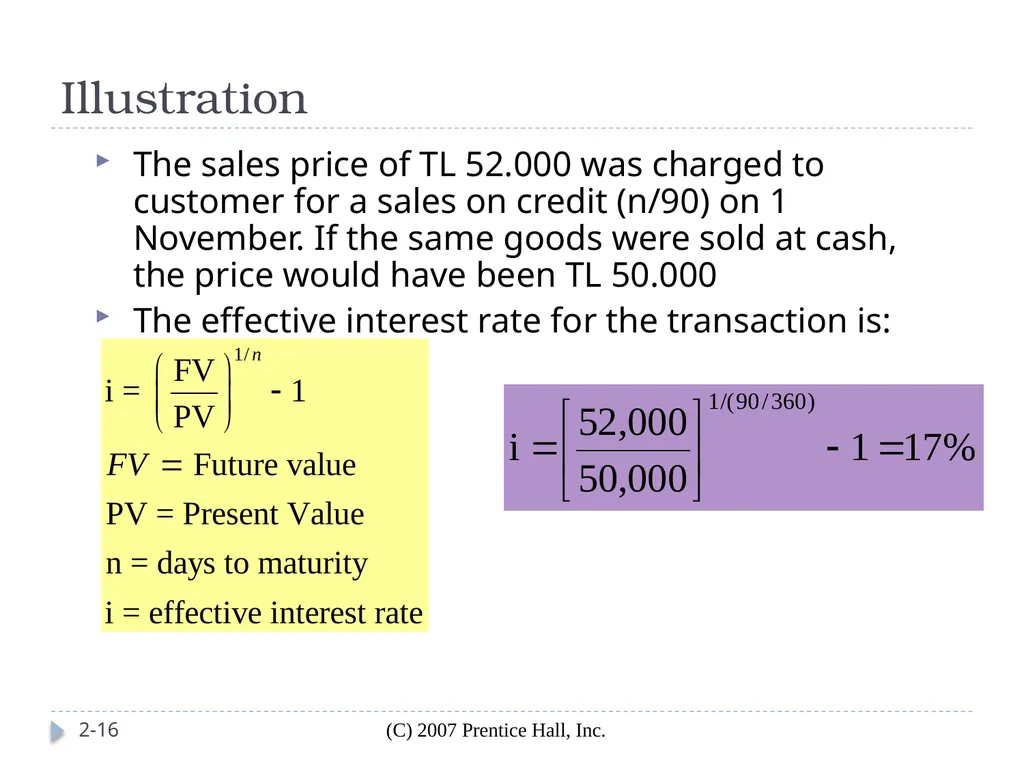
slide16. Illustration (C) 2007 Prentice Hall, Inc. 2-16 The sales price of TL 52.000 was charged to customer for a sales on credit (n/90) on 1 November. If the same goods were sold at cash, the price would have been TL 50.000
The effective interest rate for the transaction is:<br>
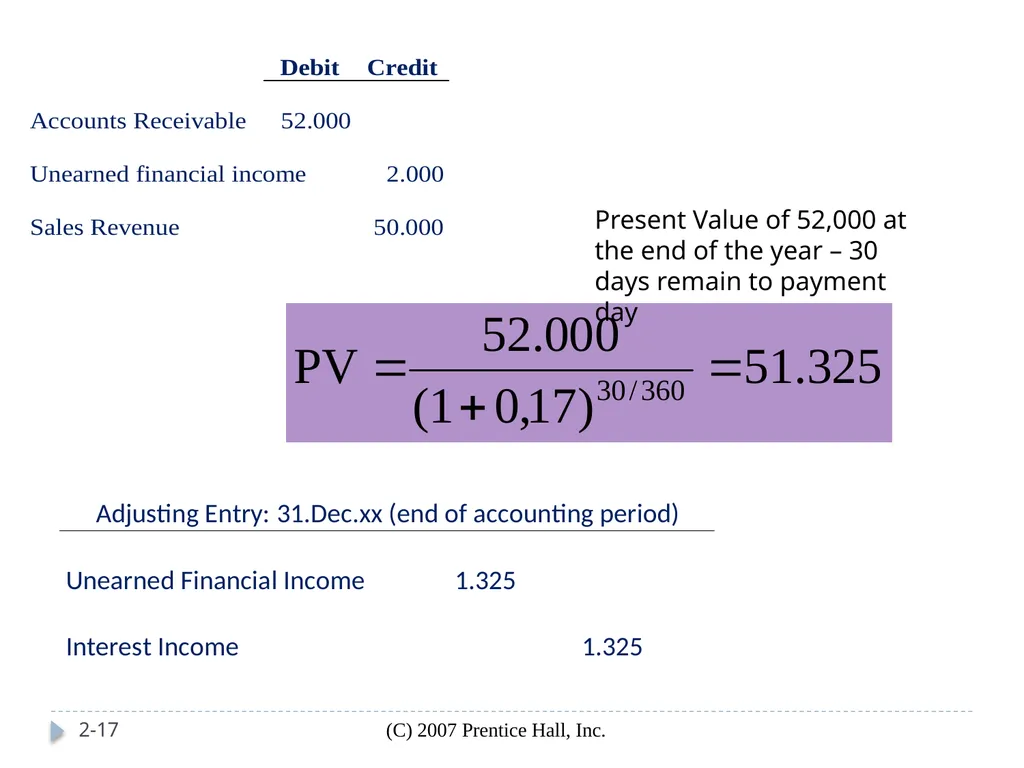
slide17. (C) 2007 Prentice Hall, Inc. 2-17 Present Value of 52,000 at the end of the year – 30 days remain to payment day<br>
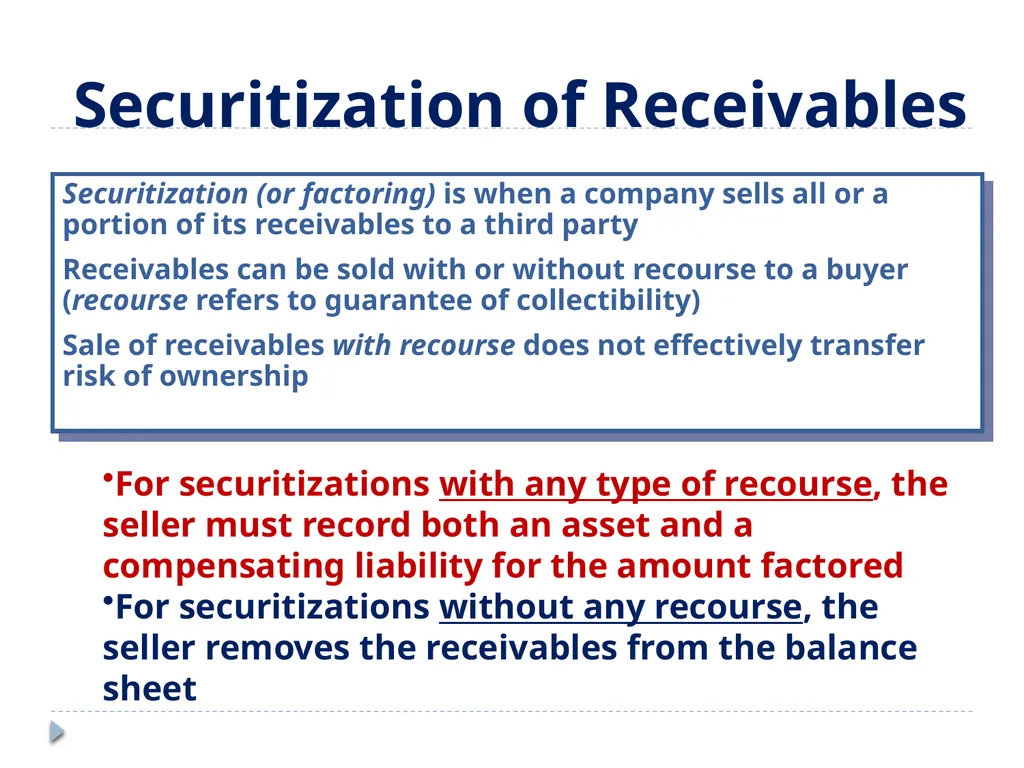
slide18. Securitization (or factoring) is when a company sells all or a portion of its receivables to a third party
Receivables can be sold with or without recourse to a buyer (recourse refers to guarantee of collectibility)
Sale of receivables with recourse does not effectively transfer risk of ownership Securitization of Receivables For securitizations with any type of recourse, the seller must record both an asset and a compensating liability for the amount factored
For securitizations without any recourse, the seller removes the receivables from the balance sheet<br>
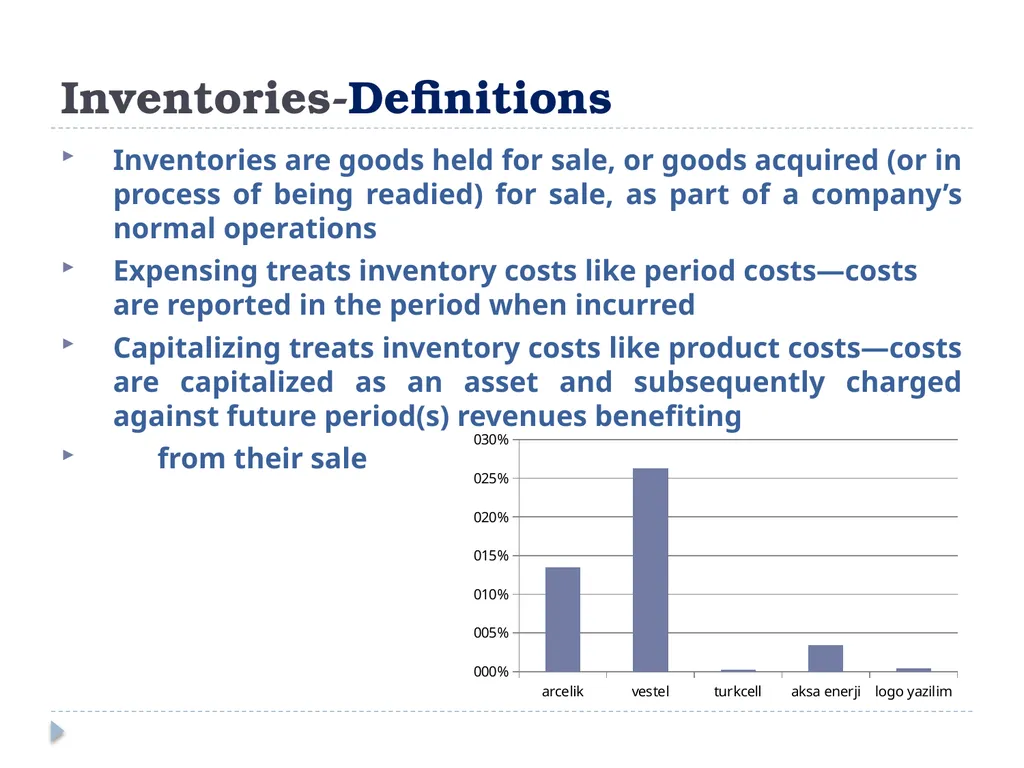
slide19. Inventories-Definitions Inventories are goods held for sale, or goods acquired (or in process of being readied) for sale, as part of a company’s normal operations
Expensing treats inventory costs like period costs—costs are reported in the period when incurred
Capitalizing treats inventory costs like product costs—costs are capitalized as an asset and subsequently charged against future period(s) revenues benefiting
from their sale<br>
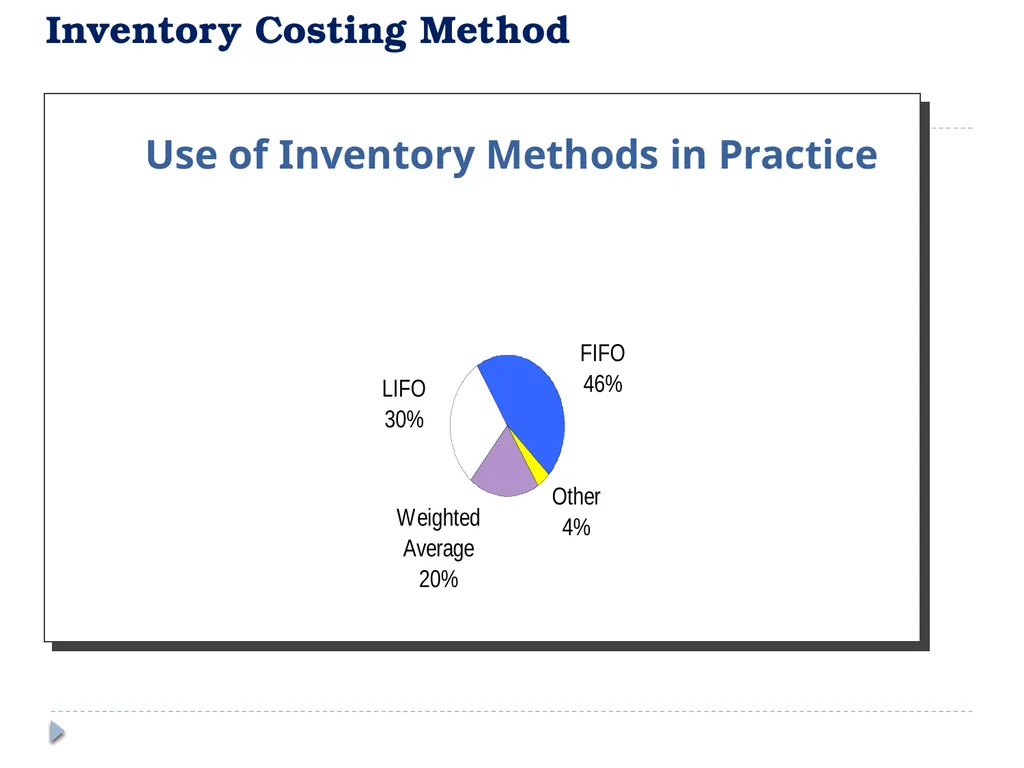
slide20. Use of Inventory Methods in Practice Inventory Costing Method<br>
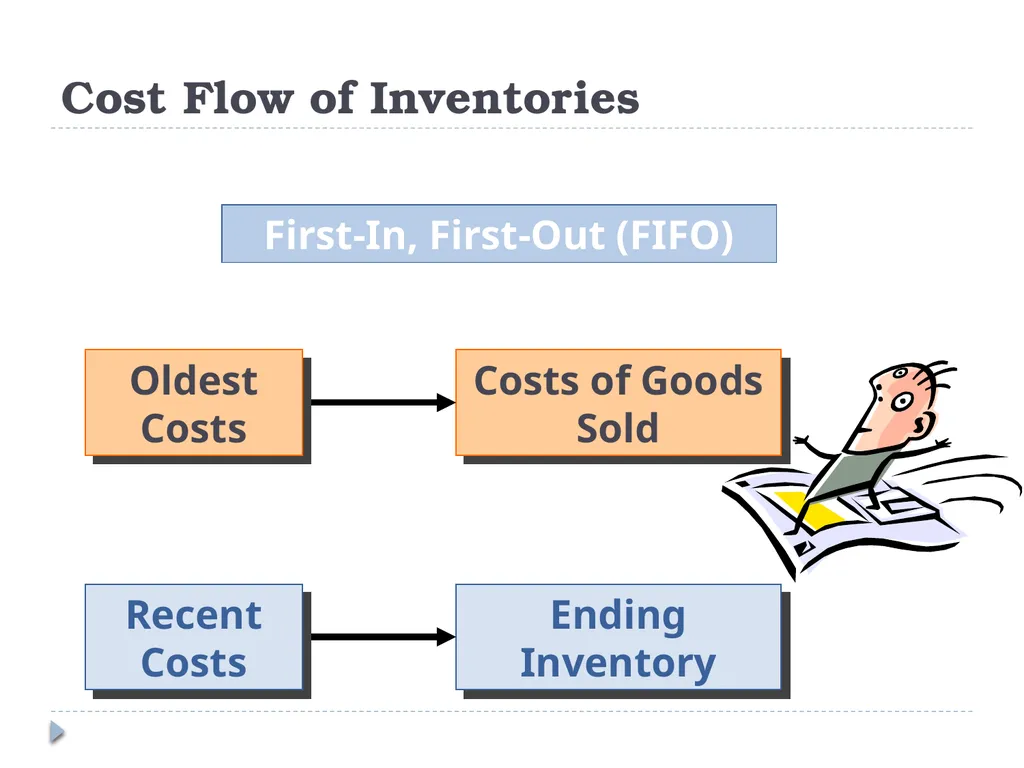
slide21. Costs of Goods Sold Ending Inventory Oldest Costs Recent Costs First-In, First-Out (FIFO) Cost Flow of Inventories<br>
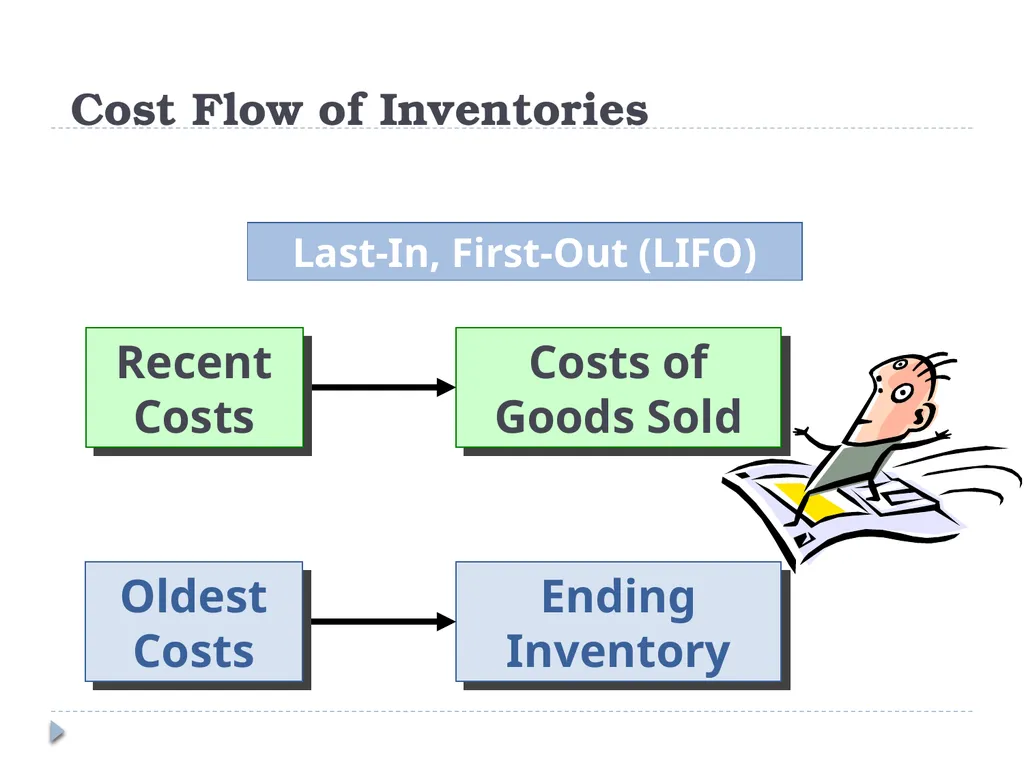
slide22. Costs of Goods Sold Ending Inventory Recent Costs Oldest Costs Last-In, First-Out (LIFO) Cost Flow of Inventories<br>
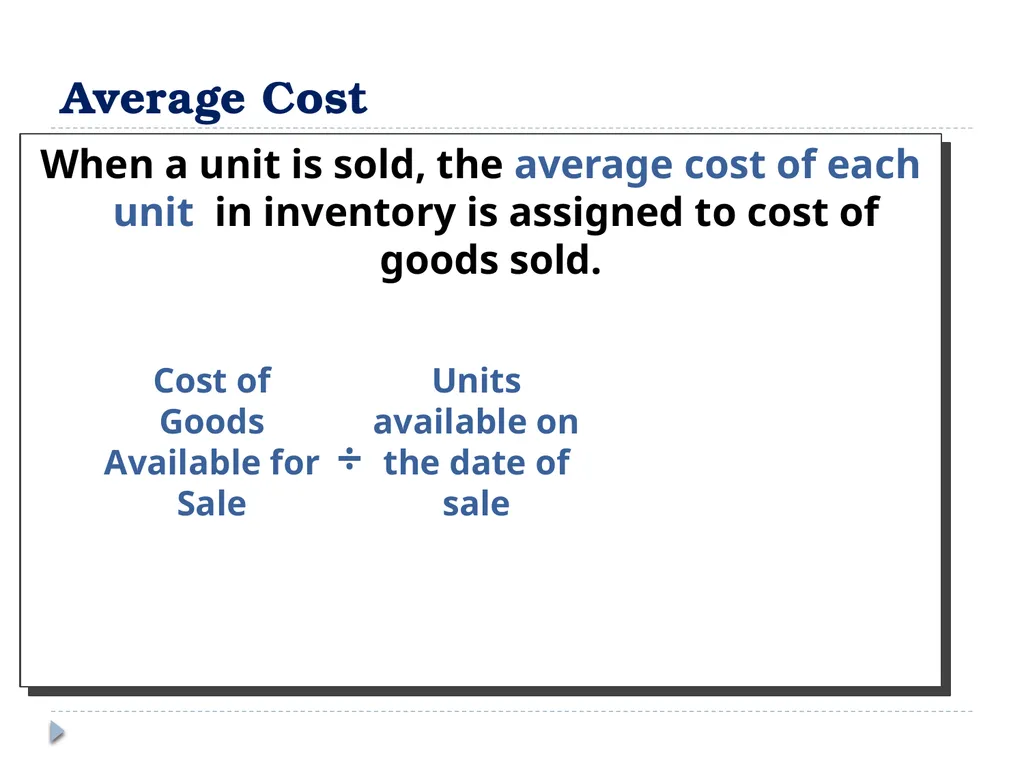
slide23. Average Cost When a unit is sold, the average cost of each unit in inventory is assigned to cost of goods sold. ÷<br>
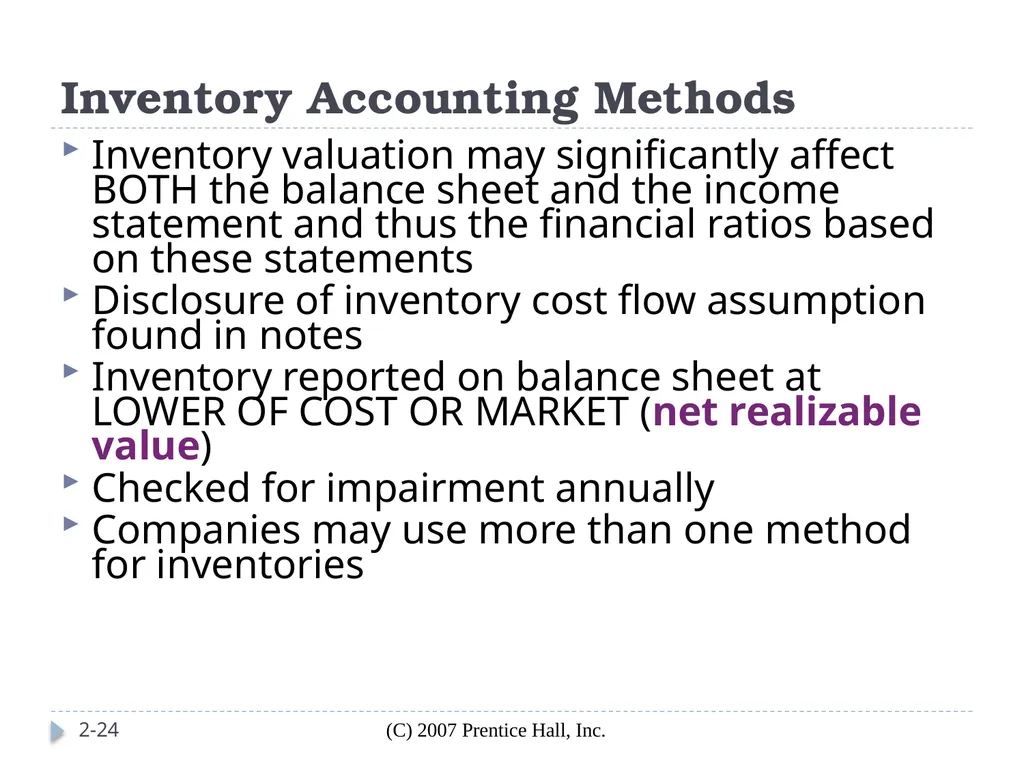
slide24. Inventory Accounting Methods (C) 2007 Prentice Hall, Inc. 2-24 Inventory valuation may significantly affect BOTH the balance sheet and the income statement and thus the financial ratios based on these statements
Disclosure of inventory cost flow assumption found in notes
Inventory reported on balance sheet at LOWER OF COST OR MARKET (net realizable value)
Checked for impairment annually
Companies may use more than one method for inventories<br>
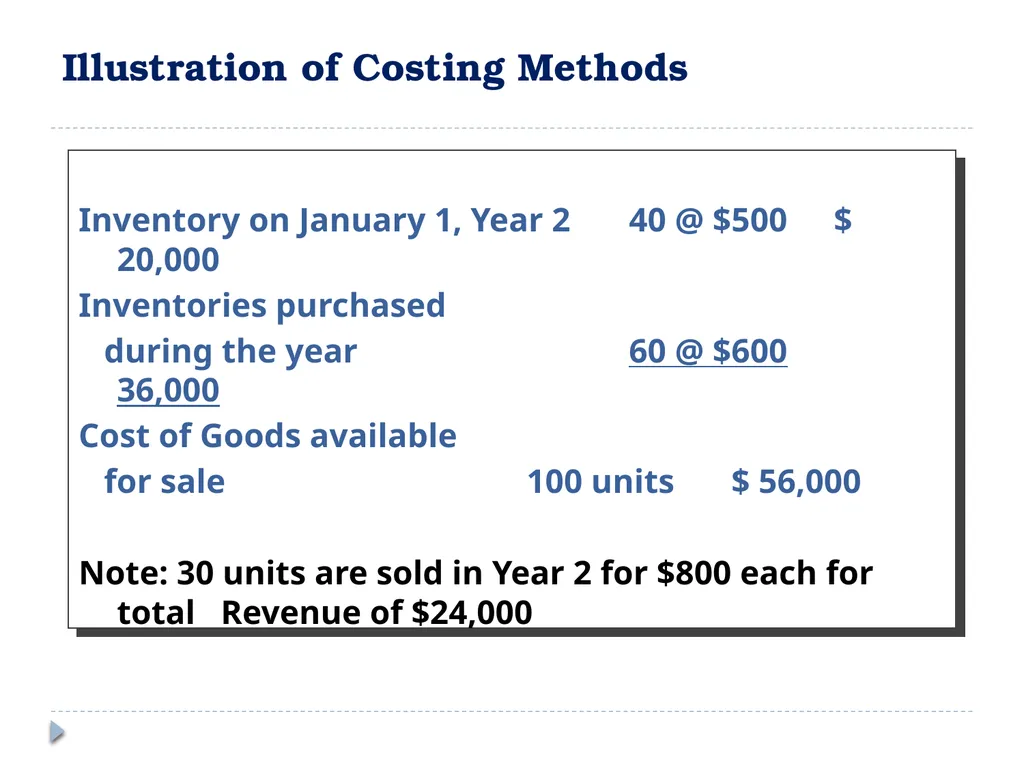
slide25. Inventory on January 1, Year 2 40 @ $500 $ 20,000
Inventories purchased
during the year 60 @ $600 36,000
Cost of Goods available
for sale 100 units $ 56,000
Note: 30 units are sold in Year 2 for $800 each for total Revenue of $24,000 Illustration of Costing Methods<br>
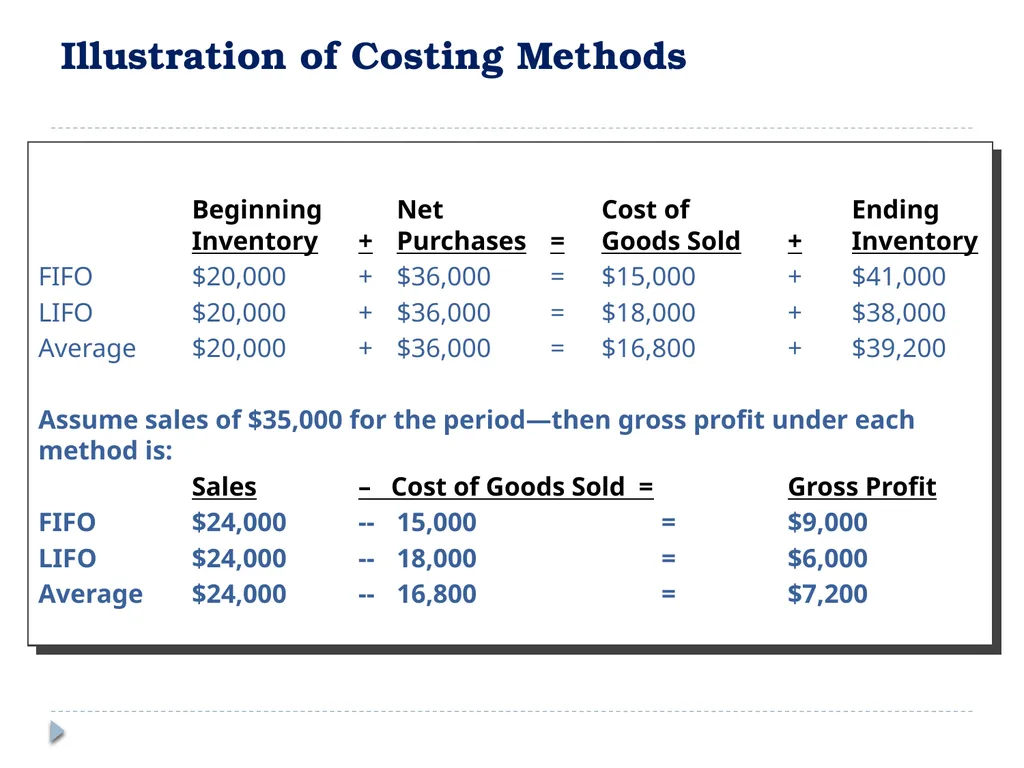
slide26. Beginning Net Cost of Ending Inventory + Purchases = Goods Sold + Inventory
FIFO $20,000 + $36,000 = $15,000 + $41,000
LIFO $20,000 + $36,000 = $18,000 + $38,000
Average $20,000 + $36,000 = $16,800 + $39,200
Assume sales of $35,000 for the period—then gross profit under each method is:
Sales – Cost of Goods Sold = Gross Profit
FIFO $24,000 -- 15,000 = $9,000
LIFO $24,000 -- 18,000 = $6,000
Average $24,000 -- 16,800 = $7,200 Illustration of Costing Methods<br>
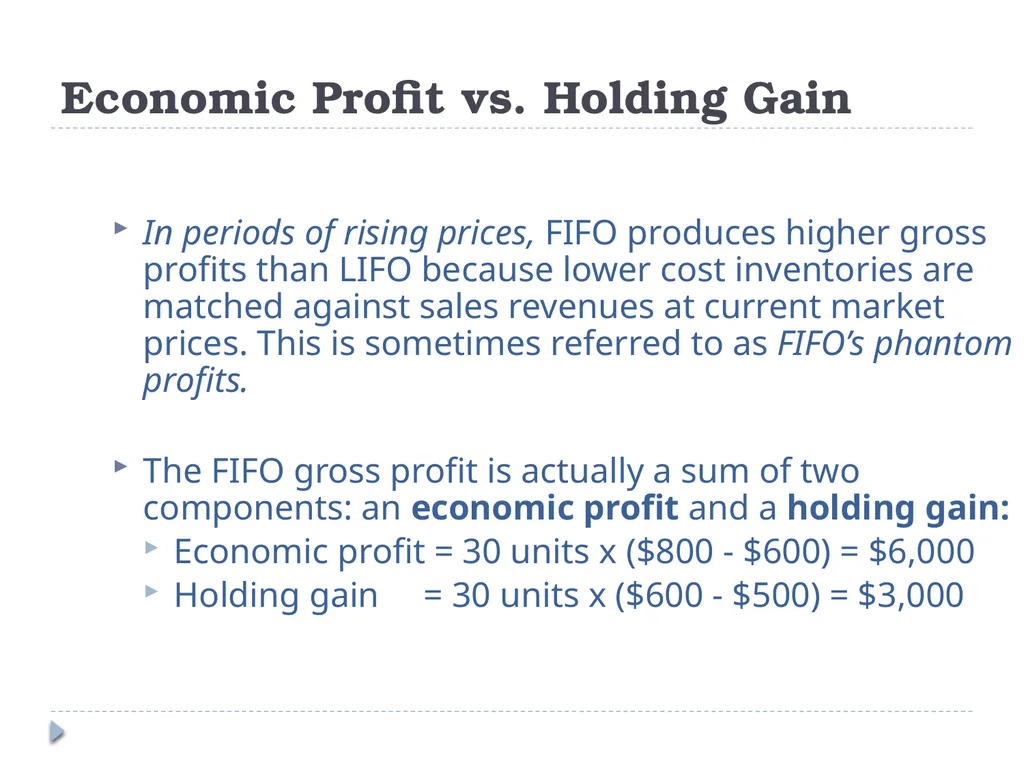
slide27. Economic Profit vs. Holding Gain In periods of rising prices, FIFO produces higher gross profits than LIFO because lower cost inventories are matched against sales revenues at current market prices. This is sometimes referred to as FIFO’s phantom profits.
The FIFO gross profit is actually a sum of two components: an economic profit and a holding gain:
Economic profit = 30 units x ($800 - $600) = $6,000
Holding gain = 30 units x ($600 - $500) = $3,000<br>
slide28. Prepaid expenses are advance payments for services or goods not yet received that extend beyond the current accounting period—examples are advance payments for rent, insurance, utilities, and property taxes Prepaid Expenses Two analysis issues:
(1) For reasons of expediency, noncurrent prepaids sometimes are included among prepaid expenses classified as current--when their magnitude is large, they warrant scrutiny
(2) Any substantial changes in prepaid expenses warrant scrutiny Analysis of Prepaids Other current assets<br>
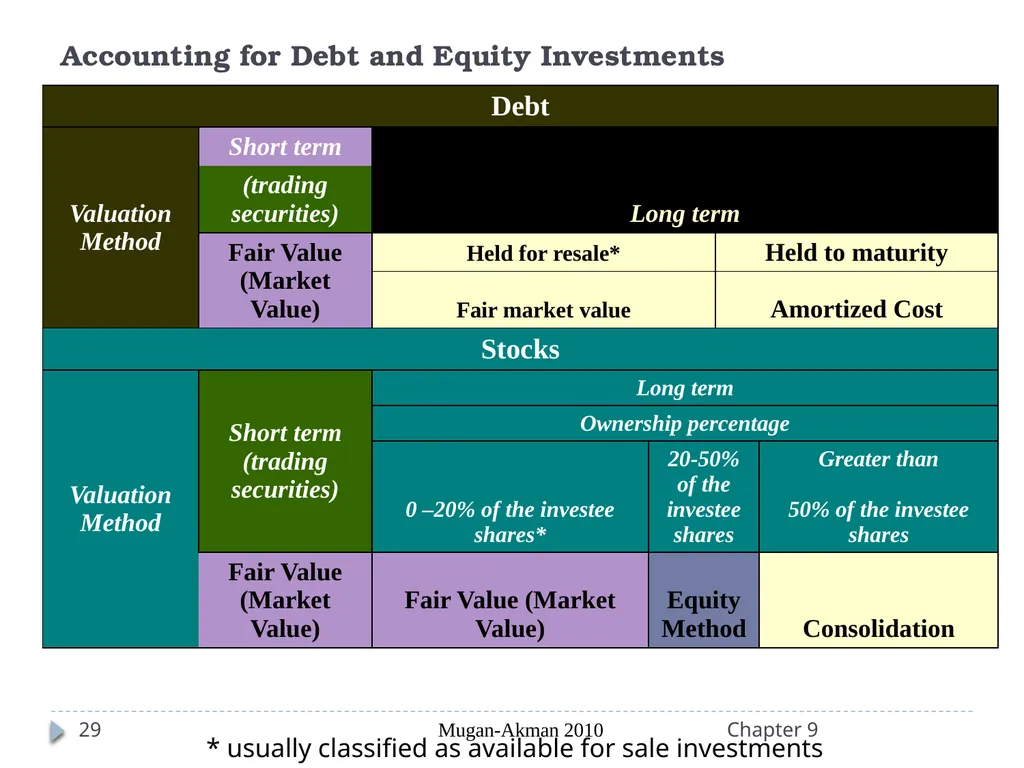
slide29. Chapter 9 Mugan-Akman 2010 29 Accounting for Debt and Equity Investments * usually classified as available for sale investments<br>
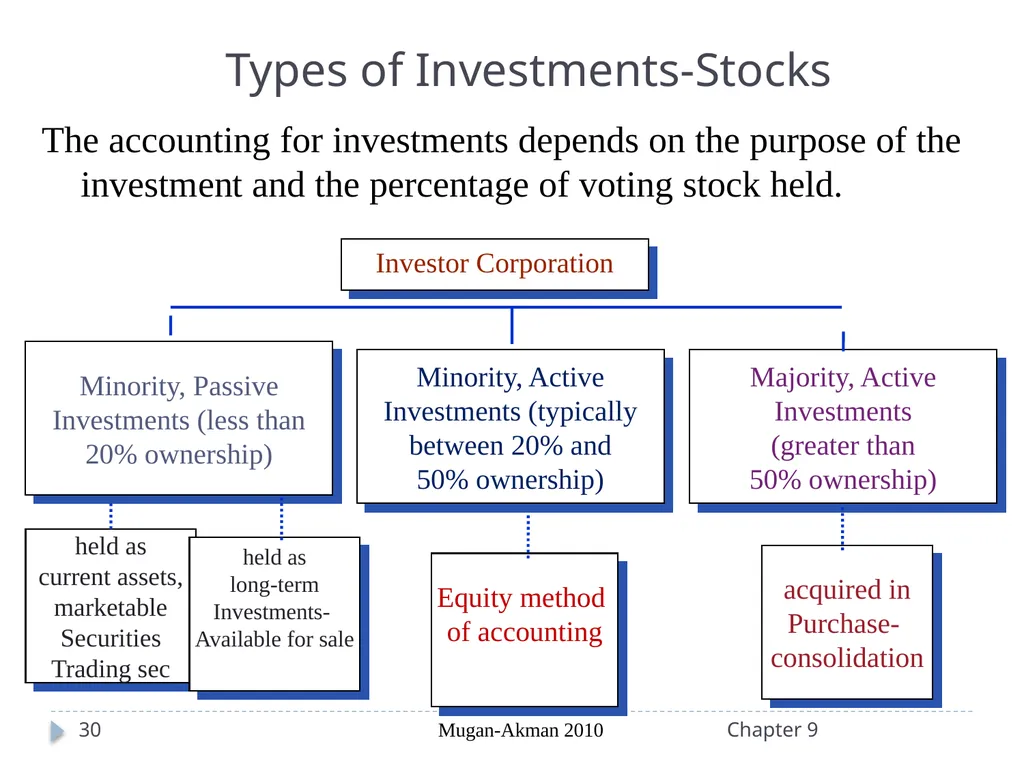
slide30. Chapter 9 Mugan-Akman 2010 30 Investor Corporation Minority, Active
Investments (typically
between 20% and
50% ownership) Majority, Active
Investments
(greater than
50% ownership) Minority, Passive
Investments (less than
20% ownership) held as
current assets,
marketable
Securities
Trading sec held as
long-term
Investments-
Available for sale acquired in
Purchase-
consolidation The accounting for investments depends on the purpose of the investment and the percentage of voting stock held. Types of Investments-Stocks Equity method
of accounting<br>
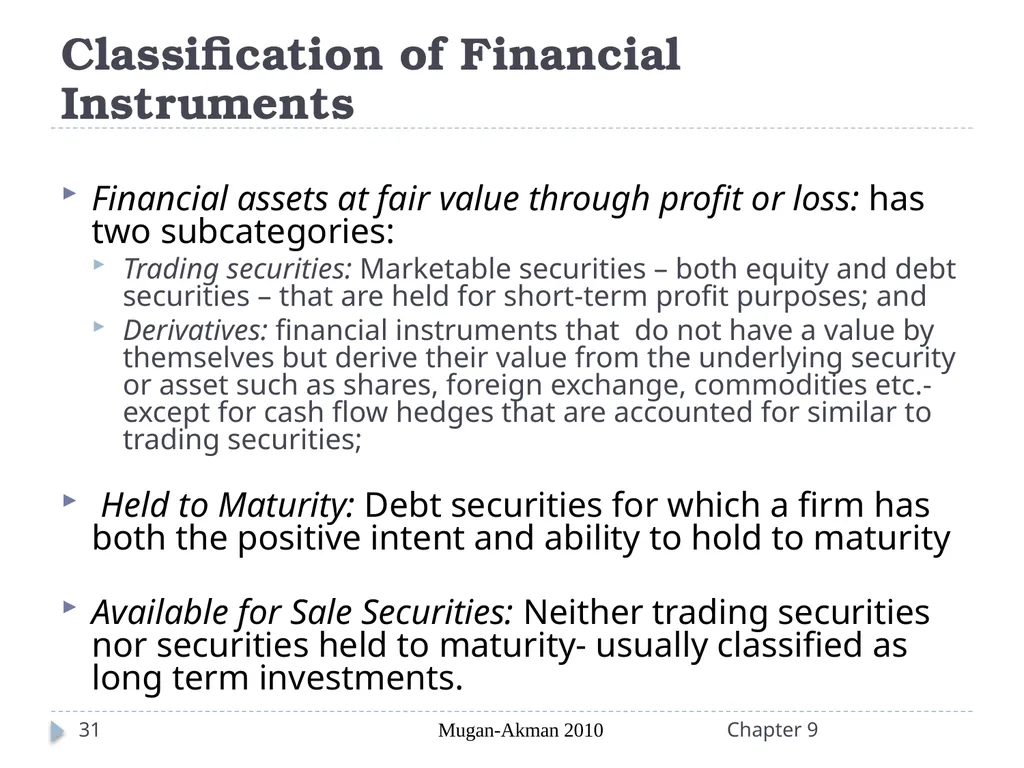
slide31. Chapter 9 Mugan-Akman 2010 31 Classification of Financial Instruments Financial assets at fair value through profit or loss: has two subcategories:
Trading securities: Marketable securities – both equity and debt securities – that are held for short-term profit purposes; and
Derivatives: financial instruments that do not have a value by themselves but derive their value from the underlying security or asset such as shares, foreign exchange, commodities etc.- except for cash flow hedges that are accounted for similar to trading securities;
Held to Maturity: Debt securities for which a firm has both the positive intent and ability to hold to maturity
Available for Sale Securities: Neither trading securities nor securities held to maturity- usually classified as long term investments.<br>
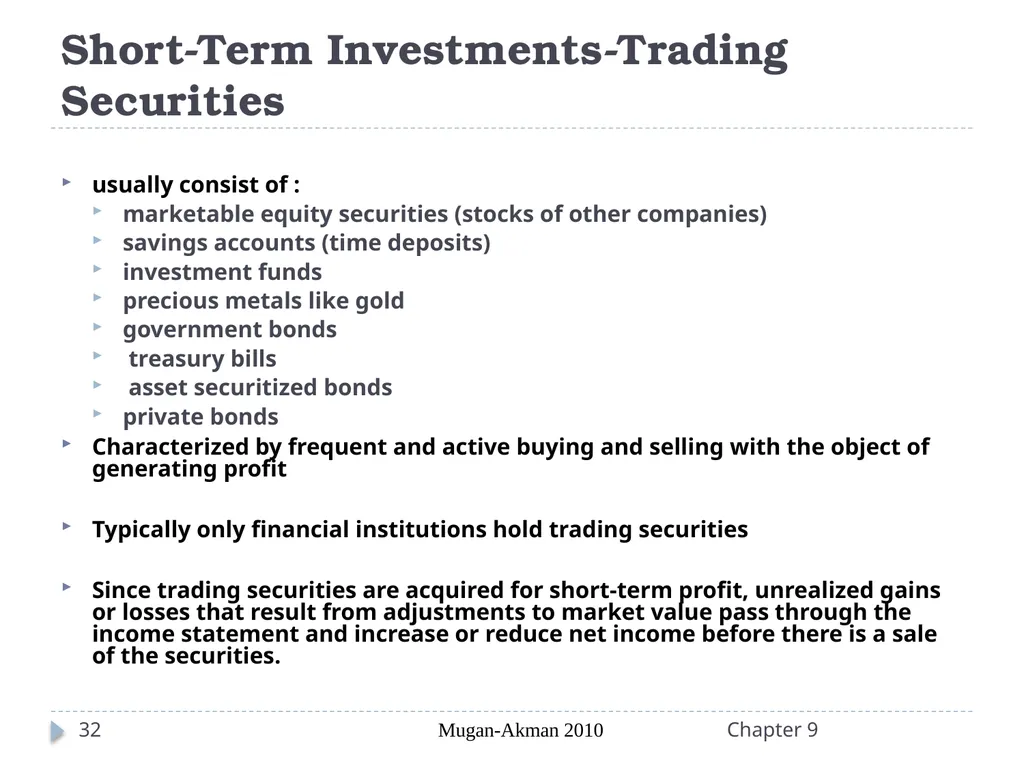
slide32. Chapter 9 Mugan-Akman 2010 32 Short-Term Investments-Trading Securities usually consist of :
marketable equity securities (stocks of other companies)
savings accounts (time deposits)
investment funds
precious metals like gold
government bonds
treasury bills
asset securitized bonds
private bonds
Characterized by frequent and active buying and selling with the object of generating profit
Typically only financial institutions hold trading securities
Since trading securities are acquired for short-term profit, unrealized gains or losses that result from adjustments to market value pass through the income statement and increase or reduce net income before there is a sale of the securities.<br>
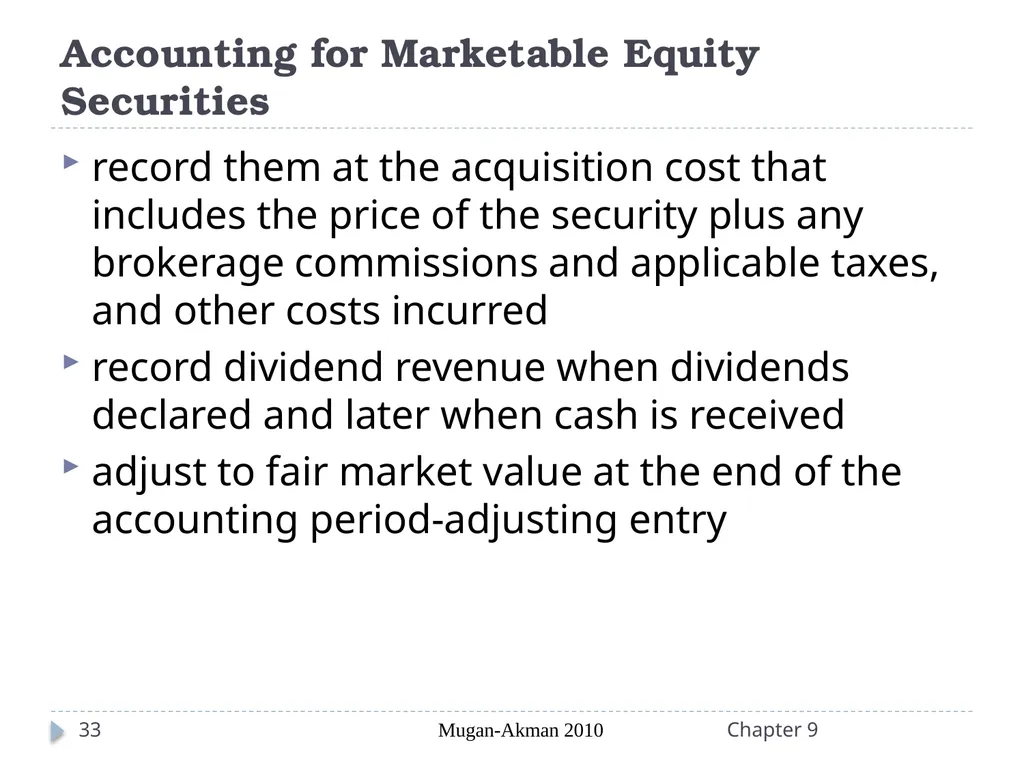
slide33. Chapter 9 Mugan-Akman 2010 33 Accounting for Marketable Equity Securities record them at the acquisition cost that includes the price of the security plus any brokerage commissions and applicable taxes, and other costs incurred
record dividend revenue when dividends declared and later when cash is received
adjust to fair market value at the end of the accounting period-adjusting entry<br>
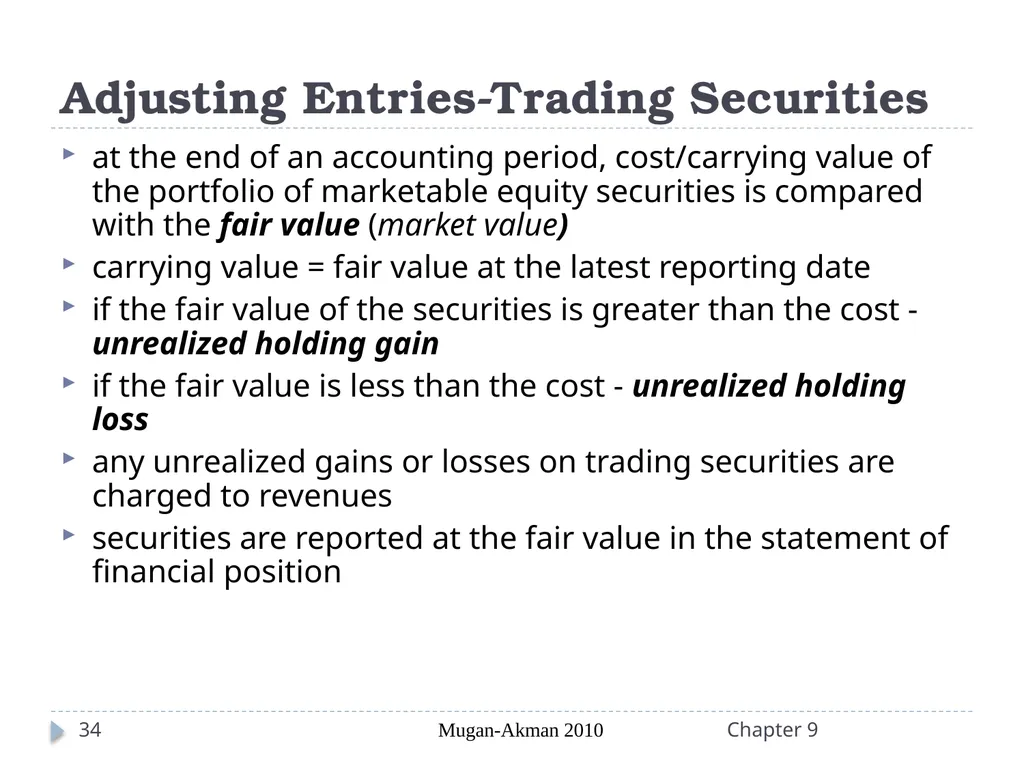
slide34. Adjusting Entries-Trading Securities Chapter 9 Mugan-Akman 2010 34 at the end of an accounting period, cost/carrying value of the portfolio of marketable equity securities is compared with the fair value (market value)
carrying value = fair value at the latest reporting date
if the fair value of the securities is greater than the cost -unrealized holding gain
if the fair value is less than the cost - unrealized holding loss
any unrealized gains or losses on trading securities are charged to revenues
securities are reported at the fair value in the statement of financial position<br>
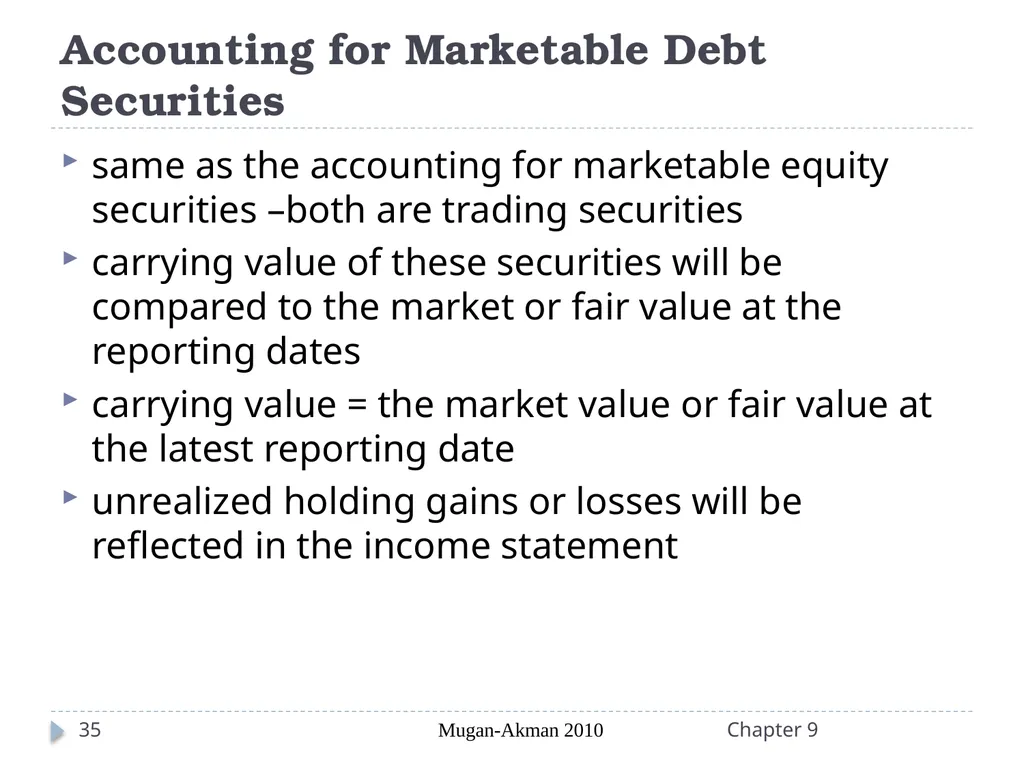
slide35. Chapter 9 Mugan-Akman 2010 35 Accounting for Marketable Debt Securities same as the accounting for marketable equity securities –both are trading securities
carrying value of these securities will be compared to the market or fair value at the reporting dates
carrying value = the market value or fair value at the latest reporting date
unrealized holding gains or losses will be reflected in the income statement<br>
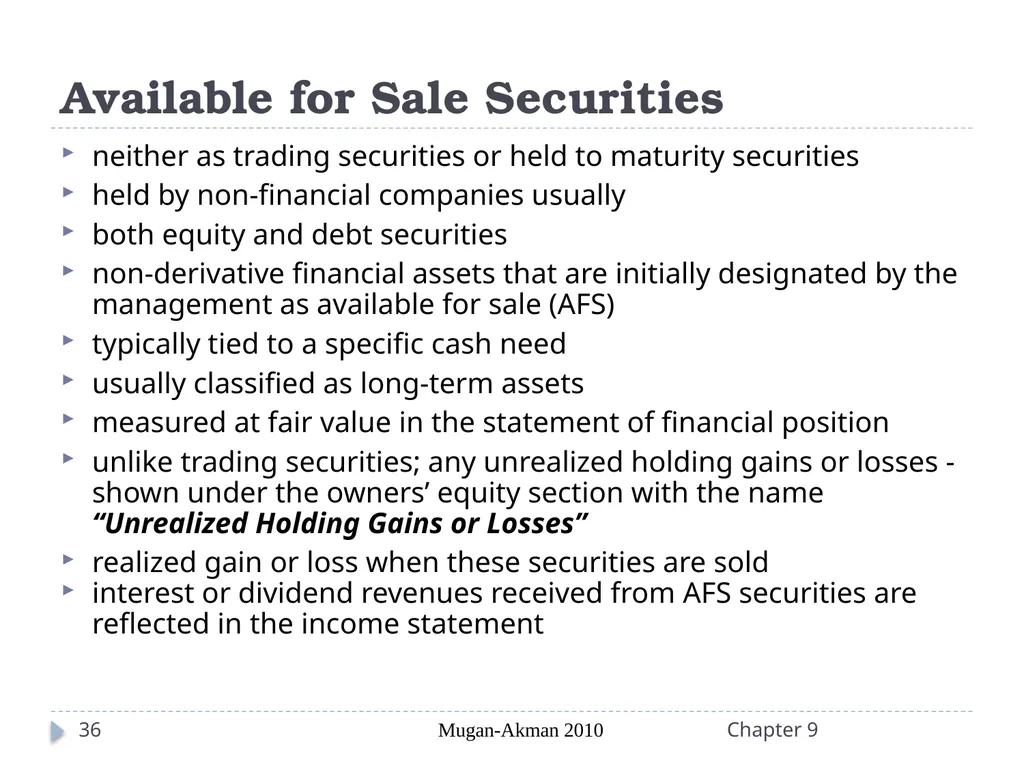
slide36. Available for Sale Securities Chapter 9 Mugan-Akman 2010 36 neither as trading securities or held to maturity securities
held by non-financial companies usually
both equity and debt securities
non-derivative financial assets that are initially designated by the management as available for sale (AFS)
typically tied to a specific cash need
usually classified as long-term assets
measured at fair value in the statement of financial position
unlike trading securities; any unrealized holding gains or losses - shown under the owners’ equity section with the name “Unrealized Holding Gains or Losses”
realized gain or loss when these securities are sold
interest or dividend revenues received from AFS securities are reflected in the income statement<br>
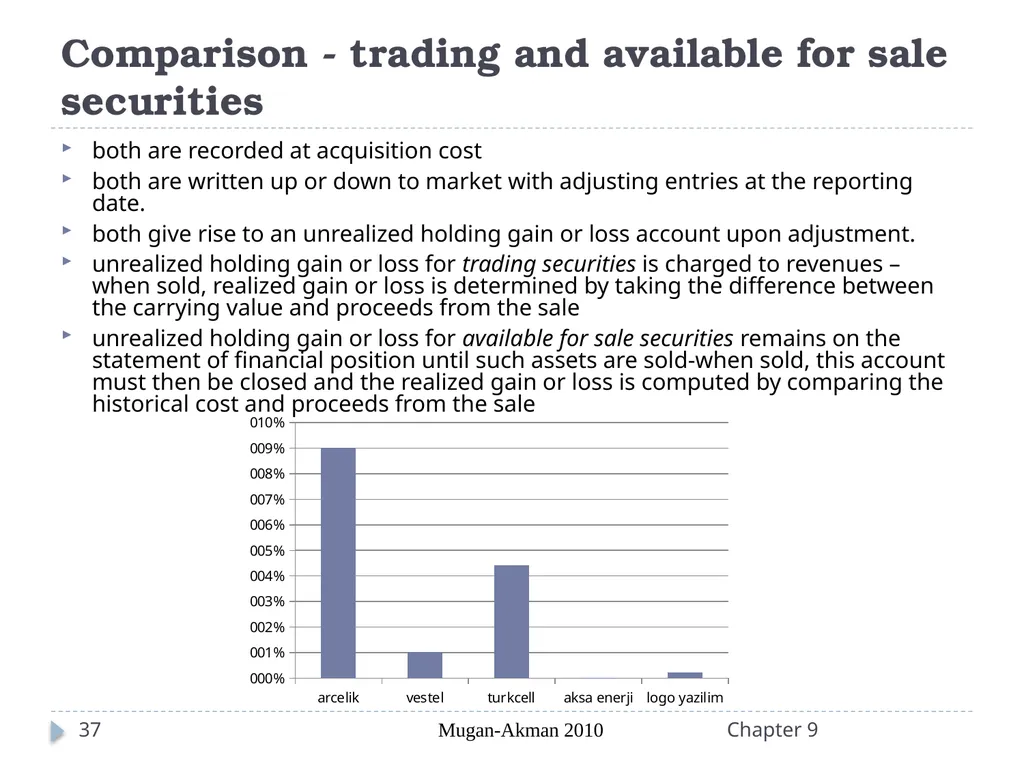
slide37. Comparison - trading and available for sale securities Chapter 9 Mugan-Akman 2010 37 both are recorded at acquisition cost
both are written up or down to market with adjusting entries at the reporting date.
both give rise to an unrealized holding gain or loss account upon adjustment.
unrealized holding gain or loss for trading securities is charged to revenues –when sold, realized gain or loss is determined by taking the difference between the carrying value and proceeds from the sale
unrealized holding gain or loss for available for sale securities remains on the statement of financial position until such assets are sold-when sold, this account must then be closed and the realized gain or loss is computed by comparing the historical cost and proceeds from the sale<br>
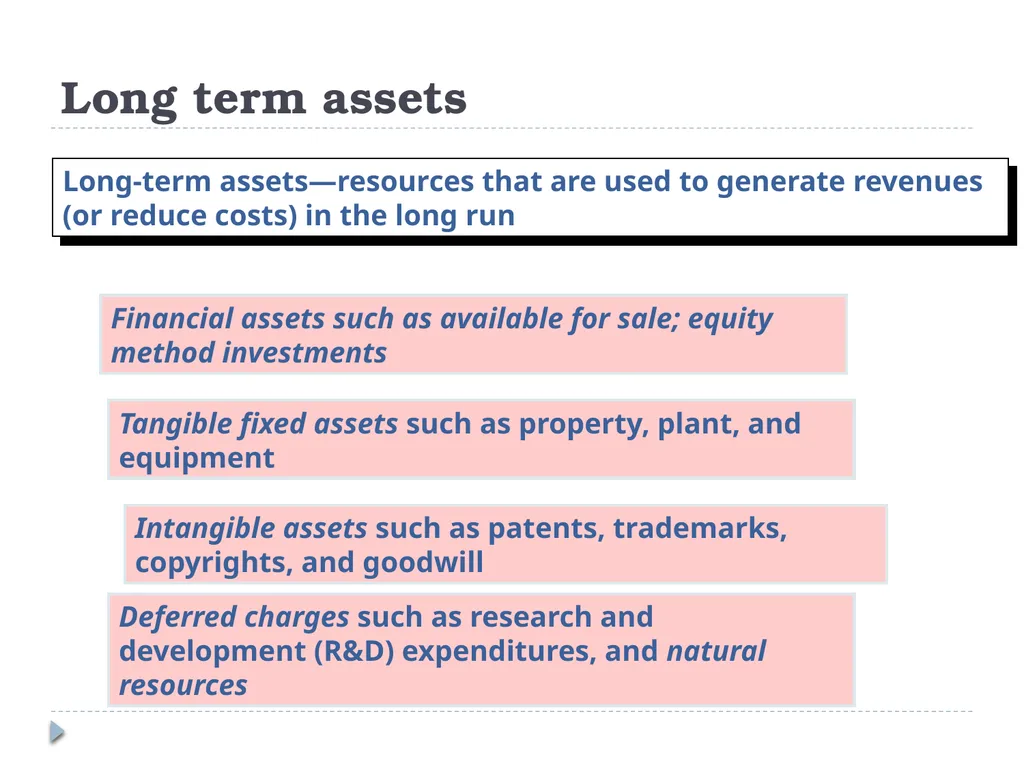
slide38. Long term assets Long-term assets—resources that are used to generate revenues (or reduce costs) in the long run Tangible fixed assets such as property, plant, and equipment Deferred charges such as research and development (R&D) expenditures, and natural resources Intangible assets such as patents, trademarks, copyrights, and goodwill Financial assets such as available for sale; equity method investments<br>
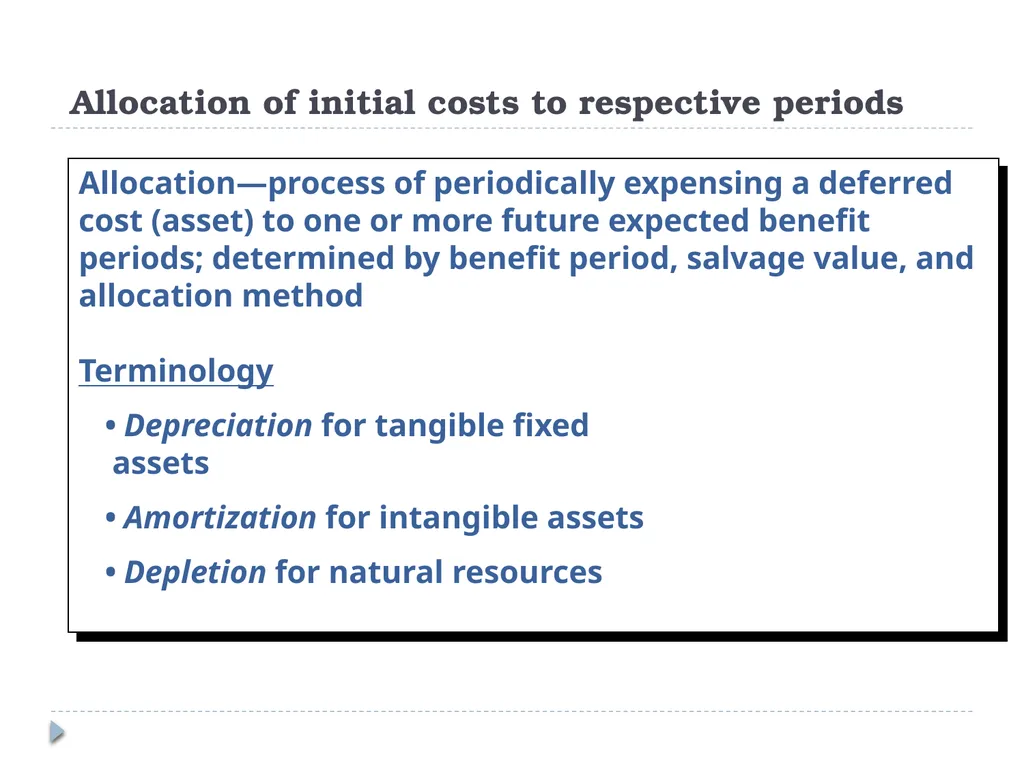
slide39. Allocation of initial costs to respective periods Allocation—process of periodically expensing a deferred cost (asset) to one or more future expected benefit periods; determined by benefit period, salvage value, and allocation method
Terminology
• Depreciation for tangible fixed
assets
• Amortization for intangible assets
• Depletion for natural resources<br>
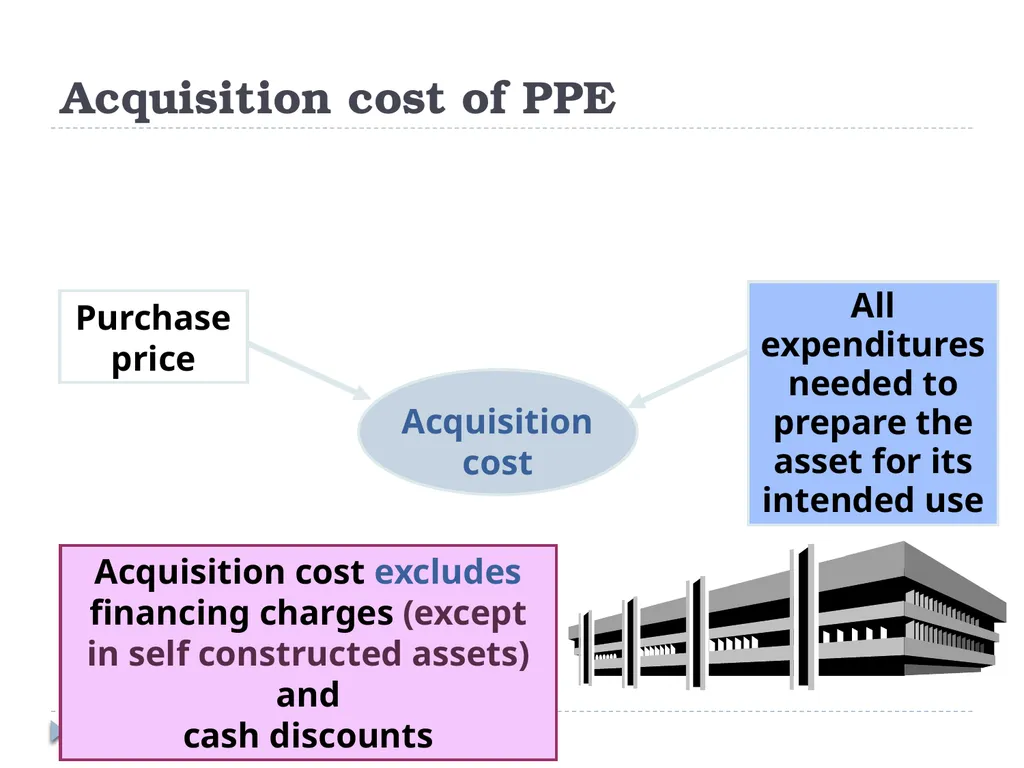
slide40. Acquisition cost excludes financing charges (except in self constructed assets) and cash discounts All expenditures needed to prepare the asset for its intended use Purchase price Acquisition cost of PPE<br>
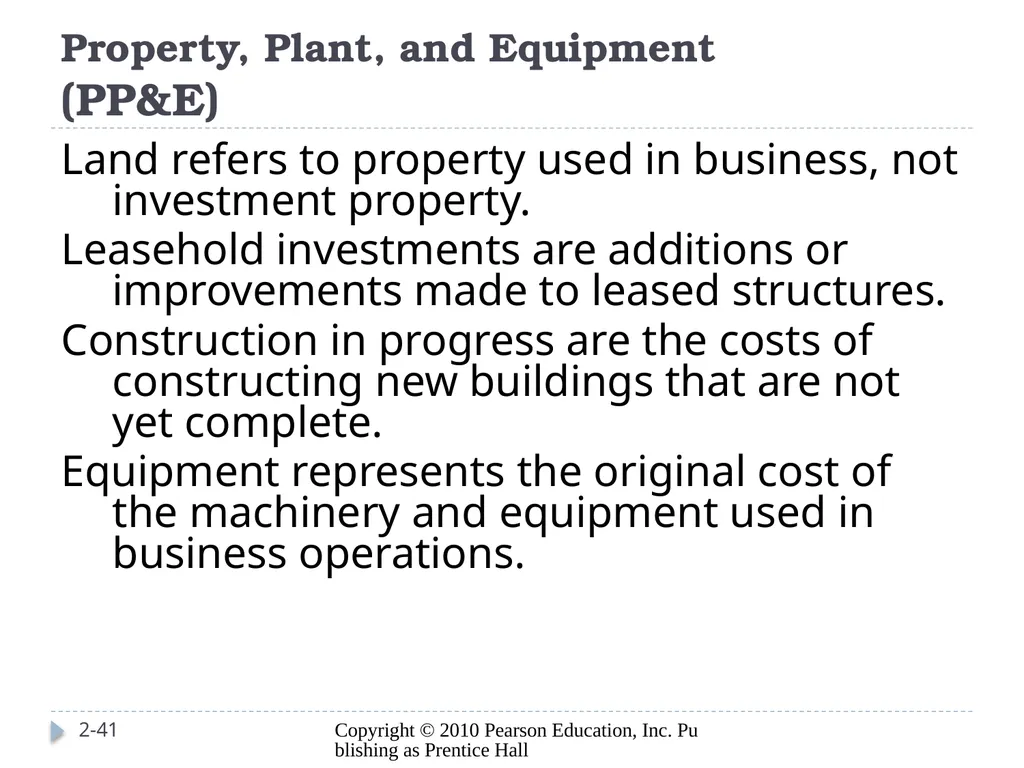
slide41. Property, Plant, and Equipment (PP&E) Copyright © 2010 Pearson Education, Inc. Publishing as Prentice Hall 2-41 Land refers to property used in business, not investment property.
Leasehold investments are additions or improvements made to leased structures.
Construction in progress are the costs of constructing new buildings that are not yet complete.
Equipment represents the original cost of the machinery and equipment used in business operations.<br>
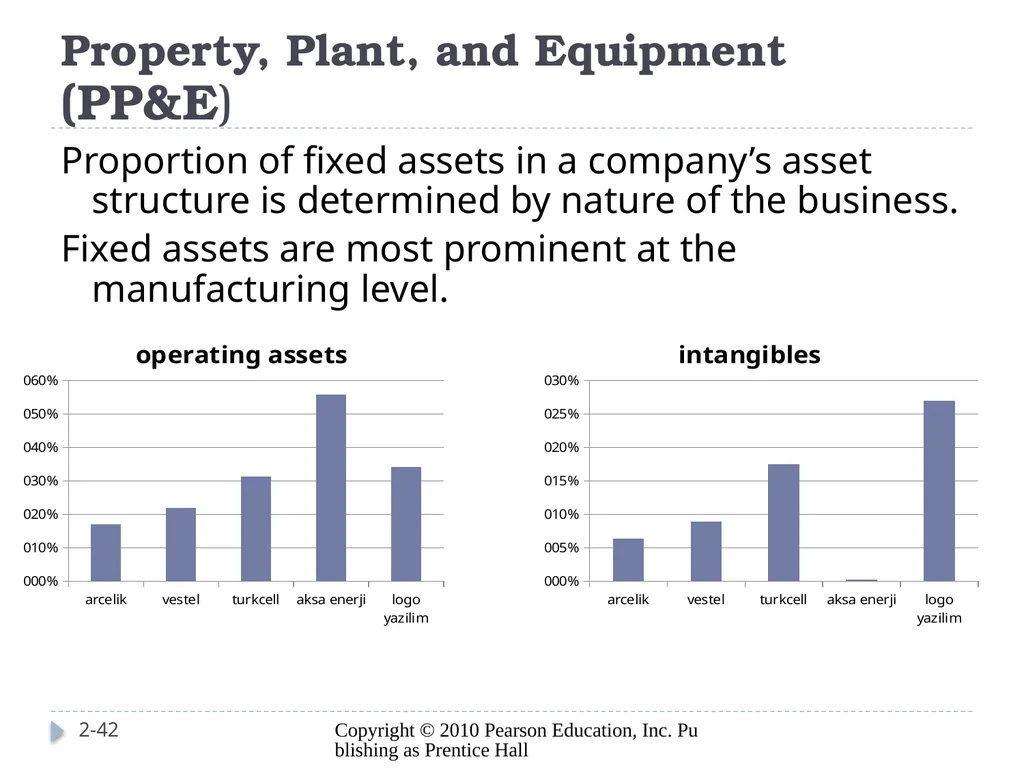
slide42. Property, Plant, and Equipment (PP&E) Copyright © 2010 Pearson Education, Inc. Publishing as Prentice Hall 2-42 Proportion of fixed assets in a company’s asset structure is determined by nature of the business.
Fixed assets are most prominent at the manufacturing level.<br>
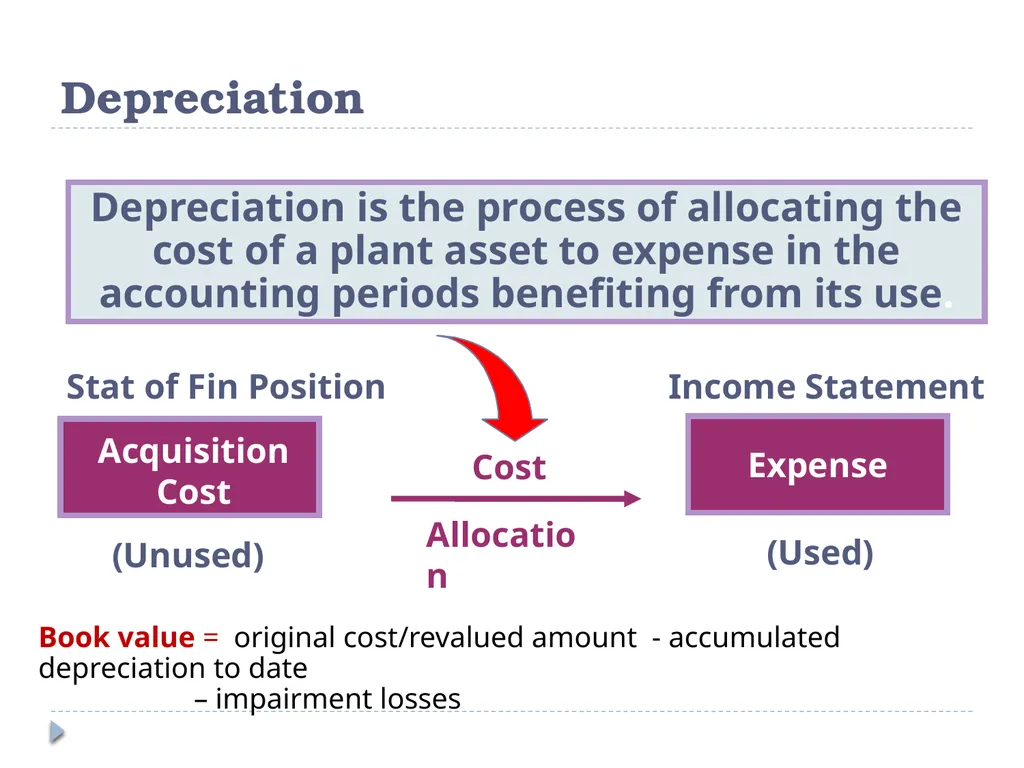
slide43. Depreciation is the process of allocating the cost of a plant asset to expense in the accounting periods benefiting from its use. Depreciation Book value = original cost/revalued amount - accumulated depreciation to date
– impairment losses<br>
slide44. Factors in Computing Depreciation The calculation of depreciation requires three amounts for each asset:
Cost.
Salvage Value.
Useful Life.
Depreciation Method<br>
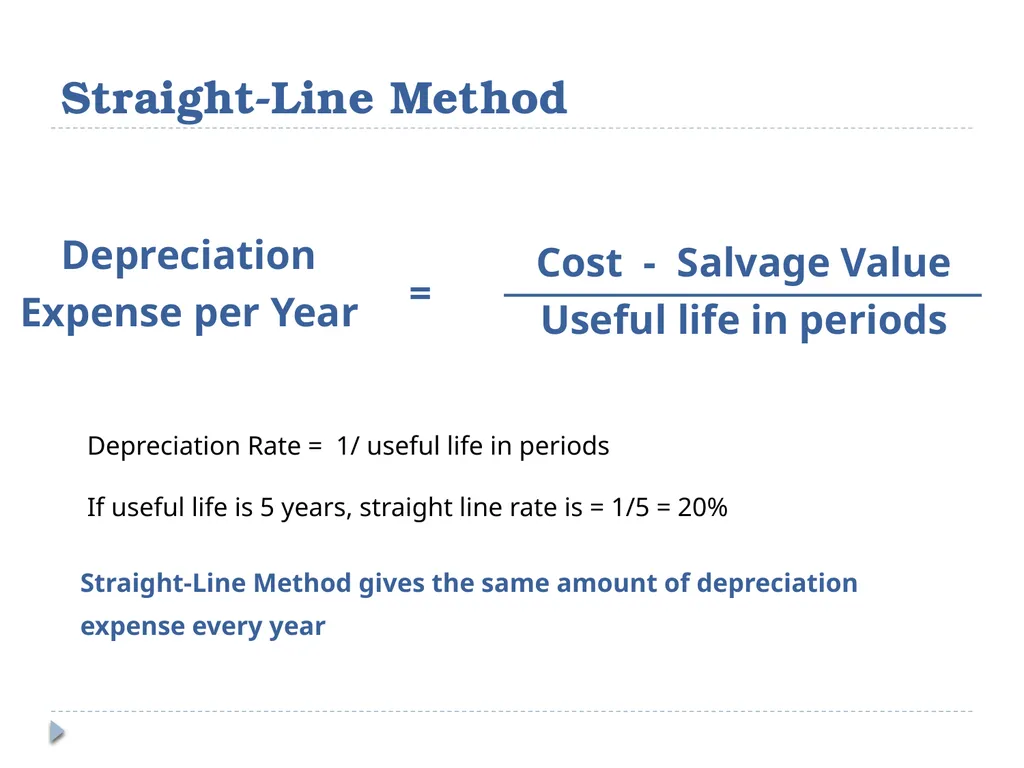
slide45. Cost - Salvage Value Useful life in periods Depreciation
Expense per Year = Straight-Line Method Depreciation Rate = 1/ useful life in periods
If useful life is 5 years, straight line rate is = 1/5 = 20% Straight-Line Method gives the same amount of depreciation
expense every year<br>
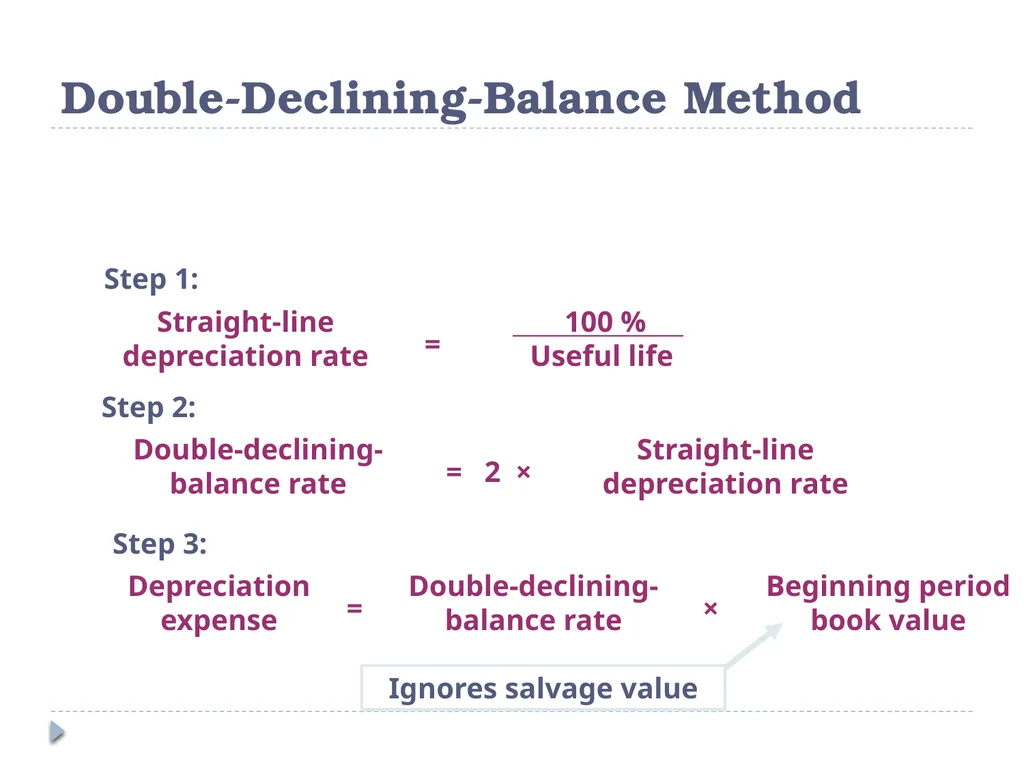
slide46. Step 1: Step 2: Step 3: Ignores salvage value Double-Declining-Balance Method<br>
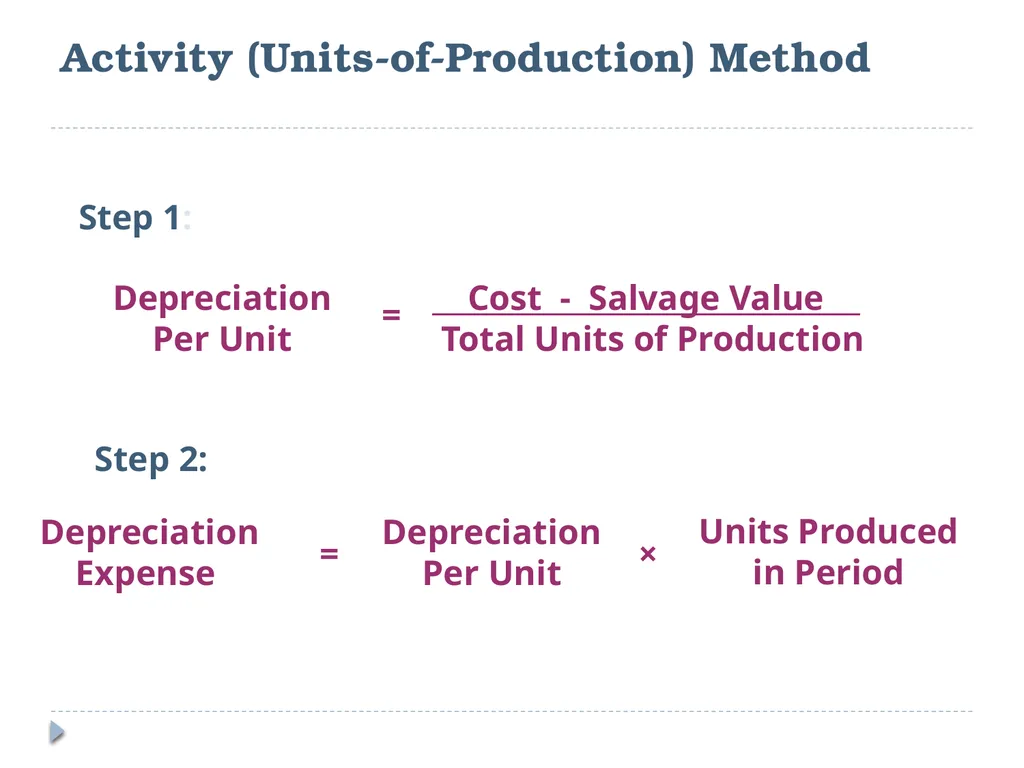
slide47. Step 1: Step 2: Activity (Units-of-Production) Method<br>
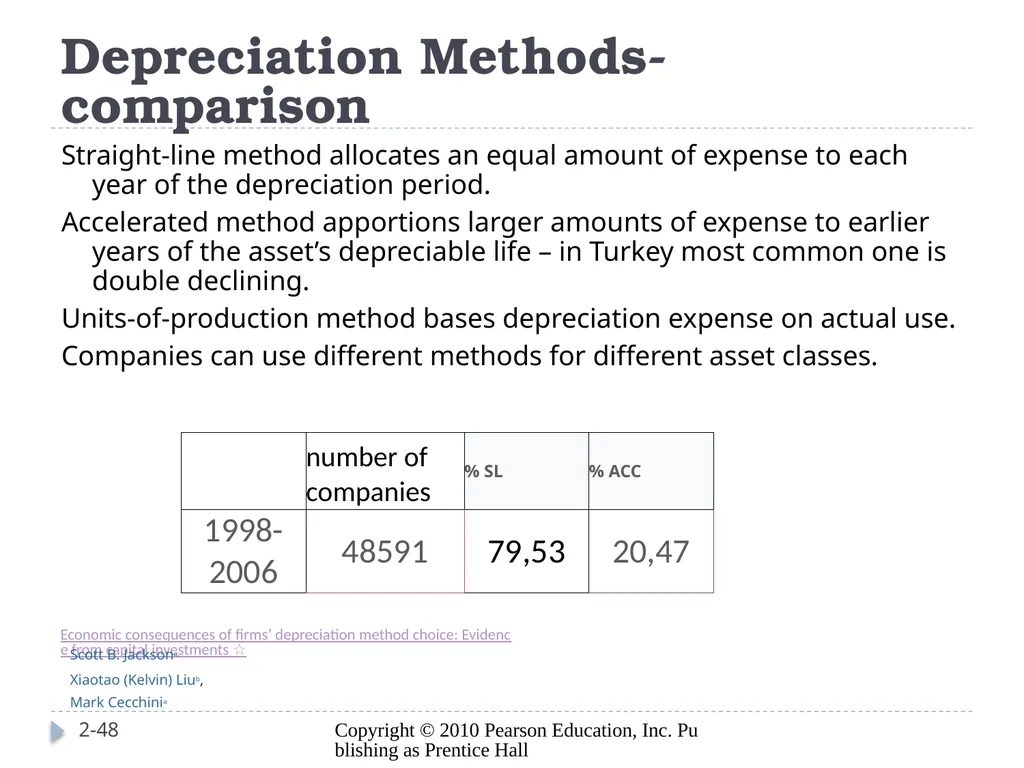
slide48. Depreciation Methods-comparison Copyright © 2010 Pearson Education, Inc. Publishing as Prentice Hall 2-48 Straight-line method allocates an equal amount of expense to each year of the depreciation period.
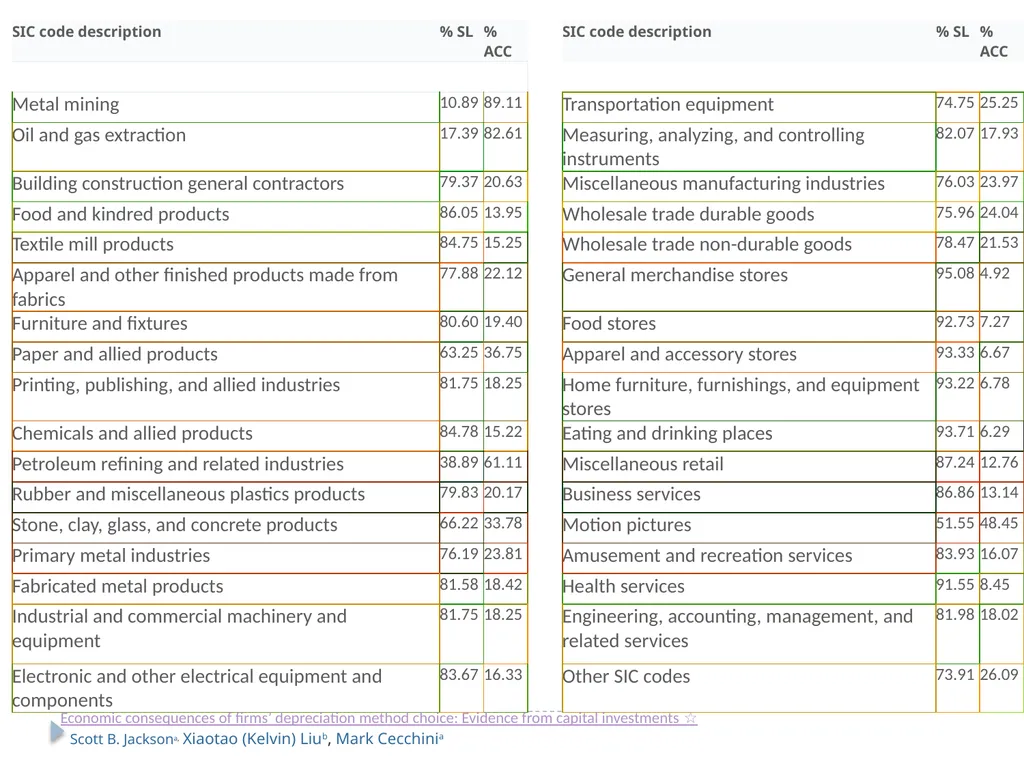
Accelerated method apportions larger amounts of expense to earlier years of the asset’s depreciable life – in Turkey most common one is double declining.
Units-of-production method bases depreciation expense on actual use.
Companies can use different methods for different asset classes.<br>
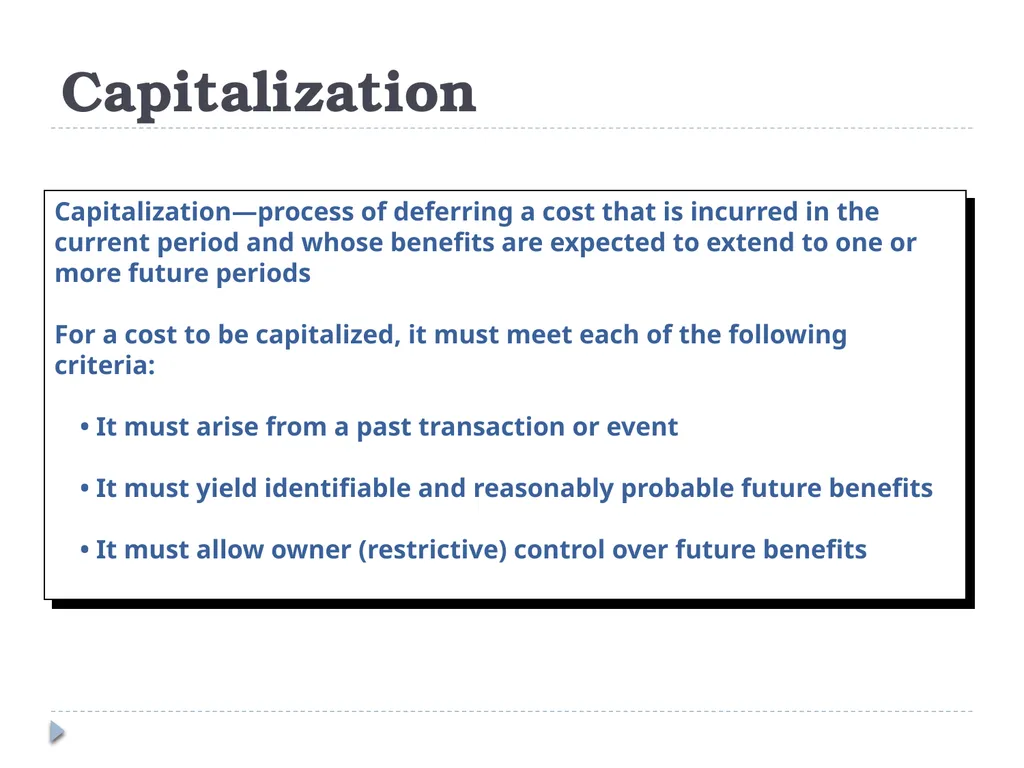
slide50. Capitalization Capitalization—process of deferring a cost that is incurred in the current period and whose benefits are expected to extend to one or more future periods
For a cost to be capitalized, it must meet each of the following criteria:
• It must arise from a past transaction or event
• It must yield identifiable and reasonably probable future benefits
• It must allow owner (restrictive) control over future benefits<br>
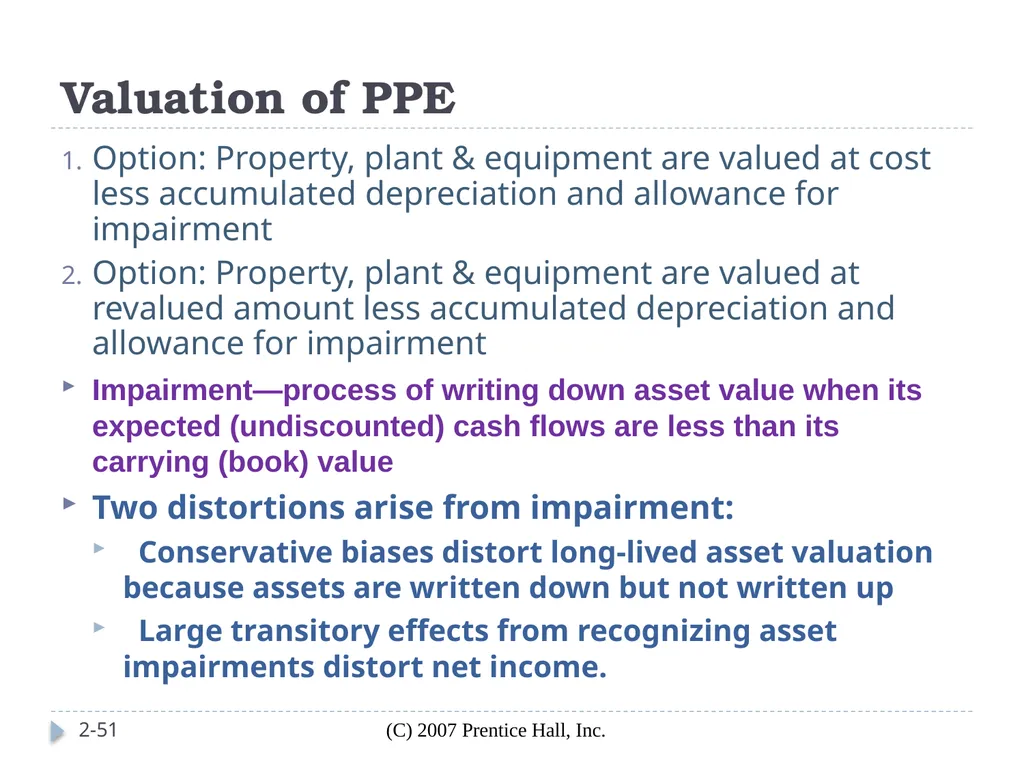
slide51. Valuation of PPE (C) 2007 Prentice Hall, Inc. 2-51 Option: Property, plant & equipment are valued at cost less accumulated depreciation and allowance for impairment
Option: Property, plant & equipment are valued at revalued amount less accumulated depreciation and allowance for impairment
Impairment—process of writing down asset value when its expected (undiscounted) cash flows are less than its carrying (book) value
Two distortions arise from impairment:
Conservative biases distort long-lived asset valuation because assets are written down but not written up
Large transitory effects from recognizing asset impairments distort net income.<br>
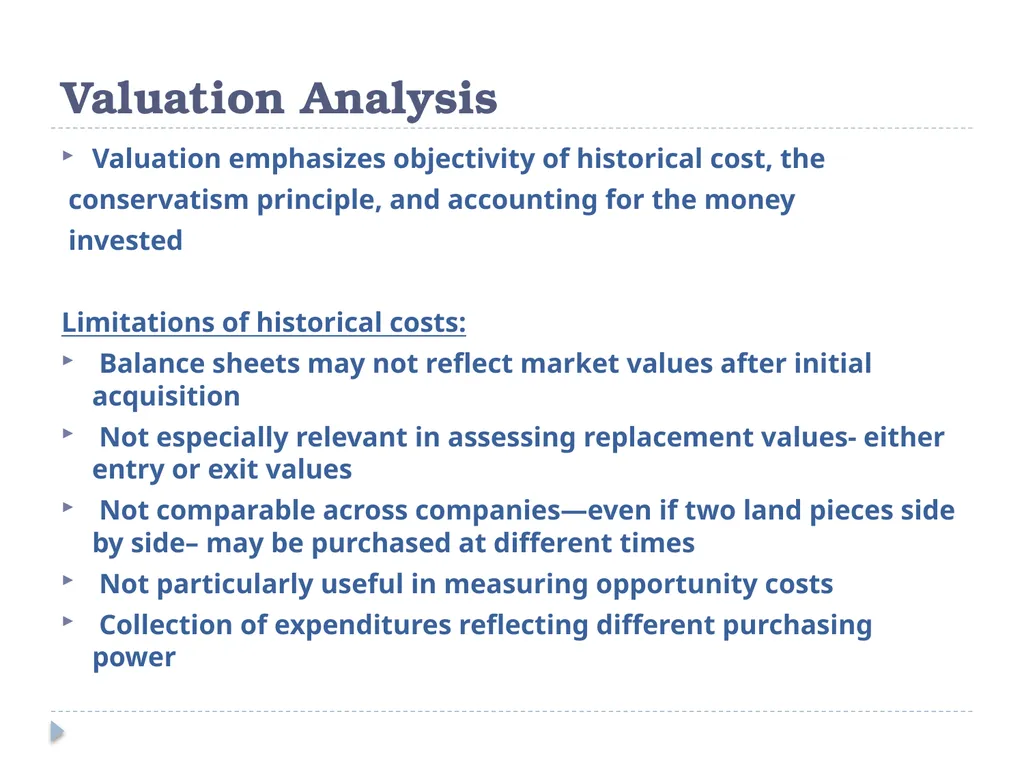
slide52. Valuation Analysis Valuation emphasizes objectivity of historical cost, the
conservatism principle, and accounting for the money
invested
Limitations of historical costs:
Balance sheets may not reflect market values after initial acquisition
Not especially relevant in assessing replacement values- either entry or exit values
Not comparable across companies—even if two land pieces side by side– may be purchased at different times
Not particularly useful in measuring opportunity costs
Collection of expenditures reflecting different purchasing power<br>
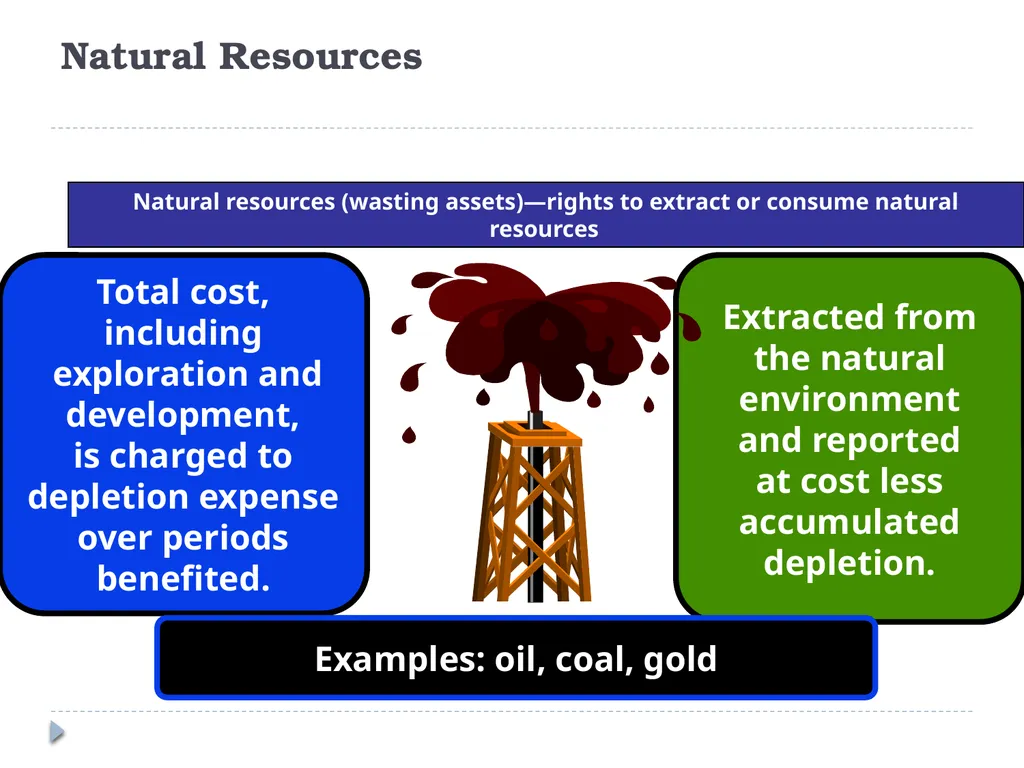
slide53. Total cost, including exploration and development, is charged to depletion expense over periods benefited. Extracted from the natural environment and reported at cost less accumulated depletion. Examples: oil, coal, gold Natural resources (wasting assets)—rights to extract or consume natural resources Natural Resources<br>
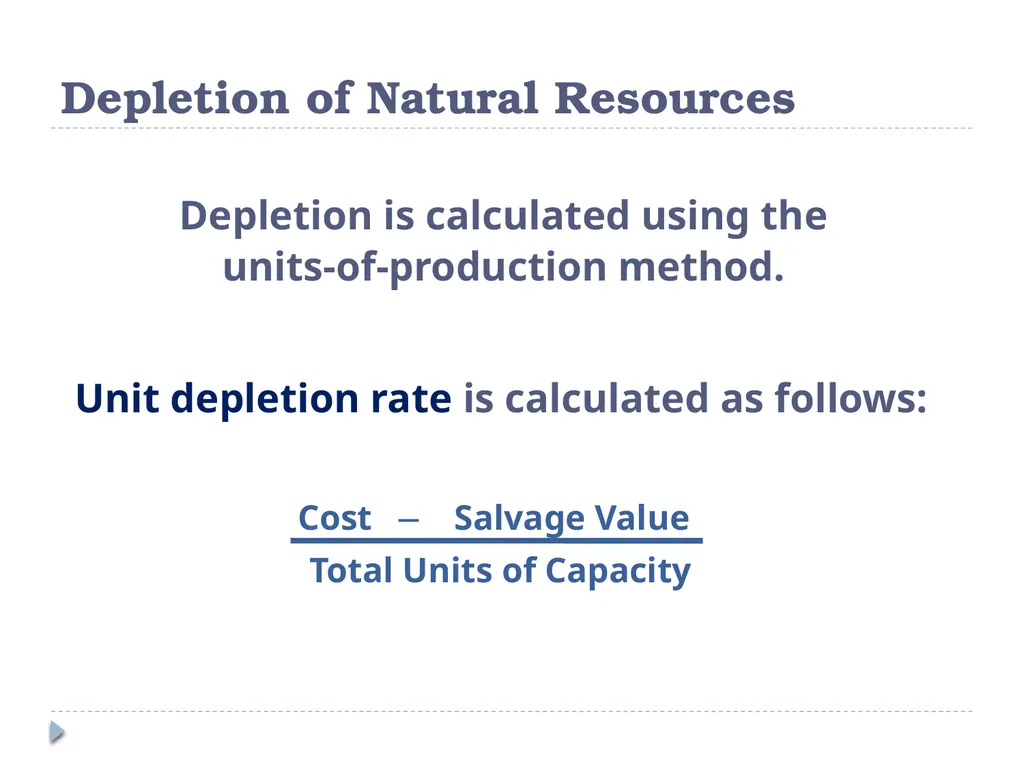
slide54. Depletion is calculated using the
units-of-production method. Unit depletion rate is calculated as follows: Depletion of Natural Resources<br>
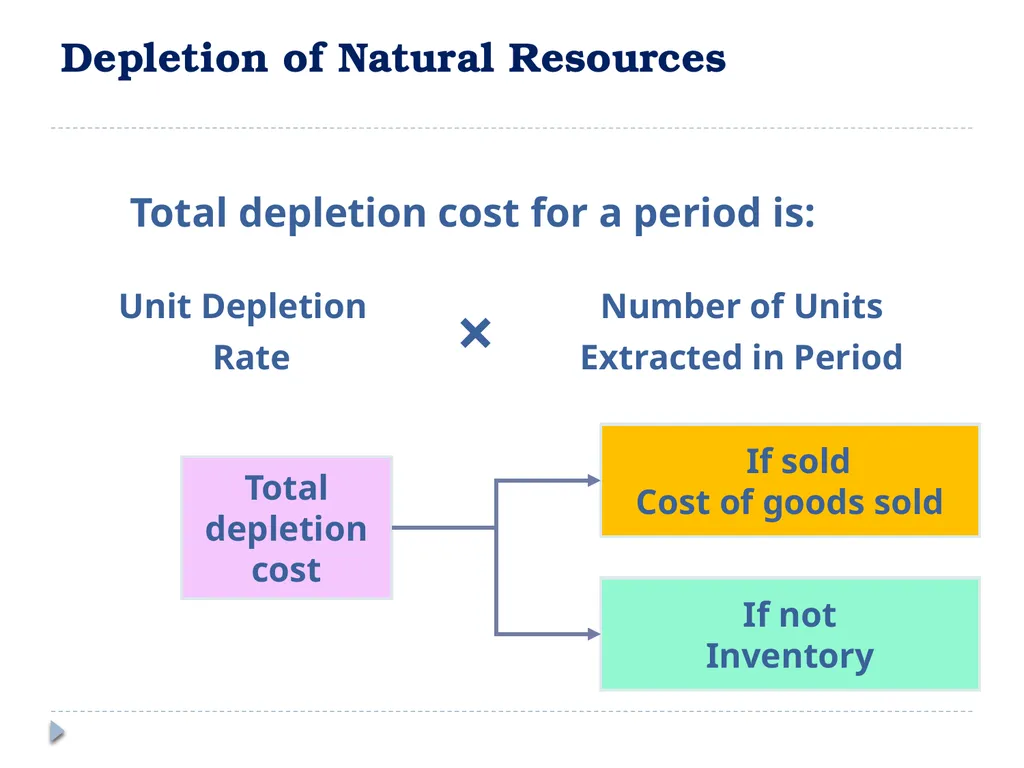
slide55. Depletion of Natural Resources Total depletion cost for a period is: Total depletion cost<br>
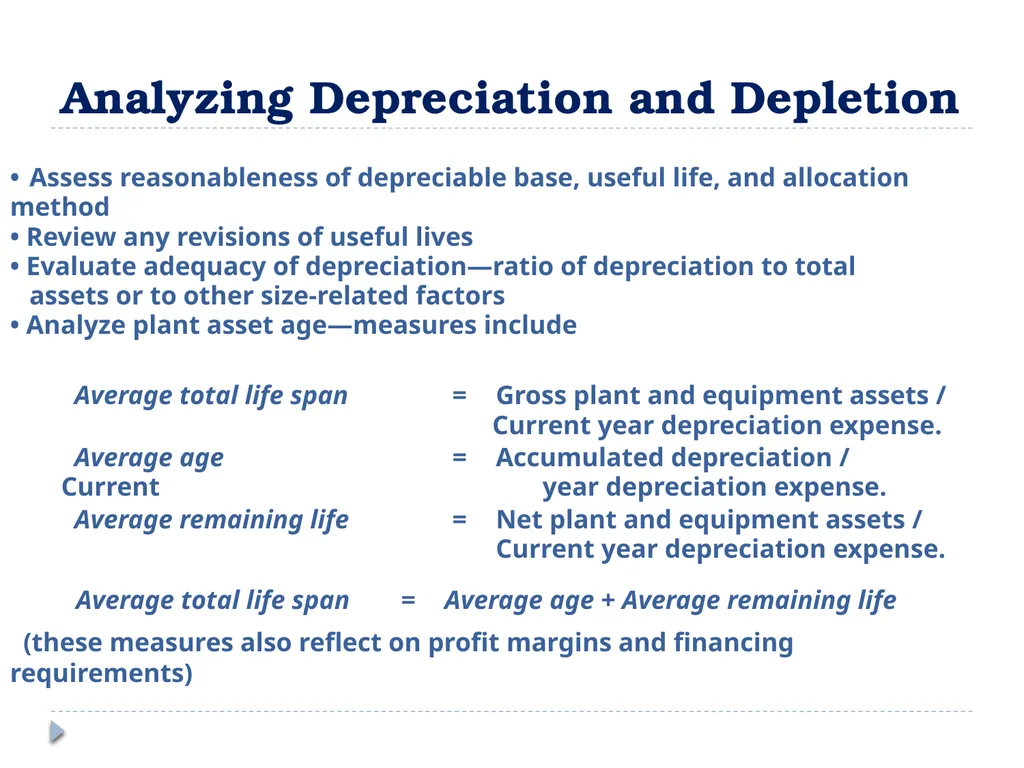
slide56. • Assess reasonableness of depreciable base, useful life, and allocation method
• Review any revisions of useful lives
• Evaluate adequacy of depreciation—ratio of depreciation to total assets or to other size-related factors
• Analyze plant asset age—measures include
Average total life span = Gross plant and equipment assets / Current year depreciation expense.
Average age = Accumulated depreciation / Current year depreciation expense.
Average remaining life = Net plant and equipment assets / Current year depreciation expense.
Average total life span = Average age + Average remaining life
(these measures also reflect on profit margins and financing requirements) Analyzing Depreciation and Depletion<br>
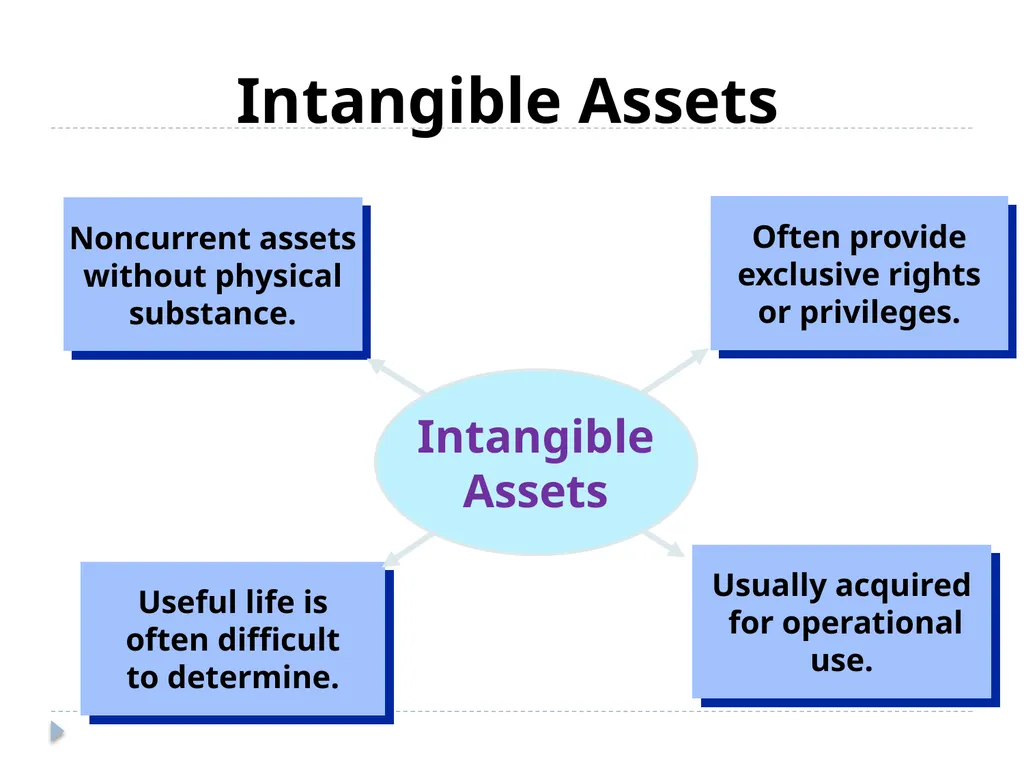
slide57. Noncurrent assets without physical substance. Useful life is often difficult to determine. Usually acquired for operational use. Intangible Assets Often provide exclusive rights or privileges. Intangible Assets<br>
slide58. Accounting for Intangible Assets Patents
Copyrights
Leaseholds
Leasehold Improvements
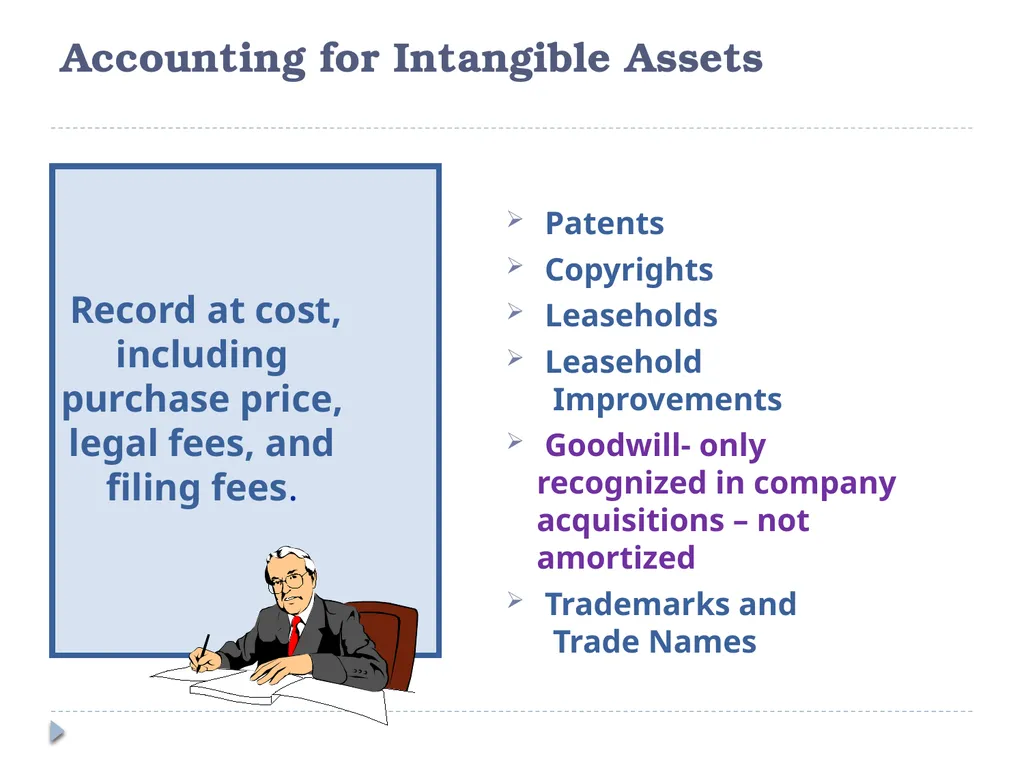
Goodwill- only recognized in company acquisitions – not amortized
Trademarks and Trade Names Record at cost, including purchase price, legal fees, and filing fees.<br>
slide59. Analyzing Intangibles and Goodwill Search for unrecorded intangibles and goodwill—often misvalued and most likely exist off-balance-sheet
Examine for unusually good earnings
as evidence of goodwill
Review amortization periods—
any likely bias is in the direction of less
amortization and can call for adjustments
Recognize goodwill has a limited useful life--whatever the advantages of location, market dominance, competitive stance, sales skill, or product acceptance, they are affected by changes in business<br>
slide60. Other Assets Copyright © 2010 Pearson Education, Inc. Publishing as Prentice Hall 2-60 Can include many other noncurrent items:
Property held for sale
Start-up costs in connection with a new business
Cash surrender value of life insurance policies
Long-term advance payments
Long-term investments<br>
slide2. The Balance Sheet Copyright © 2010 Pearson Education, Inc. Publishing as Prentice Hall 2-2 “Old accountants never die; they just lose their balance”
--Anonymous<br>
slide3. Current (Short-term) Assets Noncurrent (Long-term) Assets Resources or claims to resources that are expected to be sold, collected, or used within one year or the operating cycle, whichever is longer. Resources or claims to resources that are expected to yield benefits that extend beyond one year or the operating cycle, whichever is longer. Classification Assets<br>
slide5. 2-5 Common-Size Balance Sheet Expresses each item on the balance sheet as a percentage of total assets
Reveals the composition of assets
Form of vertical ratio analysis that allows comparison of firms
Useful for evaluating trends within a firm and to make industry comparisons<br>
slide8. Current Assets Copyright © 2010 Pearson Education, Inc. Publishing as Prentice Hall 2-8 Operating cycle
Time required to purchase or manufacture inventory, sell the product, and collect the cash
Working capital
Also called net working capital
Current assets less current liabilities<br>
slide9. Cash and Cash Equivalents Short-term, highly liquid investments that are:
Readily convertible to a known cash amount.
Close to maturity date and not sensitive to interest rate changes
Companies risk a reduction in liquidity should the market value of short-term investments decline
Cash and cash equivalents are sometimes required to be maintained as compensating balances to support existing borrowing arrangements or as collateral for indebtedness.<br>
slide10. Receivables Receivables are amounts due from others that arise from the sale of goods or services, or the loaning of money
Accounts receivable refer to oral promises of indebtedness due from customers
Notes receivable refer to formal written promises of indebtedness due from others<br>
slide11. Receivables are reported at their net realizable value — total amount of receivables less an allowance for uncollectible accounts
Management estimates the allowance for uncollectibles based on experience, customer fortunes, economy and industry expectations, and collection policies Valuation of Receivables<br>
slide12. TURKCELL Allowance for doubtful receivables
During the current year, the Group has changed its accounting estimates regarding the determination of allowance for doubtful receivables.
Formerly, the allowance for doubtful receivables was based on management’s evaluation of the volume of the receivables outstanding, historical collection trends and general economic conditions. With the new accounting estimate, the Group maintains an allowance for doubtful receivables for estimated losses resulting from the inability of the Group’s subscribers and customers to make required payments.
The Group bases the allowance on the likelihood of recoverability of trade and other receivables based on the aging of the balances, historical collection trends and general economic conditions. The allowance is periodically reviewed.
The allowance charged to expenses is determined in respect of receivable balances, calculated as a specified percentage of the outstanding balance in each aging group, with the percentage of the allowance increasing as the aging of the receivable becomes longer.
This change is accounted as a change in accounting estimates in accordance with IAS 8 “Accounting Policies, Changes in Accounting Estimates and Errors”. Based on the evaluation performed, the change in the estimates regarding the determination of allowance for doubtful receivables caused the following impact on bad debt provision expense:
Bad debt expense for the year ended 31 December 2010
Previous accounting estimate127,921
Current accounting estimate 126,257
Impact 1,664
Due to the impracticability, the Group has not disclosed the effect of the change for the future periods.<br>
slide13. Arcelik<br>
slide14. Assessment of earnings quality is often affected by an analysis of receivables and their collectibility
Analysis must be alert to changes in the allowance—computed relative to sales, receivables, or industry and market conditions.
Two special analysis questions:
(1) Collection Risk
Review allowance for uncollectibles in light of industry conditions
Apply special tools for analyzing collectibility:
• Determining competitors’ receivables as a percent of sales—vis-à-vis the company under analysis
• Examining customer concentration—risk increases when receivables are concentrated in one or a few customers
• Investigating the age pattern of receivables—overdue and for how long
• Determining portion of receivables that is a renewal of prior receivables
• Analyzing adequacy of allowances for discounts, returns, and other credits
(2) Authenticity of Receivables
Review credit policy for changes
Review return policies for changes
Review any contingencies on receivables Analyzing Receivables<br>
slide15. Receivables are Carried at Amortized Cost (C) 2007 Prentice Hall, Inc. 2-15 When sales are made on credit, the interest imputed in the transaction is not recognized as sales revenue but as INTEREST INCOME
By using the Effective Interest Method<br>
slide16. Illustration (C) 2007 Prentice Hall, Inc. 2-16 The sales price of TL 52.000 was charged to customer for a sales on credit (n/90) on 1 November. If the same goods were sold at cash, the price would have been TL 50.000
The effective interest rate for the transaction is:<br>
slide17. (C) 2007 Prentice Hall, Inc. 2-17 Present Value of 52,000 at the end of the year – 30 days remain to payment day<br>
slide18. Securitization (or factoring) is when a company sells all or a portion of its receivables to a third party
Receivables can be sold with or without recourse to a buyer (recourse refers to guarantee of collectibility)
Sale of receivables with recourse does not effectively transfer risk of ownership Securitization of Receivables For securitizations with any type of recourse, the seller must record both an asset and a compensating liability for the amount factored
For securitizations without any recourse, the seller removes the receivables from the balance sheet<br>
slide19. Inventories-Definitions Inventories are goods held for sale, or goods acquired (or in process of being readied) for sale, as part of a company’s normal operations
Expensing treats inventory costs like period costs—costs are reported in the period when incurred
Capitalizing treats inventory costs like product costs—costs are capitalized as an asset and subsequently charged against future period(s) revenues benefiting
from their sale<br>
slide20. Use of Inventory Methods in Practice Inventory Costing Method<br>
slide21. Costs of Goods Sold Ending Inventory Oldest Costs Recent Costs First-In, First-Out (FIFO) Cost Flow of Inventories<br>
slide22. Costs of Goods Sold Ending Inventory Recent Costs Oldest Costs Last-In, First-Out (LIFO) Cost Flow of Inventories<br>
slide23. Average Cost When a unit is sold, the average cost of each unit in inventory is assigned to cost of goods sold. ÷<br>
slide24. Inventory Accounting Methods (C) 2007 Prentice Hall, Inc. 2-24 Inventory valuation may significantly affect BOTH the balance sheet and the income statement and thus the financial ratios based on these statements
Disclosure of inventory cost flow assumption found in notes
Inventory reported on balance sheet at LOWER OF COST OR MARKET (net realizable value)
Checked for impairment annually
Companies may use more than one method for inventories<br>
slide25. Inventory on January 1, Year 2 40 @ $500 $ 20,000
Inventories purchased
during the year 60 @ $600 36,000
Cost of Goods available
for sale 100 units $ 56,000
Note: 30 units are sold in Year 2 for $800 each for total Revenue of $24,000 Illustration of Costing Methods<br>
slide26. Beginning Net Cost of Ending Inventory + Purchases = Goods Sold + Inventory
FIFO $20,000 + $36,000 = $15,000 + $41,000
LIFO $20,000 + $36,000 = $18,000 + $38,000
Average $20,000 + $36,000 = $16,800 + $39,200
Assume sales of $35,000 for the period—then gross profit under each method is:
Sales – Cost of Goods Sold = Gross Profit
FIFO $24,000 -- 15,000 = $9,000
LIFO $24,000 -- 18,000 = $6,000
Average $24,000 -- 16,800 = $7,200 Illustration of Costing Methods<br>
slide27. Economic Profit vs. Holding Gain In periods of rising prices, FIFO produces higher gross profits than LIFO because lower cost inventories are matched against sales revenues at current market prices. This is sometimes referred to as FIFO’s phantom profits.
The FIFO gross profit is actually a sum of two components: an economic profit and a holding gain:
Economic profit = 30 units x ($800 - $600) = $6,000
Holding gain = 30 units x ($600 - $500) = $3,000<br>
slide28. Prepaid expenses are advance payments for services or goods not yet received that extend beyond the current accounting period—examples are advance payments for rent, insurance, utilities, and property taxes Prepaid Expenses Two analysis issues:
(1) For reasons of expediency, noncurrent prepaids sometimes are included among prepaid expenses classified as current--when their magnitude is large, they warrant scrutiny
(2) Any substantial changes in prepaid expenses warrant scrutiny Analysis of Prepaids Other current assets<br>
slide29. Chapter 9 Mugan-Akman 2010 29 Accounting for Debt and Equity Investments * usually classified as available for sale investments<br>
slide30. Chapter 9 Mugan-Akman 2010 30 Investor Corporation Minority, Active
Investments (typically
between 20% and
50% ownership) Majority, Active
Investments
(greater than
50% ownership) Minority, Passive
Investments (less than
20% ownership) held as
current assets,
marketable
Securities
Trading sec held as
long-term
Investments-
Available for sale acquired in
Purchase-
consolidation The accounting for investments depends on the purpose of the investment and the percentage of voting stock held. Types of Investments-Stocks Equity method
of accounting<br>
slide31. Chapter 9 Mugan-Akman 2010 31 Classification of Financial Instruments Financial assets at fair value through profit or loss: has two subcategories:
Trading securities: Marketable securities – both equity and debt securities – that are held for short-term profit purposes; and
Derivatives: financial instruments that do not have a value by themselves but derive their value from the underlying security or asset such as shares, foreign exchange, commodities etc.- except for cash flow hedges that are accounted for similar to trading securities;
Held to Maturity: Debt securities for which a firm has both the positive intent and ability to hold to maturity
Available for Sale Securities: Neither trading securities nor securities held to maturity- usually classified as long term investments.<br>
slide32. Chapter 9 Mugan-Akman 2010 32 Short-Term Investments-Trading Securities usually consist of :
marketable equity securities (stocks of other companies)
savings accounts (time deposits)
investment funds
precious metals like gold
government bonds
treasury bills
asset securitized bonds
private bonds
Characterized by frequent and active buying and selling with the object of generating profit
Typically only financial institutions hold trading securities
Since trading securities are acquired for short-term profit, unrealized gains or losses that result from adjustments to market value pass through the income statement and increase or reduce net income before there is a sale of the securities.<br>
slide33. Chapter 9 Mugan-Akman 2010 33 Accounting for Marketable Equity Securities record them at the acquisition cost that includes the price of the security plus any brokerage commissions and applicable taxes, and other costs incurred
record dividend revenue when dividends declared and later when cash is received
adjust to fair market value at the end of the accounting period-adjusting entry<br>
slide34. Adjusting Entries-Trading Securities Chapter 9 Mugan-Akman 2010 34 at the end of an accounting period, cost/carrying value of the portfolio of marketable equity securities is compared with the fair value (market value)
carrying value = fair value at the latest reporting date
if the fair value of the securities is greater than the cost -unrealized holding gain
if the fair value is less than the cost - unrealized holding loss
any unrealized gains or losses on trading securities are charged to revenues
securities are reported at the fair value in the statement of financial position<br>
slide35. Chapter 9 Mugan-Akman 2010 35 Accounting for Marketable Debt Securities same as the accounting for marketable equity securities –both are trading securities
carrying value of these securities will be compared to the market or fair value at the reporting dates
carrying value = the market value or fair value at the latest reporting date
unrealized holding gains or losses will be reflected in the income statement<br>
slide36. Available for Sale Securities Chapter 9 Mugan-Akman 2010 36 neither as trading securities or held to maturity securities
held by non-financial companies usually
both equity and debt securities
non-derivative financial assets that are initially designated by the management as available for sale (AFS)
typically tied to a specific cash need
usually classified as long-term assets
measured at fair value in the statement of financial position
unlike trading securities; any unrealized holding gains or losses - shown under the owners’ equity section with the name “Unrealized Holding Gains or Losses”
realized gain or loss when these securities are sold
interest or dividend revenues received from AFS securities are reflected in the income statement<br>
slide37. Comparison - trading and available for sale securities Chapter 9 Mugan-Akman 2010 37 both are recorded at acquisition cost
both are written up or down to market with adjusting entries at the reporting date.
both give rise to an unrealized holding gain or loss account upon adjustment.
unrealized holding gain or loss for trading securities is charged to revenues –when sold, realized gain or loss is determined by taking the difference between the carrying value and proceeds from the sale
unrealized holding gain or loss for available for sale securities remains on the statement of financial position until such assets are sold-when sold, this account must then be closed and the realized gain or loss is computed by comparing the historical cost and proceeds from the sale<br>
slide38. Long term assets Long-term assets—resources that are used to generate revenues (or reduce costs) in the long run Tangible fixed assets such as property, plant, and equipment Deferred charges such as research and development (R&D) expenditures, and natural resources Intangible assets such as patents, trademarks, copyrights, and goodwill Financial assets such as available for sale; equity method investments<br>
slide39. Allocation of initial costs to respective periods Allocation—process of periodically expensing a deferred cost (asset) to one or more future expected benefit periods; determined by benefit period, salvage value, and allocation method
Terminology
• Depreciation for tangible fixed
assets
• Amortization for intangible assets
• Depletion for natural resources<br>
slide40. Acquisition cost excludes financing charges (except in self constructed assets) and cash discounts All expenditures needed to prepare the asset for its intended use Purchase price Acquisition cost of PPE<br>
slide41. Property, Plant, and Equipment (PP&E) Copyright © 2010 Pearson Education, Inc. Publishing as Prentice Hall 2-41 Land refers to property used in business, not investment property.
Leasehold investments are additions or improvements made to leased structures.
Construction in progress are the costs of constructing new buildings that are not yet complete.
Equipment represents the original cost of the machinery and equipment used in business operations.<br>
slide42. Property, Plant, and Equipment (PP&E) Copyright © 2010 Pearson Education, Inc. Publishing as Prentice Hall 2-42 Proportion of fixed assets in a company’s asset structure is determined by nature of the business.
Fixed assets are most prominent at the manufacturing level.<br>
slide43. Depreciation is the process of allocating the cost of a plant asset to expense in the accounting periods benefiting from its use. Depreciation Book value = original cost/revalued amount - accumulated depreciation to date
– impairment losses<br>
slide44. Factors in Computing Depreciation The calculation of depreciation requires three amounts for each asset:
Cost.
Salvage Value.
Useful Life.
Depreciation Method<br>
slide45. Cost - Salvage Value Useful life in periods Depreciation
Expense per Year = Straight-Line Method Depreciation Rate = 1/ useful life in periods
If useful life is 5 years, straight line rate is = 1/5 = 20% Straight-Line Method gives the same amount of depreciation
expense every year<br>
slide46. Step 1: Step 2: Step 3: Ignores salvage value Double-Declining-Balance Method<br>
slide47. Step 1: Step 2: Activity (Units-of-Production) Method<br>
slide48. Depreciation Methods-comparison Copyright © 2010 Pearson Education, Inc. Publishing as Prentice Hall 2-48 Straight-line method allocates an equal amount of expense to each year of the depreciation period.
Accelerated method apportions larger amounts of expense to earlier years of the asset’s depreciable life – in Turkey most common one is double declining.
Units-of-production method bases depreciation expense on actual use.
Companies can use different methods for different asset classes.<br>
slide50. Capitalization Capitalization—process of deferring a cost that is incurred in the current period and whose benefits are expected to extend to one or more future periods
For a cost to be capitalized, it must meet each of the following criteria:
• It must arise from a past transaction or event
• It must yield identifiable and reasonably probable future benefits
• It must allow owner (restrictive) control over future benefits<br>
slide51. Valuation of PPE (C) 2007 Prentice Hall, Inc. 2-51 Option: Property, plant & equipment are valued at cost less accumulated depreciation and allowance for impairment
Option: Property, plant & equipment are valued at revalued amount less accumulated depreciation and allowance for impairment
Impairment—process of writing down asset value when its expected (undiscounted) cash flows are less than its carrying (book) value
Two distortions arise from impairment:
Conservative biases distort long-lived asset valuation because assets are written down but not written up
Large transitory effects from recognizing asset impairments distort net income.<br>
slide52. Valuation Analysis Valuation emphasizes objectivity of historical cost, the
conservatism principle, and accounting for the money
invested
Limitations of historical costs:
Balance sheets may not reflect market values after initial acquisition
Not especially relevant in assessing replacement values- either entry or exit values
Not comparable across companies—even if two land pieces side by side– may be purchased at different times
Not particularly useful in measuring opportunity costs
Collection of expenditures reflecting different purchasing power<br>
slide53. Total cost, including exploration and development, is charged to depletion expense over periods benefited. Extracted from the natural environment and reported at cost less accumulated depletion. Examples: oil, coal, gold Natural resources (wasting assets)—rights to extract or consume natural resources Natural Resources<br>
slide54. Depletion is calculated using the
units-of-production method. Unit depletion rate is calculated as follows: Depletion of Natural Resources<br>
slide55. Depletion of Natural Resources Total depletion cost for a period is: Total depletion cost<br>
slide56. • Assess reasonableness of depreciable base, useful life, and allocation method
• Review any revisions of useful lives
• Evaluate adequacy of depreciation—ratio of depreciation to total assets or to other size-related factors
• Analyze plant asset age—measures include
Average total life span = Gross plant and equipment assets / Current year depreciation expense.
Average age = Accumulated depreciation / Current year depreciation expense.
Average remaining life = Net plant and equipment assets / Current year depreciation expense.
Average total life span = Average age + Average remaining life
(these measures also reflect on profit margins and financing requirements) Analyzing Depreciation and Depletion<br>
slide57. Noncurrent assets without physical substance. Useful life is often difficult to determine. Usually acquired for operational use. Intangible Assets Often provide exclusive rights or privileges. Intangible Assets<br>
slide58. Accounting for Intangible Assets Patents
Copyrights
Leaseholds
Leasehold Improvements
Goodwill- only recognized in company acquisitions – not amortized
Trademarks and Trade Names Record at cost, including purchase price, legal fees, and filing fees.<br>
slide59. Analyzing Intangibles and Goodwill Search for unrecorded intangibles and goodwill—often misvalued and most likely exist off-balance-sheet
Examine for unusually good earnings
as evidence of goodwill
Review amortization periods—
any likely bias is in the direction of less
amortization and can call for adjustments
Recognize goodwill has a limited useful life--whatever the advantages of location, market dominance, competitive stance, sales skill, or product acceptance, they are affected by changes in business<br>
slide60. Other Assets Copyright © 2010 Pearson Education, Inc. Publishing as Prentice Hall 2-60 Can include many other noncurrent items:
Property held for sale
Start-up costs in connection with a new business
Cash surrender value of life insurance policies
Long-term advance payments
Long-term investments<br>