
Chapter 17 Investment Considerations:





Description: Chapter 17 Investment Considerations: Macroeconomic and Industry Analysis INVESTMENTS BODIE, KANE, MARCUS McGraw-Hill Education. All rights reserved. Authorized only for instructor use in the classroom. No reproduction or further
Related Topics
Download Presentation
"Chapter 17 Investment Considerations:" is the property of its rightful owner. Permission is granted to download and print the materials on this website for personal, non-commercial use only, and to display it on your personal computer provided you do not modify the materials and that you retain all copyright notices contained in the materials. By downloading content from our website, you accept the terms of this agreement.
Presentation Transcript
slide1. Chapter 17 Investment Considerations:
Macroeconomic and Industry Analysis INVESTMENTS | BODIE, KANE, MARCUS © McGraw-Hill Education. All rights reserved. Authorized only for instructor use in the classroom. No reproduction or further distribution permitted without the prior written consent of McGraw-Hill Education.<br>
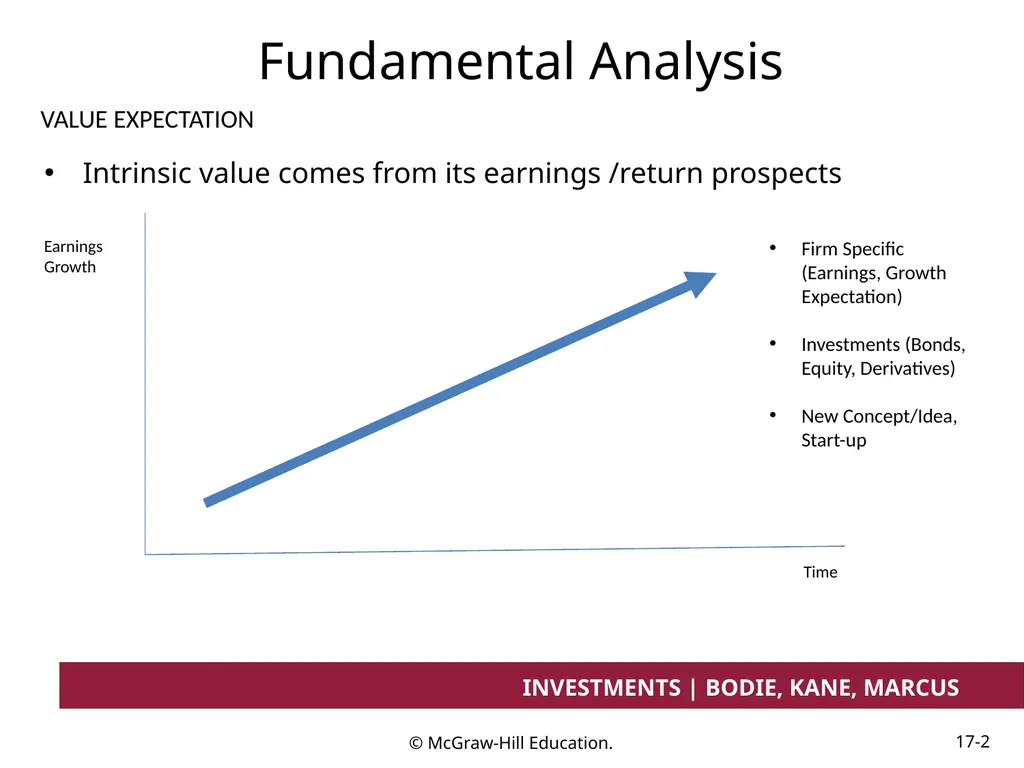
slide2. Fundamental Analysis Intrinsic value comes from its earnings /return prospects Earnings Growth Time VALUE EXPECTATION Firm Specific (Earnings, Growth Expectation)
Investments (Bonds, Equity, Derivatives)
New Concept/Idea, Start-up<br>
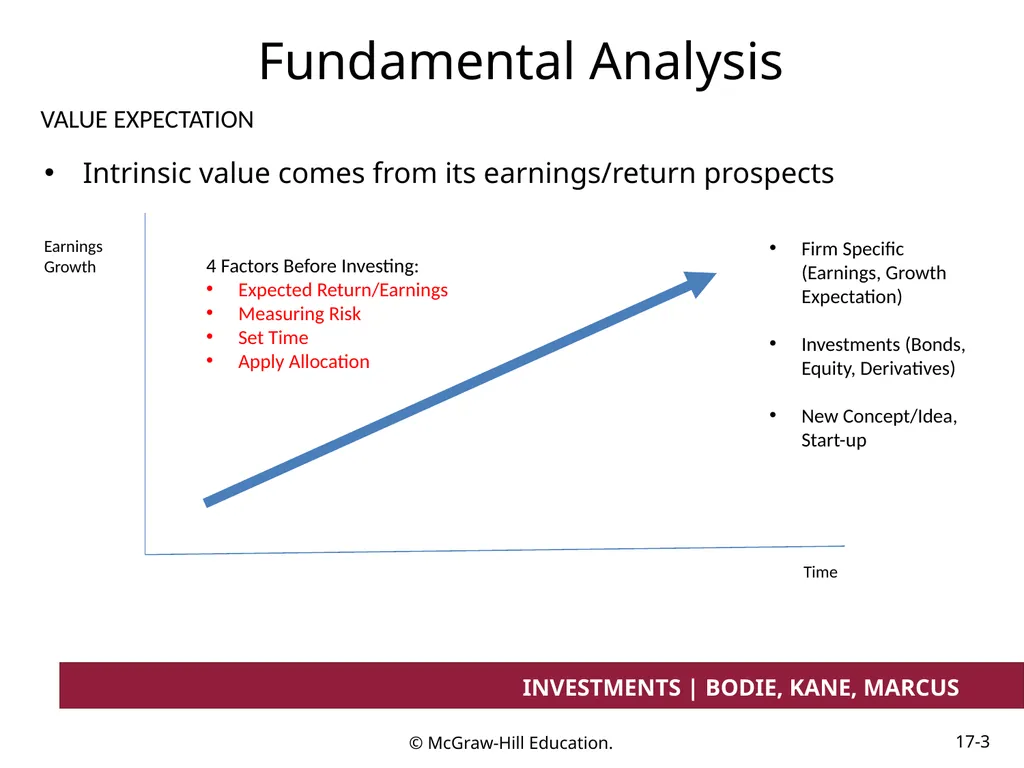
slide3. Fundamental Analysis Intrinsic value comes from its earnings/return prospects Earnings Growth Time VALUE EXPECTATION Firm Specific (Earnings, Growth Expectation)
Investments (Bonds, Equity, Derivatives)
New Concept/Idea, Start-up 4 Factors Before Investing:
Expected Return/Earnings
Measuring Risk
Set Time
Apply Allocation<br>
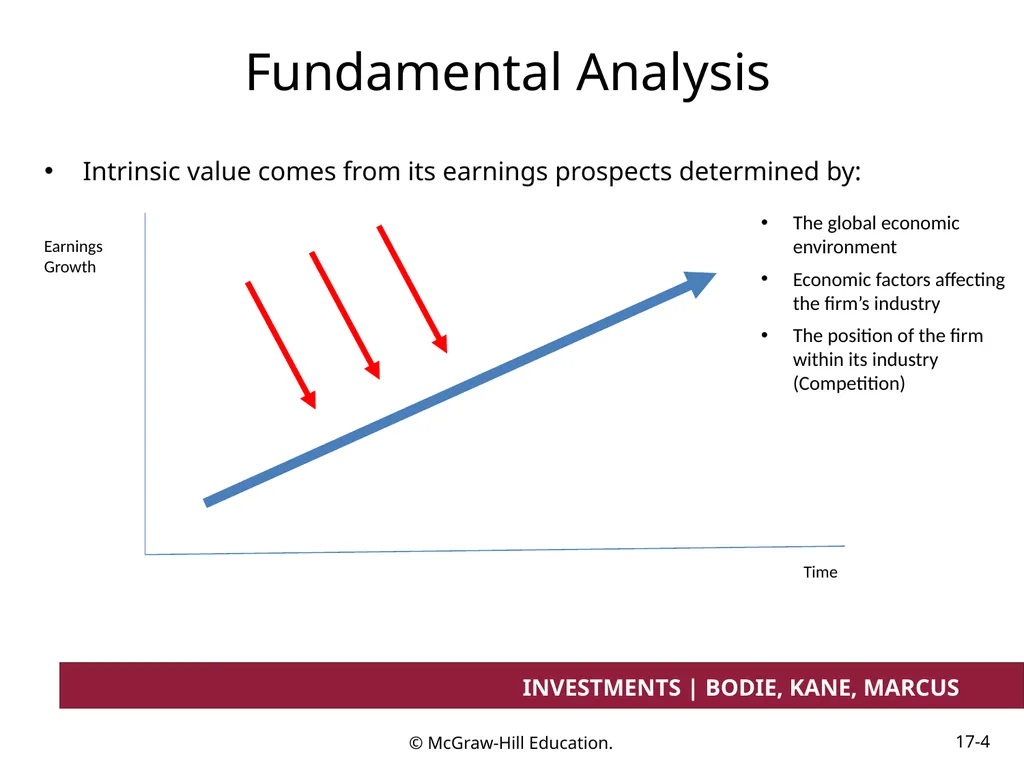
slide4. Fundamental Analysis Intrinsic value comes from its earnings prospects determined by: Earnings Growth Time The global economic environment
Economic factors affecting the firm’s industry
The position of the firm within its industry (Competition)<br>
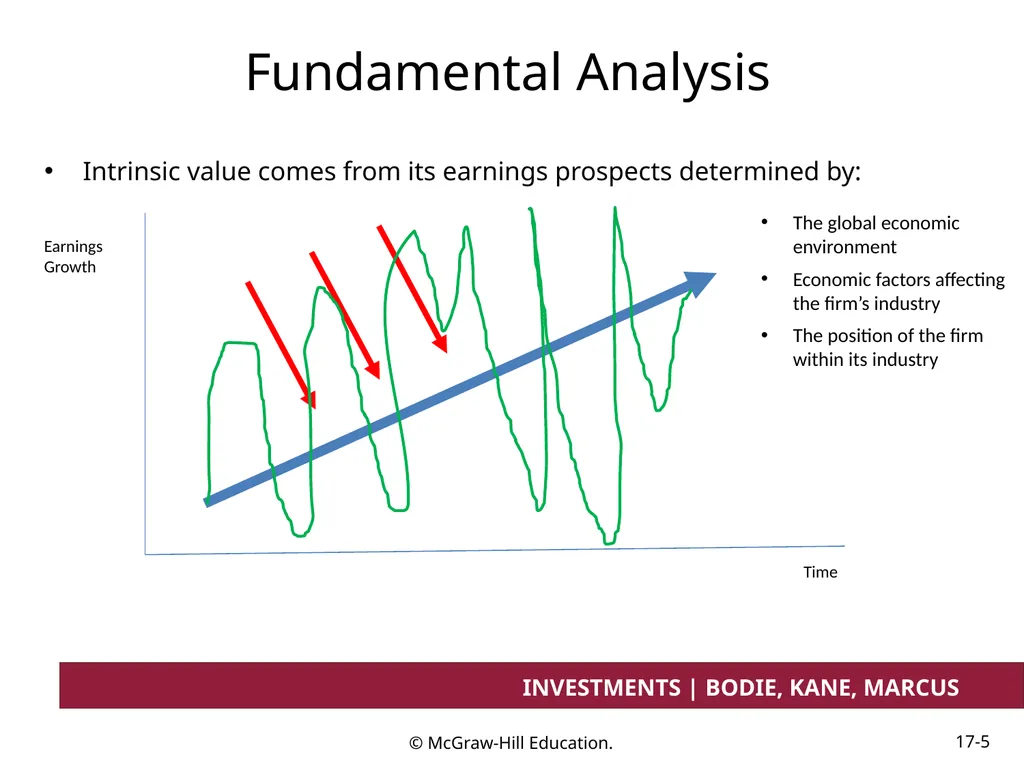
slide5. Fundamental Analysis Intrinsic value comes from its earnings prospects determined by: Earnings Growth Time The global economic environment
Economic factors affecting the firm’s industry
The position of the firm within its industry<br>
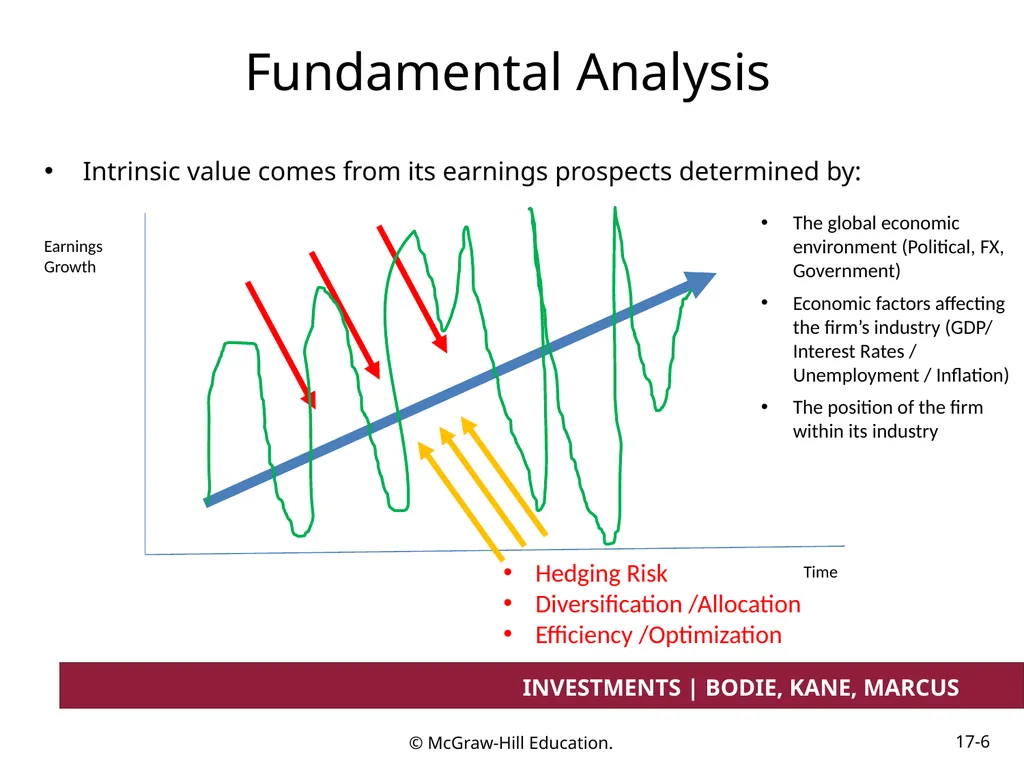
slide6. Fundamental Analysis Intrinsic value comes from its earnings prospects determined by: Earnings Growth Time The global economic environment (Political, FX, Government)
Economic factors affecting the firm’s industry (GDP/ Interest Rates / Unemployment / Inflation)
The position of the firm within its industry Hedging Risk
Diversification /Allocation
Efficiency /Optimization<br>
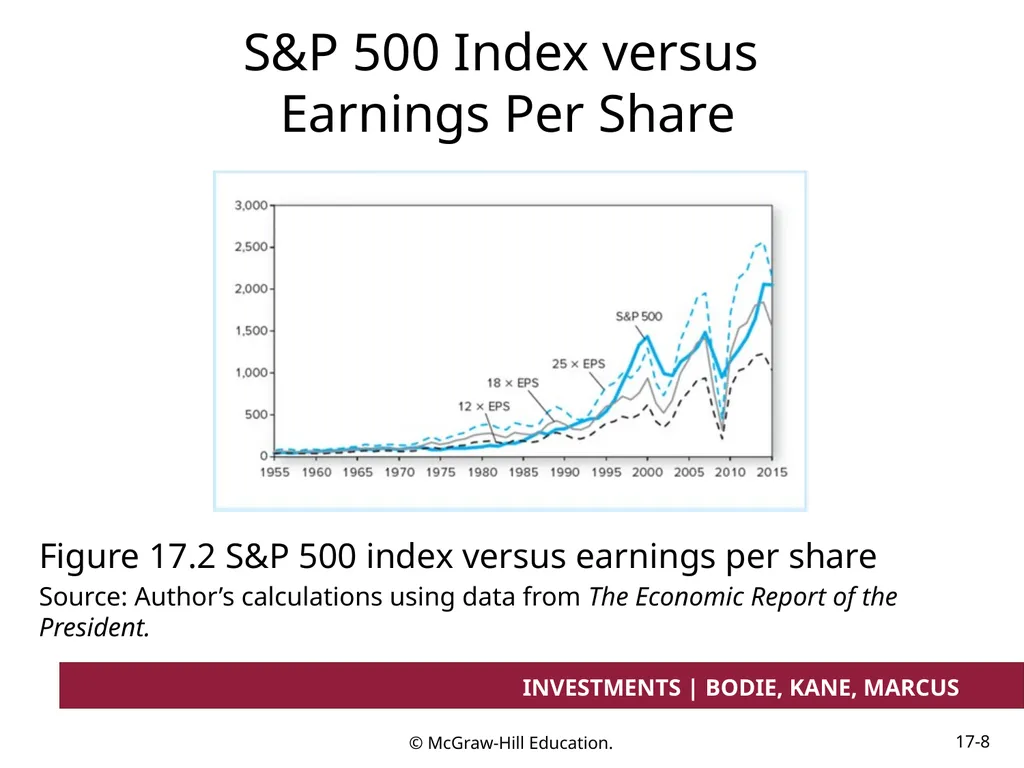
slide7. The Domestic Macro economy Stock prices rise with earnings
P/E ratios are normal range: 12-25
Forecasting the performance of the broad market begins with an assessment of the economy as a whole<br>
slide8. S&P 500 Index versus Earnings Per Share Figure 17.2 S&P 500 index versus earnings per share
Source: Author’s calculations using data from The Economic Report of the President.<br>
slide9. The Domestic Macro economy: Key Variables Gross domestic product
Unemployment rates
Inflation
Interest rates
Budget deficit
Sentiment<br>
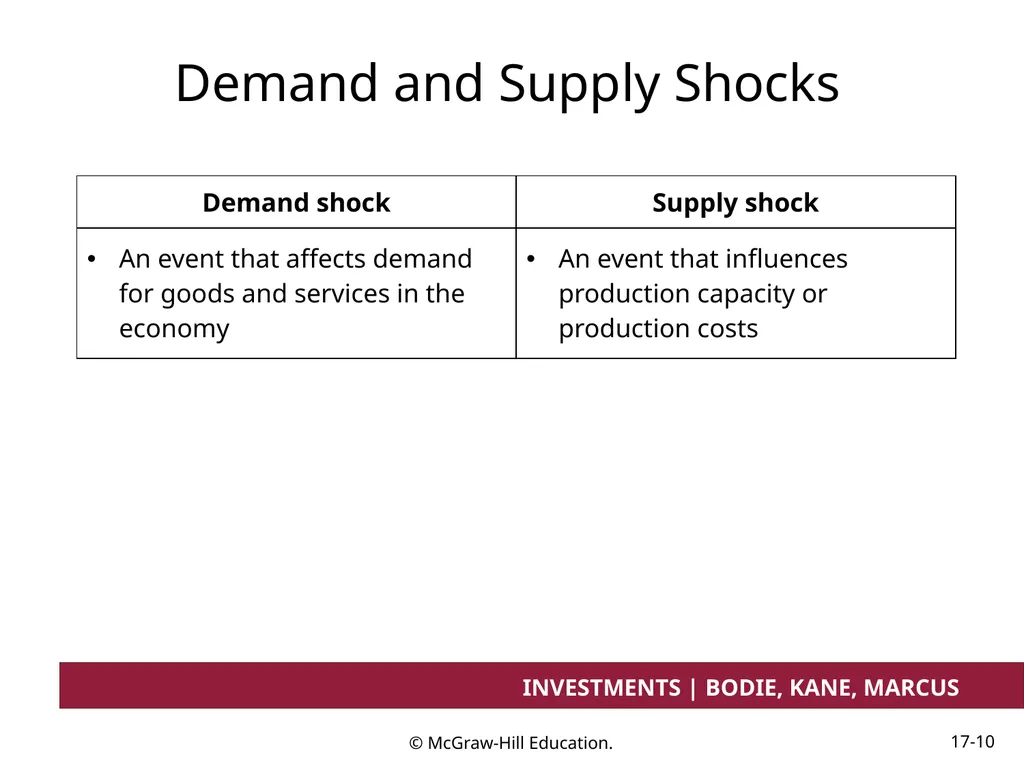
slide10. Demand and Supply Shocks<br>
slide11. Demand-side Policy Fiscal policy —
Monetary policy —<br>
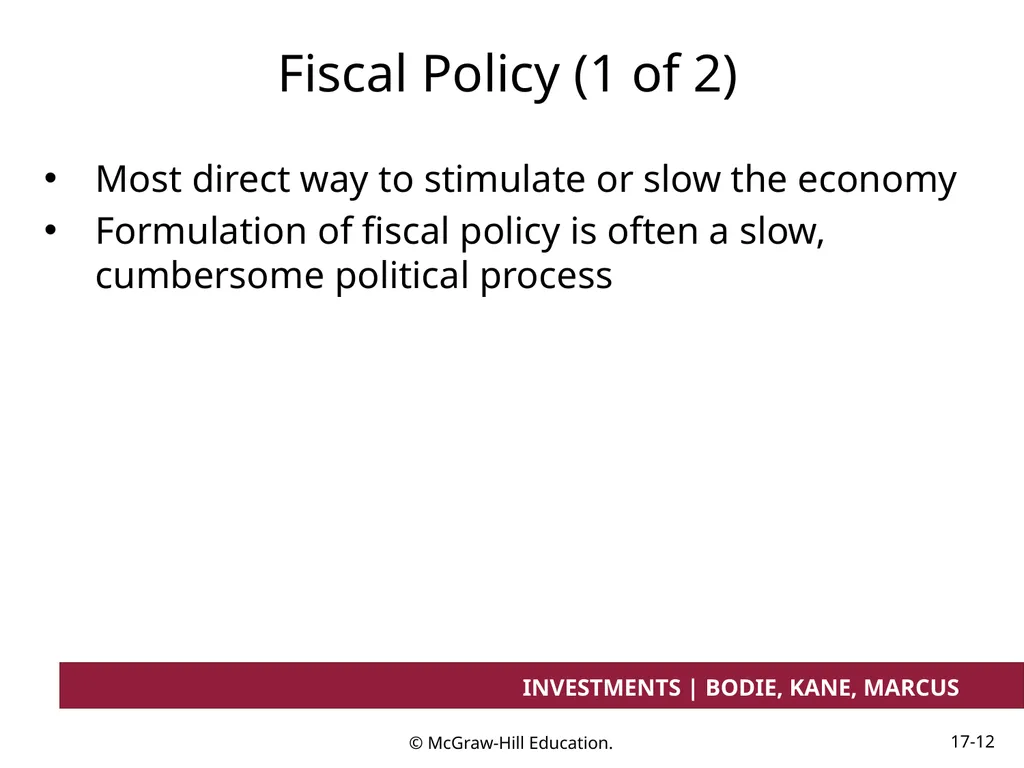
slide12. Fiscal Policy (1 of 2) Most direct way to stimulate or slow the economy
Formulation of fiscal policy is often a slow, cumbersome political process<br>
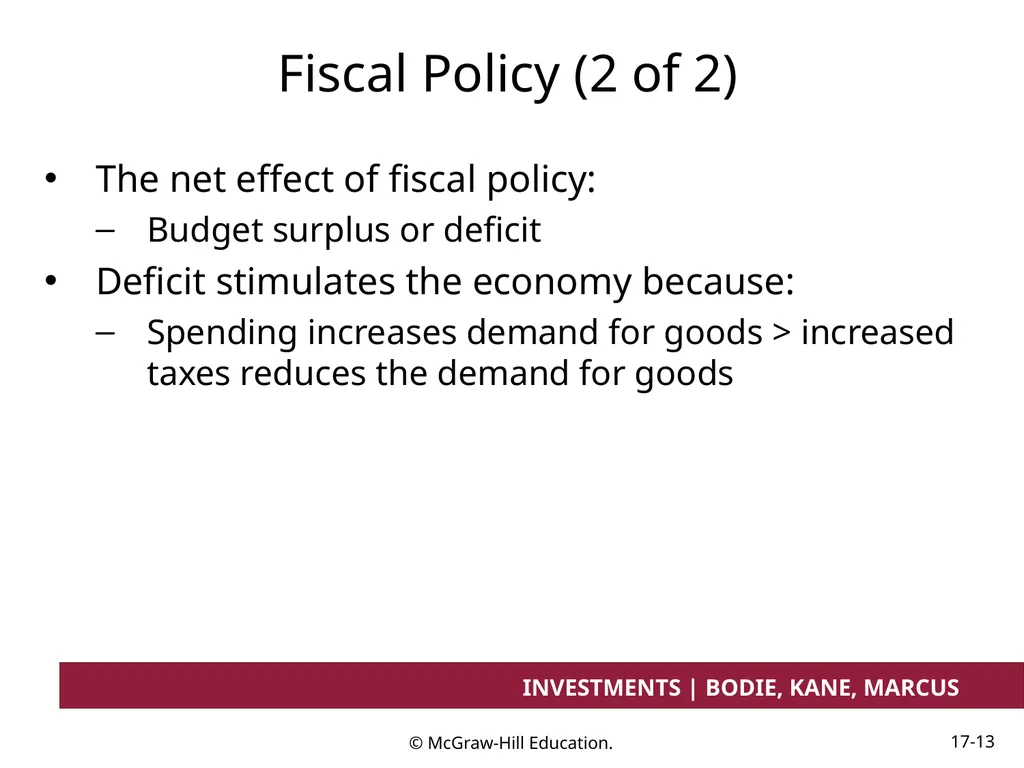
slide13. Fiscal Policy (2 of 2) The net effect of fiscal policy:
Budget surplus or deficit
Deficit stimulates the economy because:
Spending increases demand for goods > increased taxes reduces the demand for goods<br>
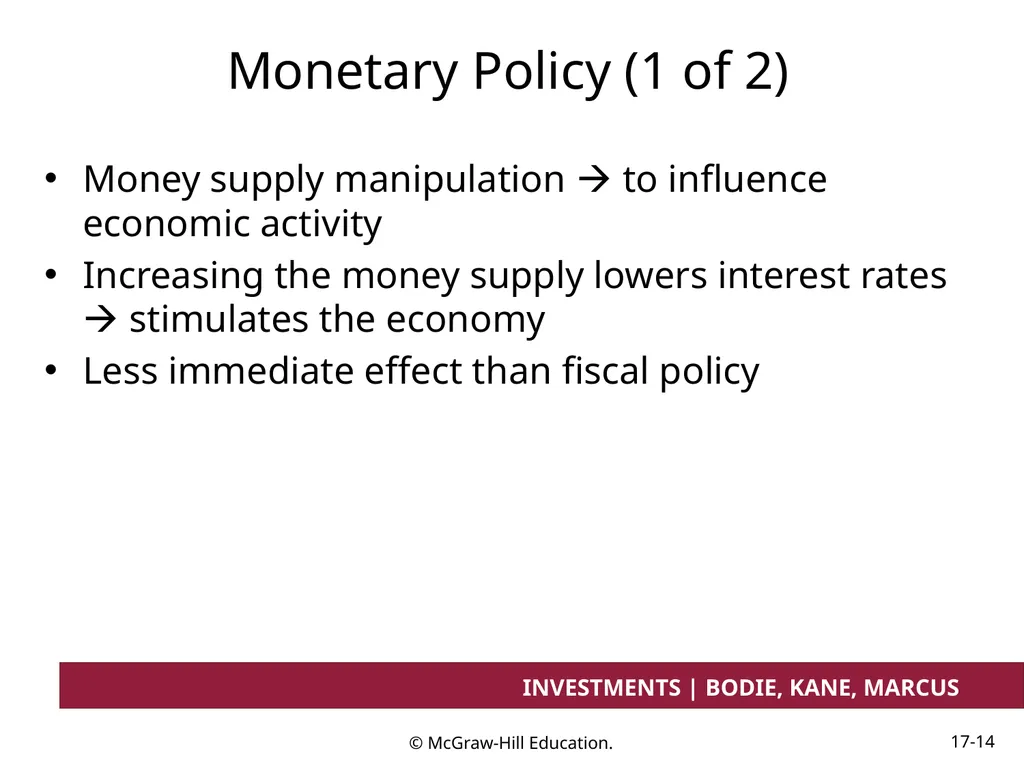
slide14. Monetary Policy (1 of 2) Money supply manipulation to influence economic activity
Increasing the money supply lowers interest rates stimulates the economy
Less immediate effect than fiscal policy<br>
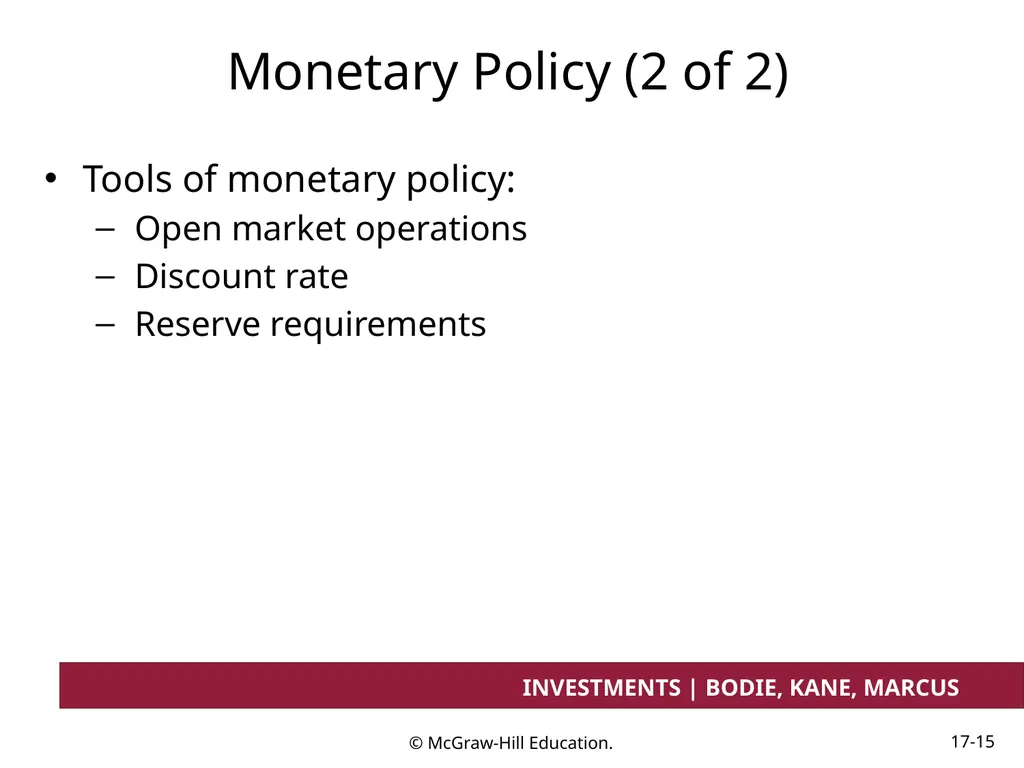
slide15. Monetary Policy (2 of 2) Tools of monetary policy:
Open market operations
Discount rate
Reserve requirements<br>
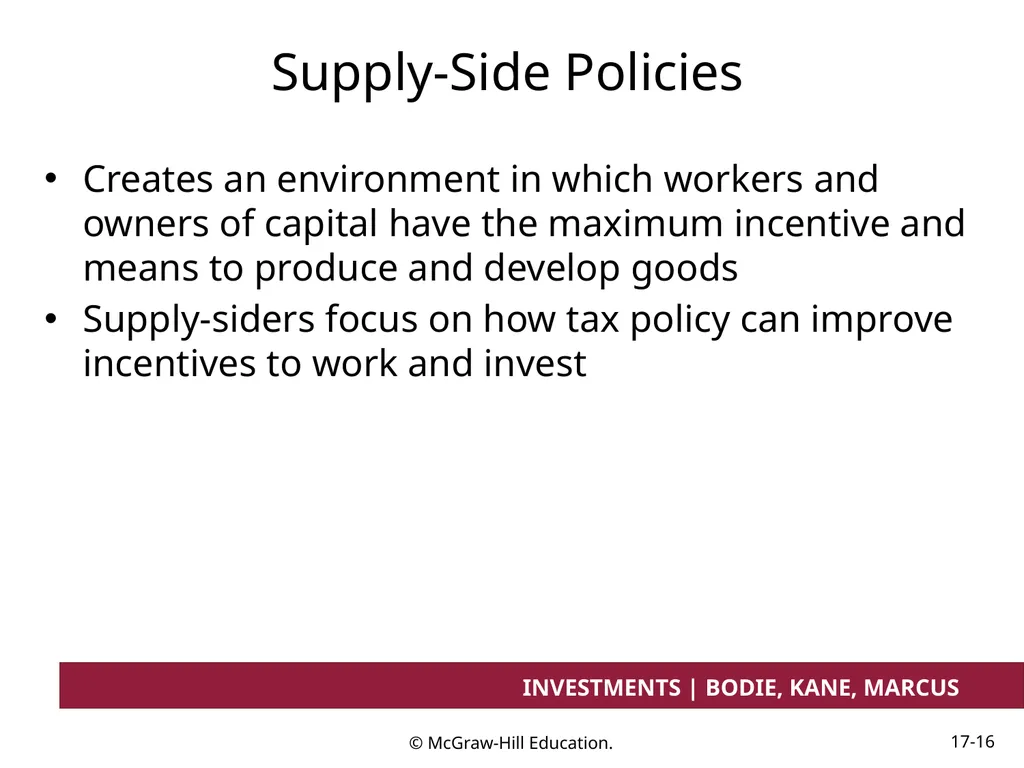
slide16. Supply-Side Policies Creates an environment in which workers and owners of capital have the maximum incentive and means to produce and develop goods
Supply-siders focus on how tax policy can improve incentives to work and invest<br>
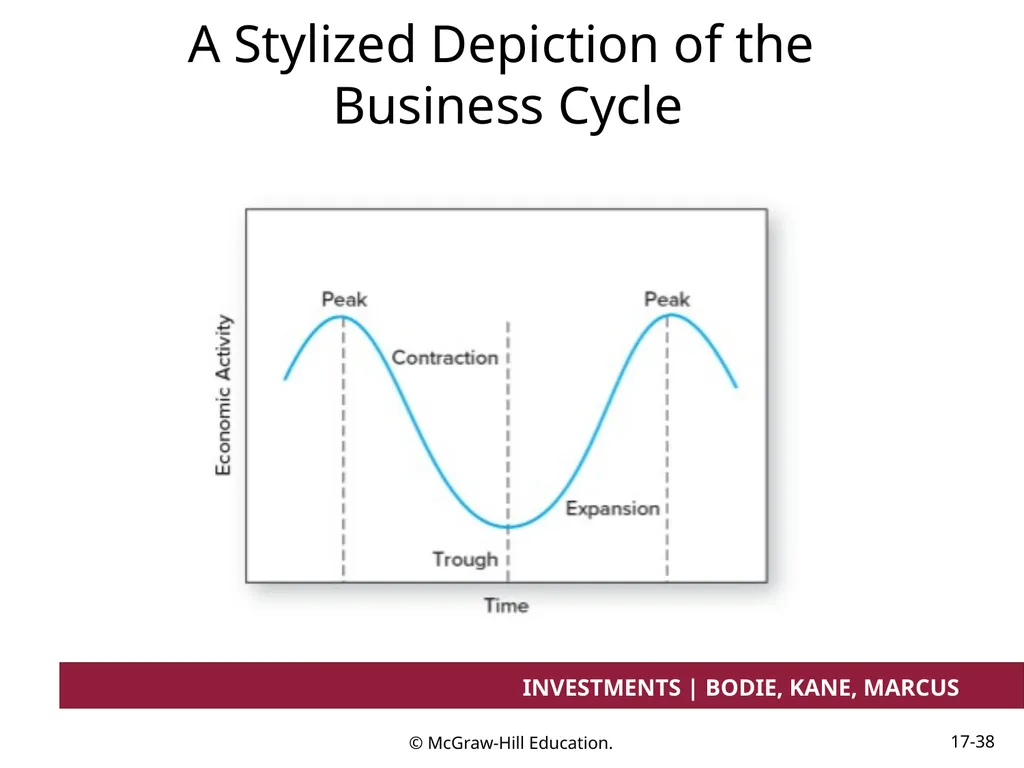
slide17. Business Cycles The transition points across cycles are called peaks and troughs
Peak:
Trough:<br>
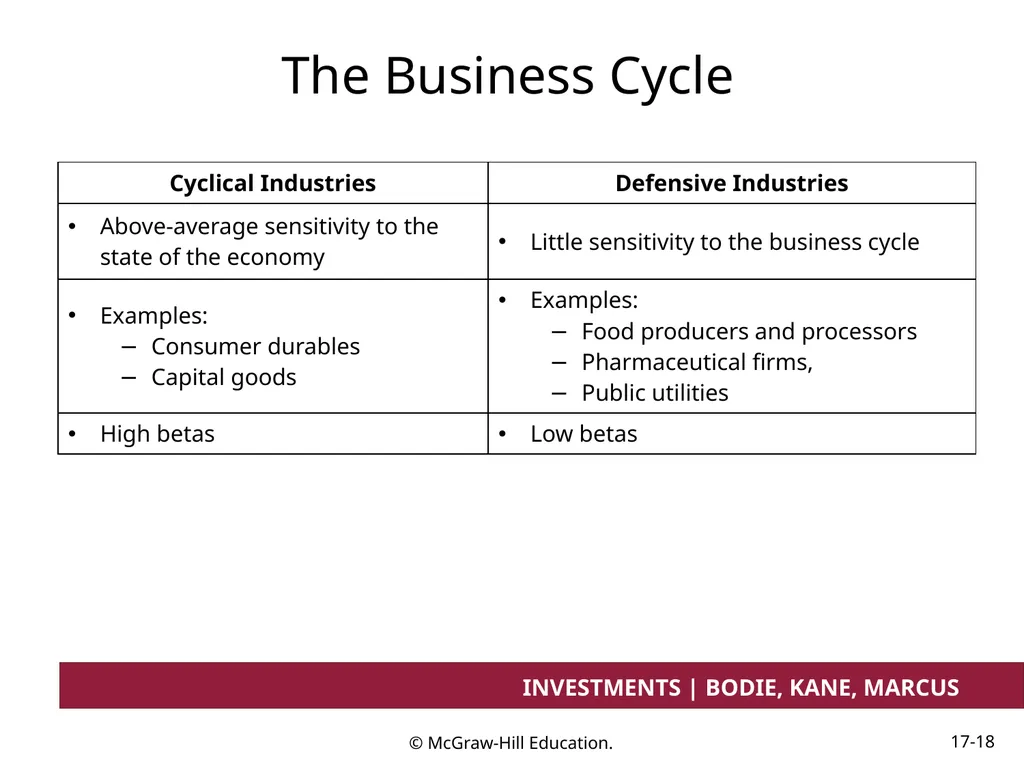
slide18. The Business Cycle<br>
slide19. Economic Indicators (1 of 4) Leading indicators:
Coincident indicators:
Lagging indicators:<br>
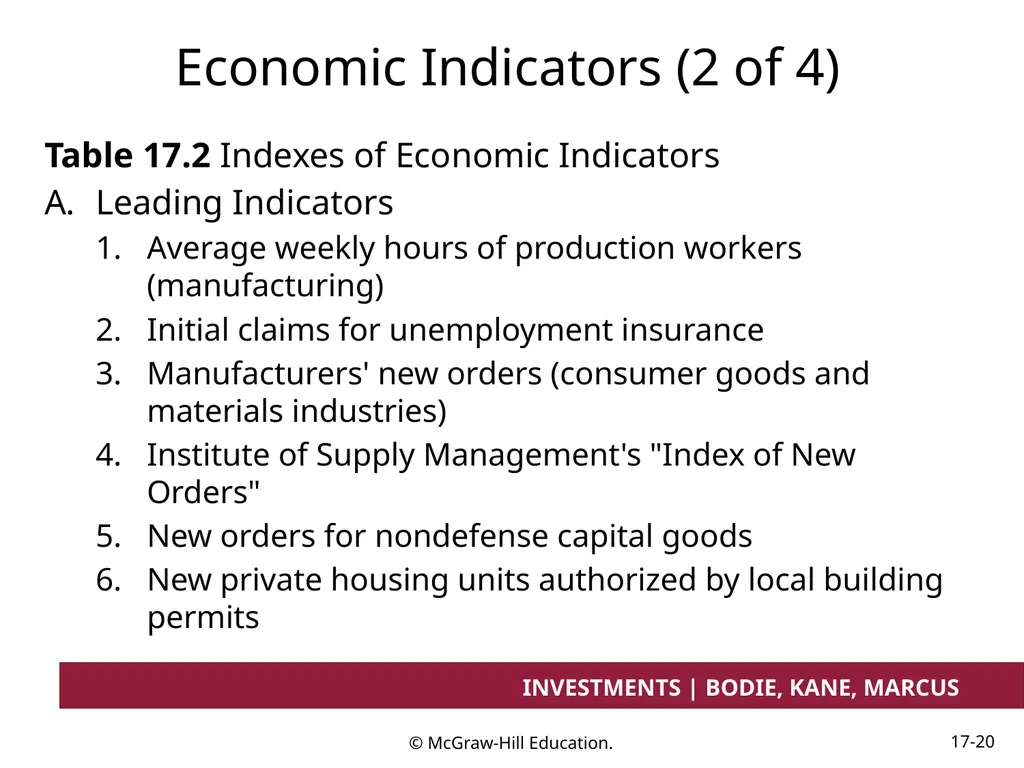
slide20. Economic Indicators (2 of 4) Table 17.2 Indexes of Economic Indicators
Leading Indicators
Average weekly hours of production workers (manufacturing)
Initial claims for unemployment insurance
Manufacturers' new orders (consumer goods and materials industries)
Institute of Supply Management's "Index of New Orders"
New orders for nondefense capital goods
New private housing units authorized by local building permits<br>
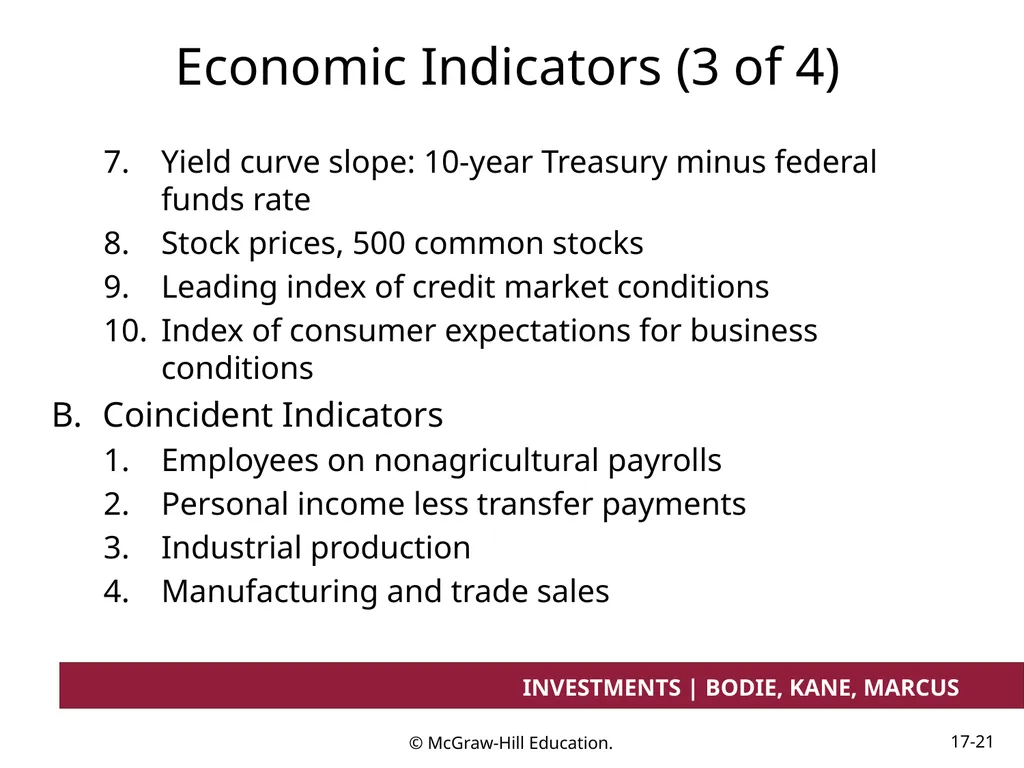
slide21. Economic Indicators (3 of 4) Yield curve slope: 10-year Treasury minus federal funds rate
Stock prices, 500 common stocks
Leading index of credit market conditions
Index of consumer expectations for business conditions
Coincident Indicators
Employees on nonagricultural payrolls
Personal income less transfer payments
Industrial production
Manufacturing and trade sales<br>
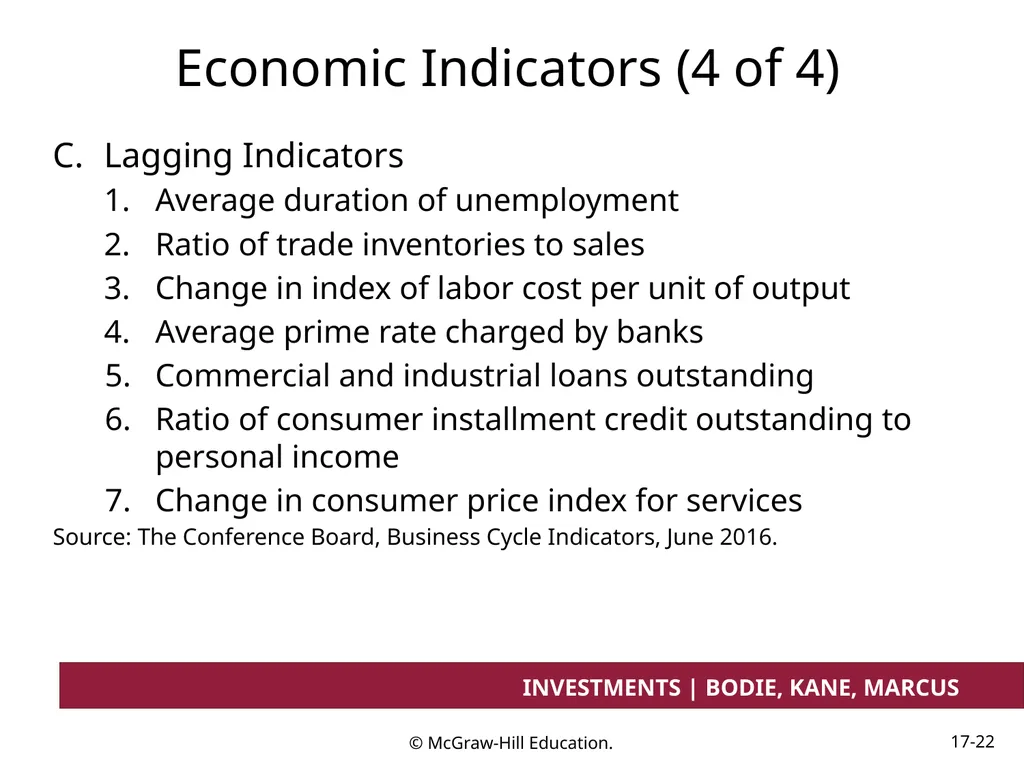
slide22. Economic Indicators (4 of 4) Lagging Indicators
Average duration of unemployment
Ratio of trade inventories to sales
Change in index of labor cost per unit of output
Average prime rate charged by banks
Commercial and industrial loans outstanding
Ratio of consumer installment credit outstanding to personal income
Change in consumer price index for services
Source: The Conference Board, Business Cycle Indicators, June 2016.<br>
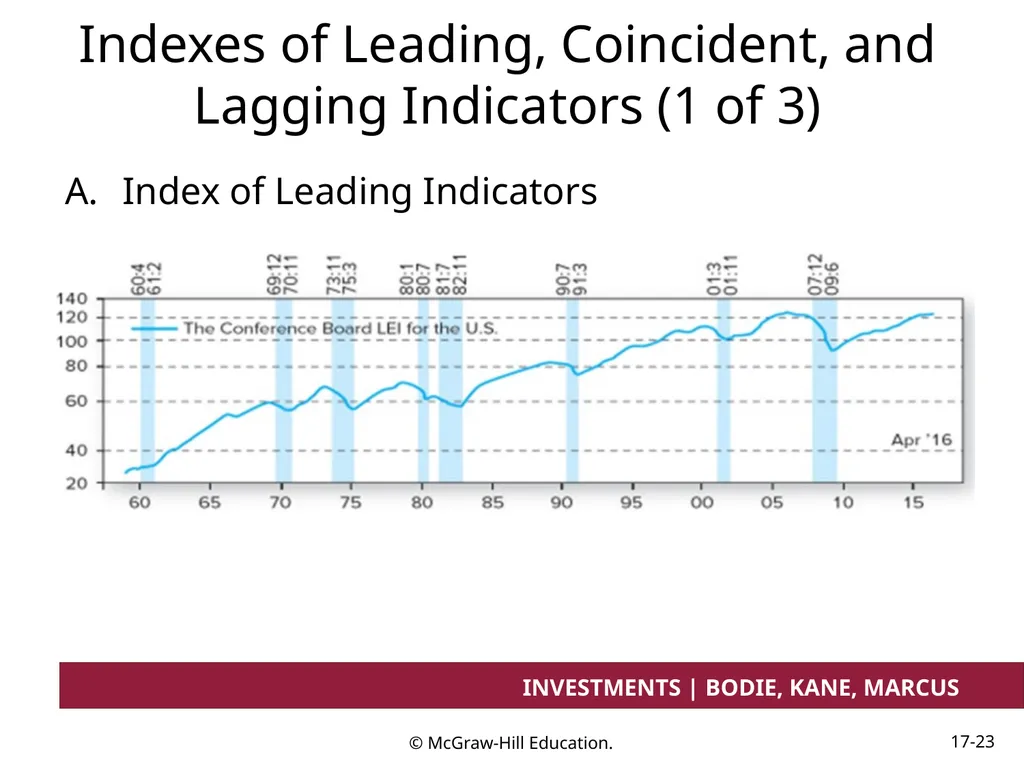
slide23. Indexes of Leading, Coincident, and Lagging Indicators (1 of 3) Index of Leading Indicators<br>
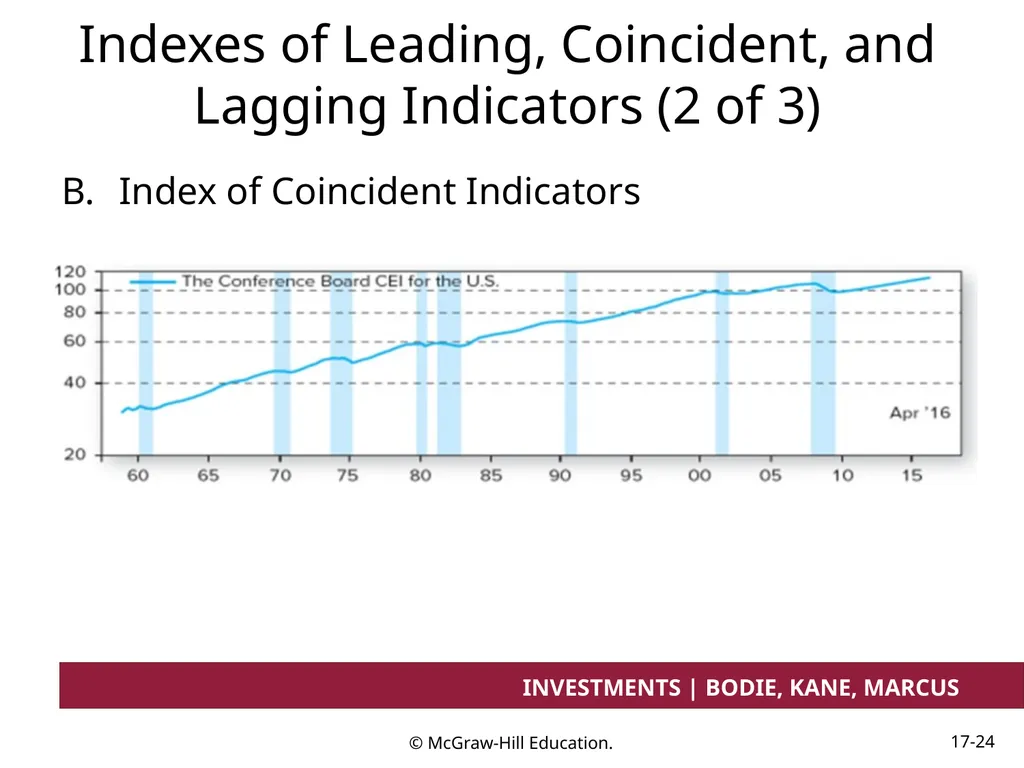
slide24. Indexes of Leading, Coincident, and Lagging Indicators (2 of 3) Index of Coincident Indicators<br>
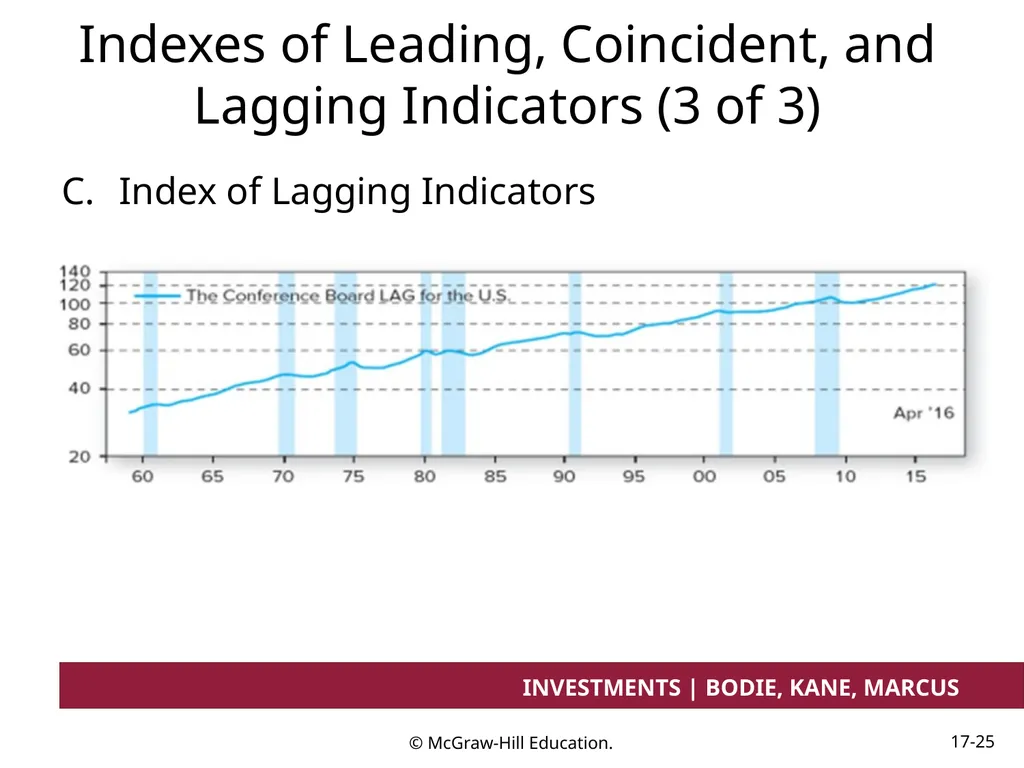
slide25. Indexes of Leading, Coincident, and Lagging Indicators (3 of 3) Index of Lagging Indicators<br>
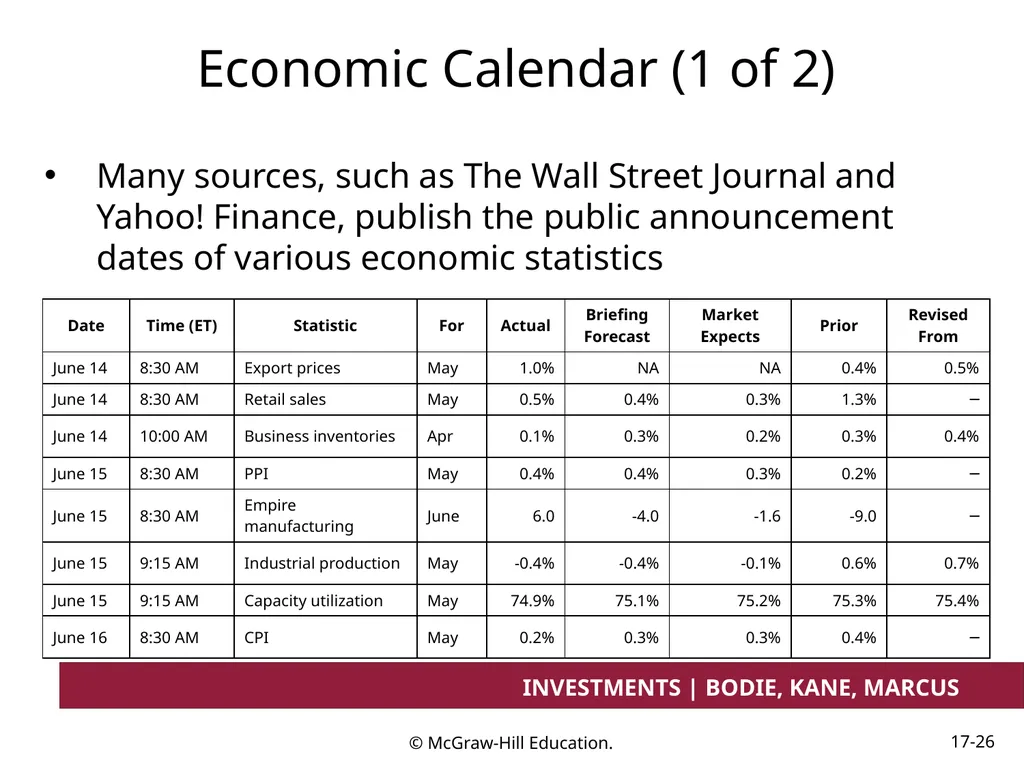
slide26. Economic Calendar (1 of 2) Many sources, such as The Wall Street Journal and Yahoo! Finance, publish the public announcement dates of various economic statistics<br>
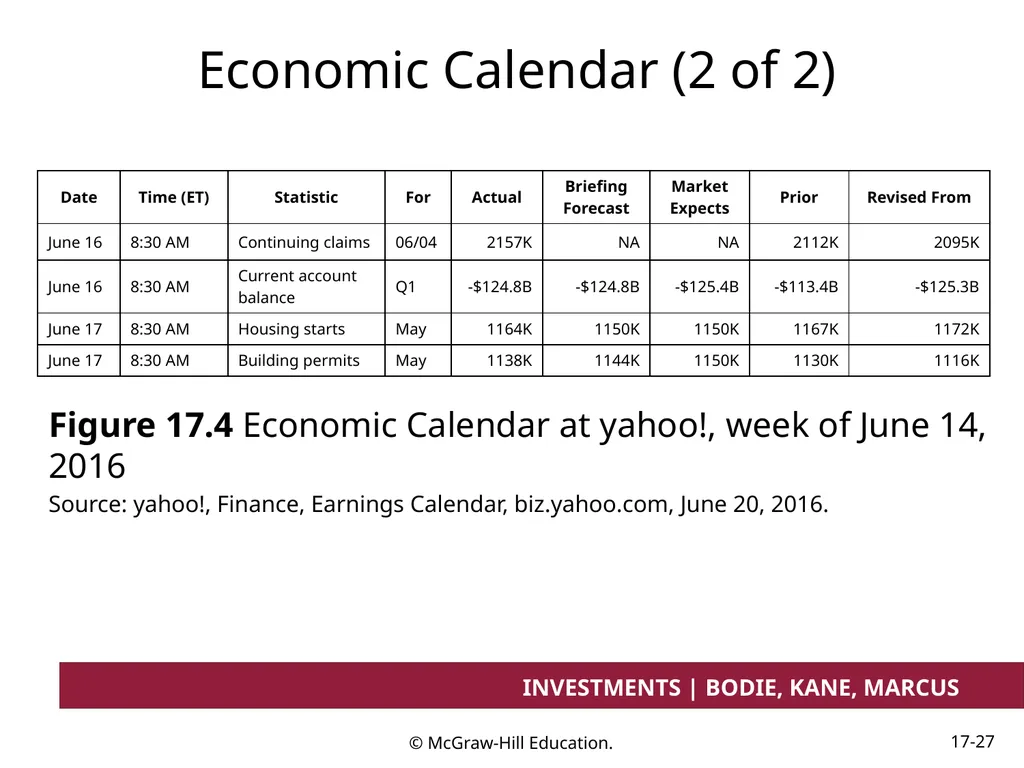
slide27. Economic Calendar (2 of 2) Figure 17.4 Economic Calendar at yahoo!, week of June 14, 2016
Source: yahoo!, Finance, Earnings Calendar, biz.yahoo.com, June 20, 2016.<br>
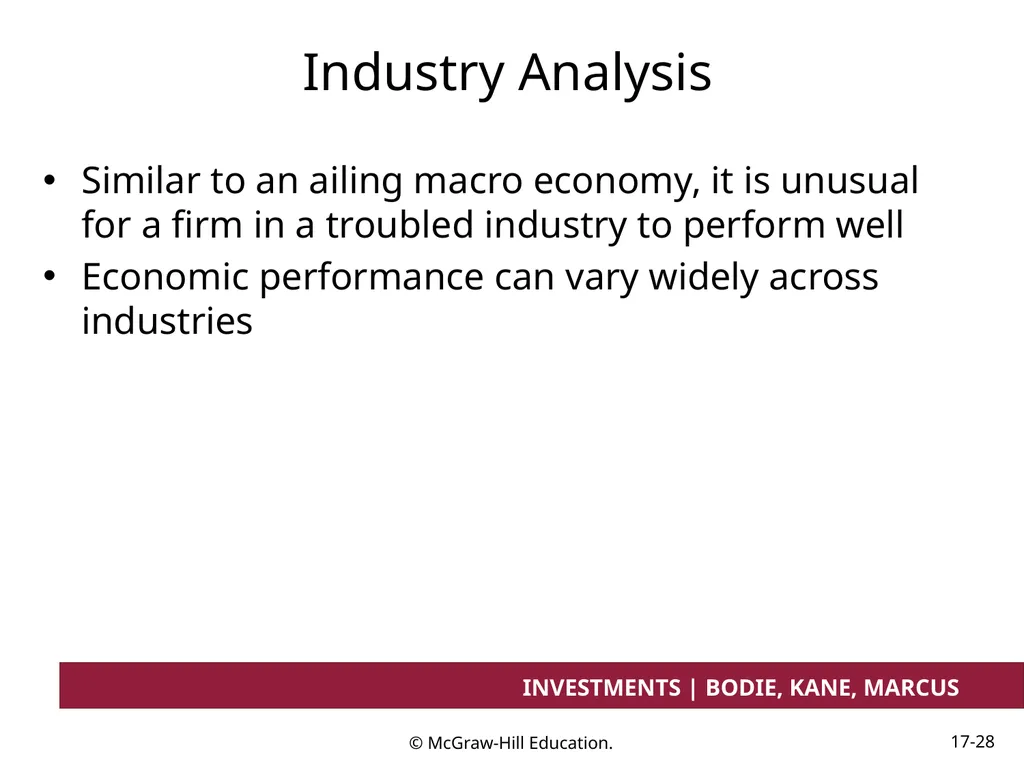
slide28. Industry Analysis Similar to an ailing macro economy, it is unusual for a firm in a troubled industry to perform well
Economic performance can vary widely across industries<br>
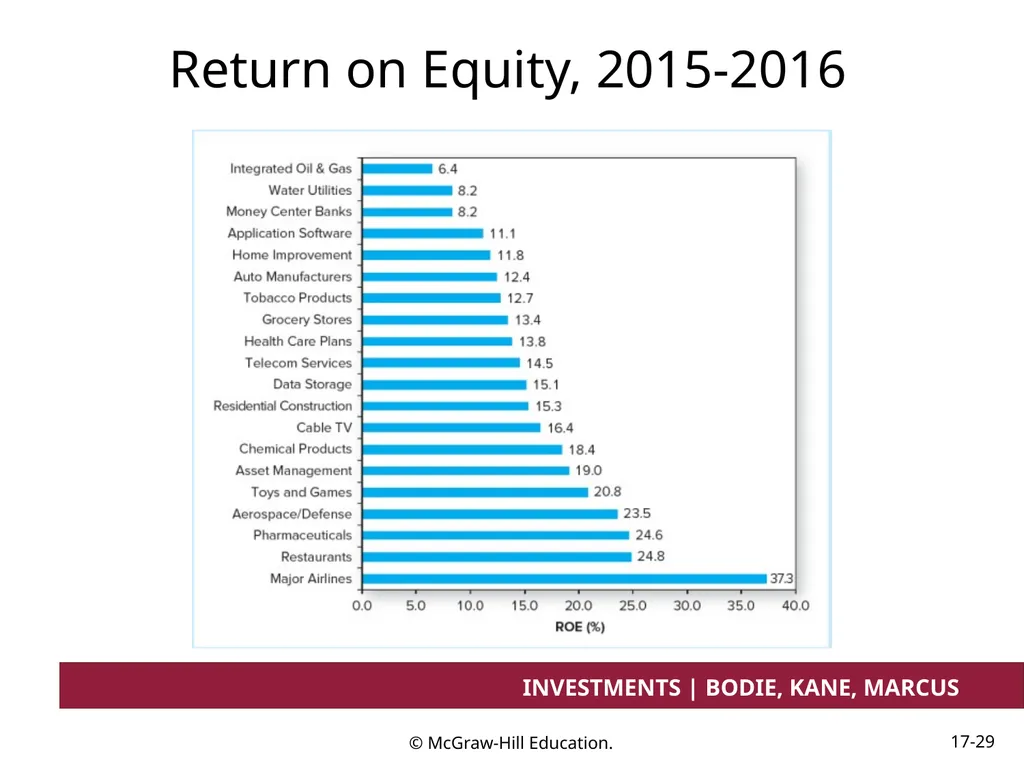
slide29. Return on Equity, 2015-2016<br>
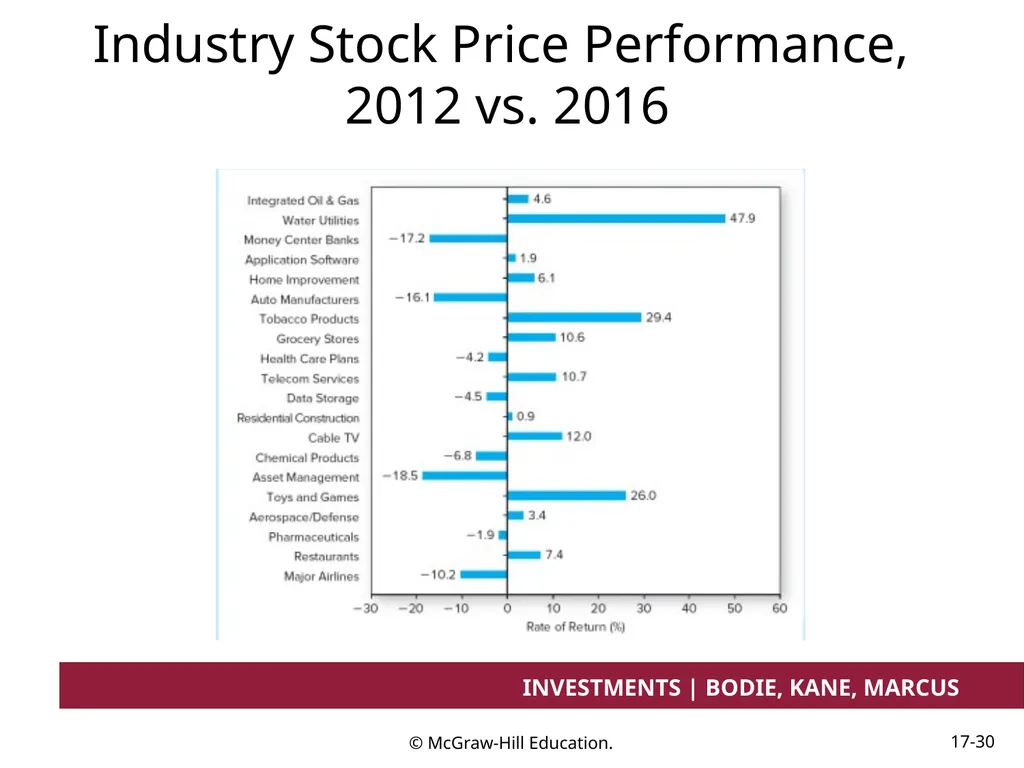
slide30. Industry Stock Price Performance, 2012 vs. 2016<br>
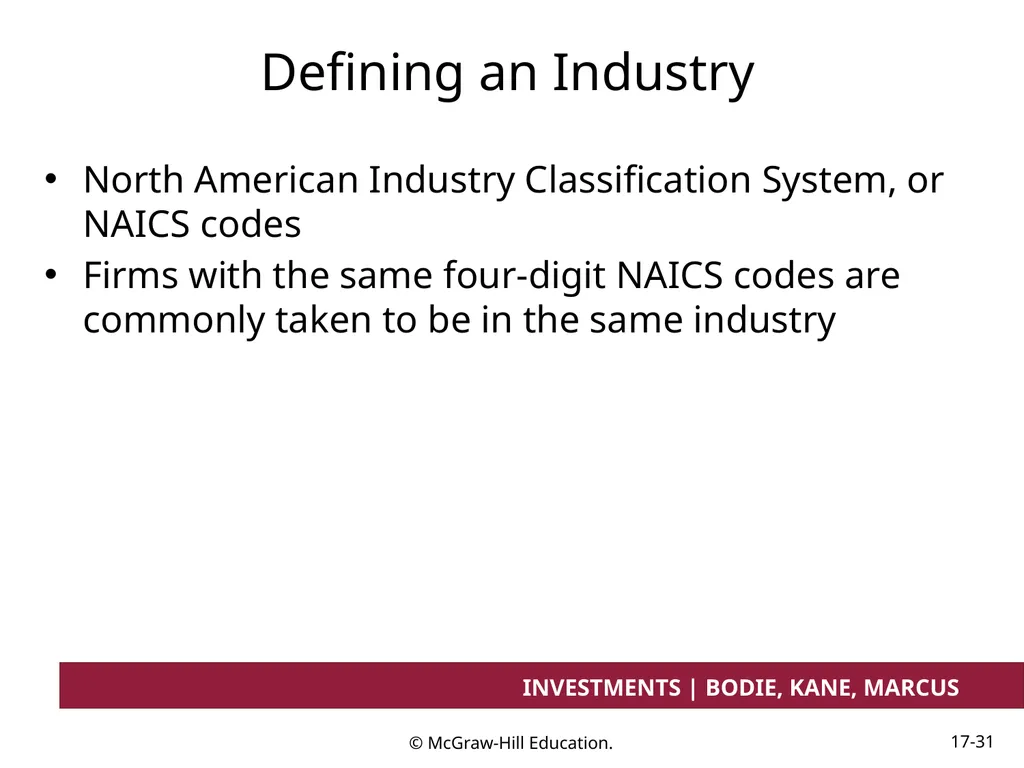
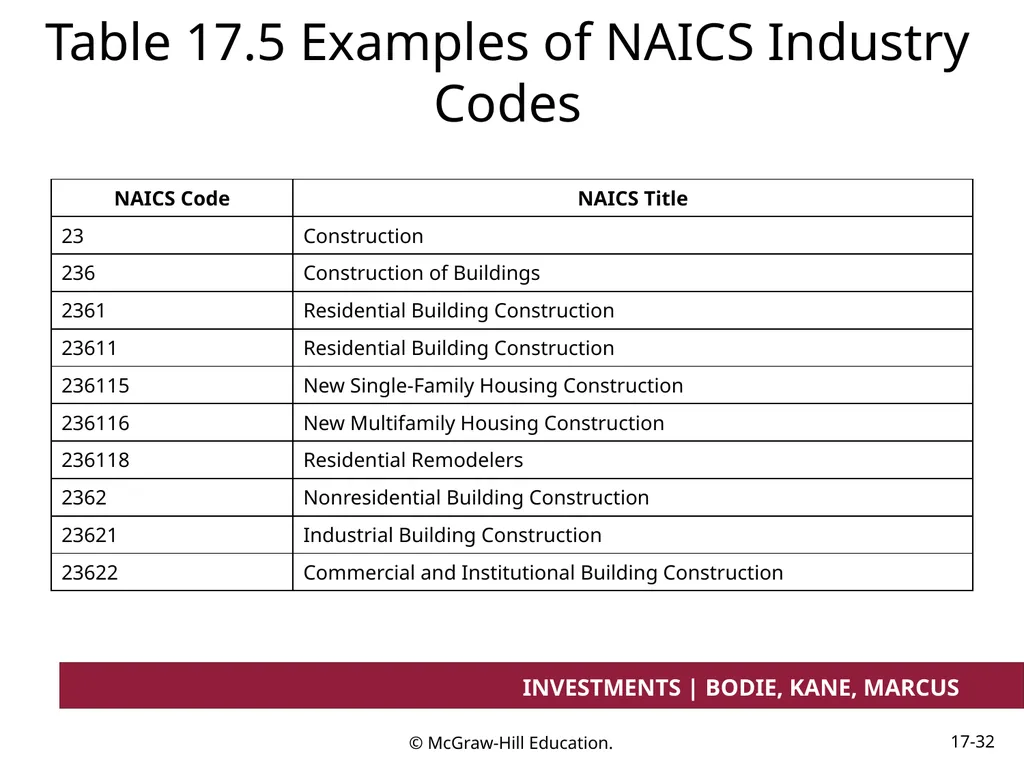
slide31. Defining an Industry North American Industry Classification System, or NAICS codes
Firms with the same four-digit NAICS codes are commonly taken to be in the same industry<br>
slide32. Table 17.5 Examples of NAICS Industry Codes<br>
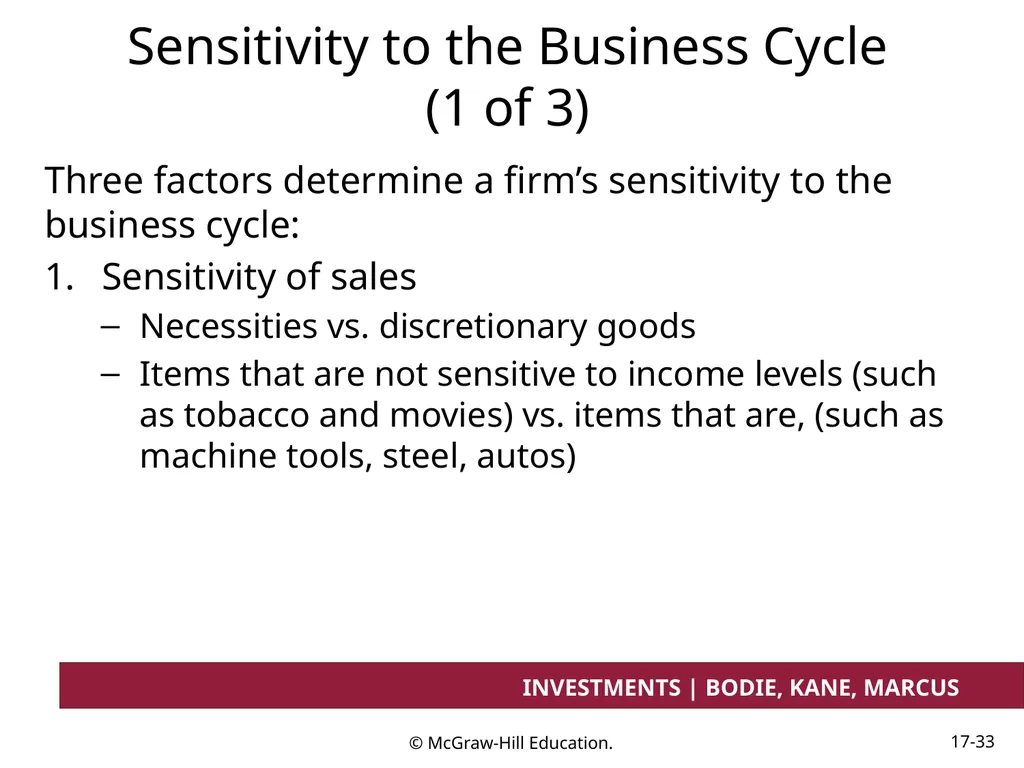
slide33. Sensitivity to the Business Cycle (1 of 3) Three factors determine a firm’s sensitivity to the business cycle:
Sensitivity of sales
Necessities vs. discretionary goods
Items that are not sensitive to income levels (such as tobacco and movies) vs. items that are, (such as machine tools, steel, autos)<br>
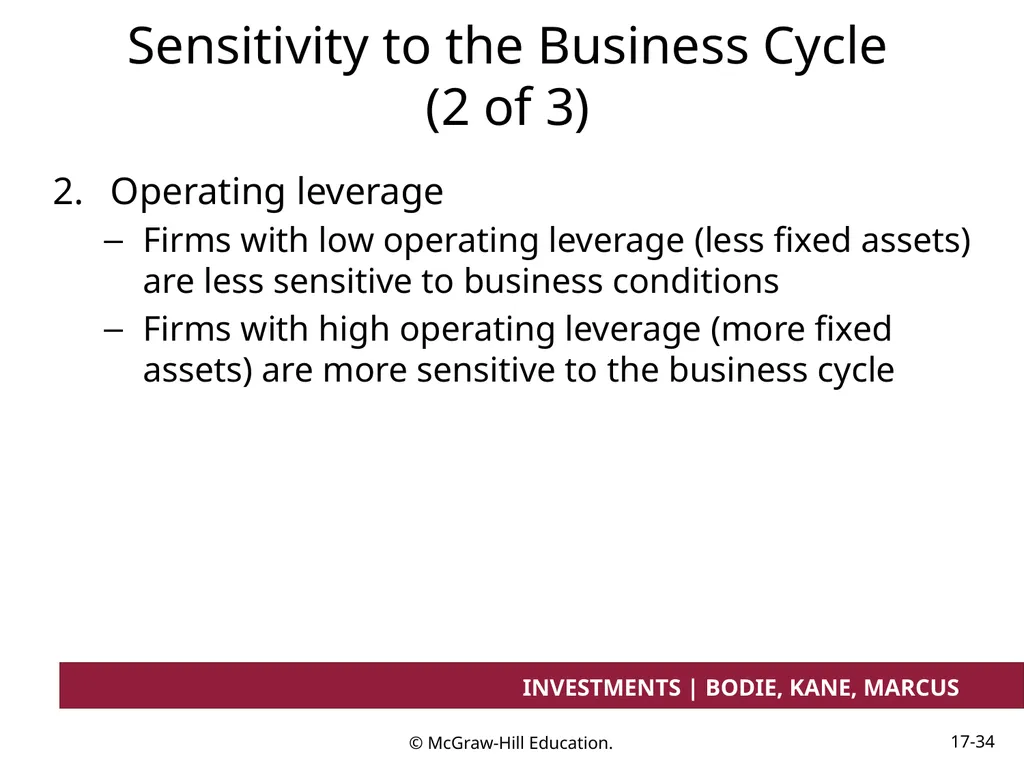
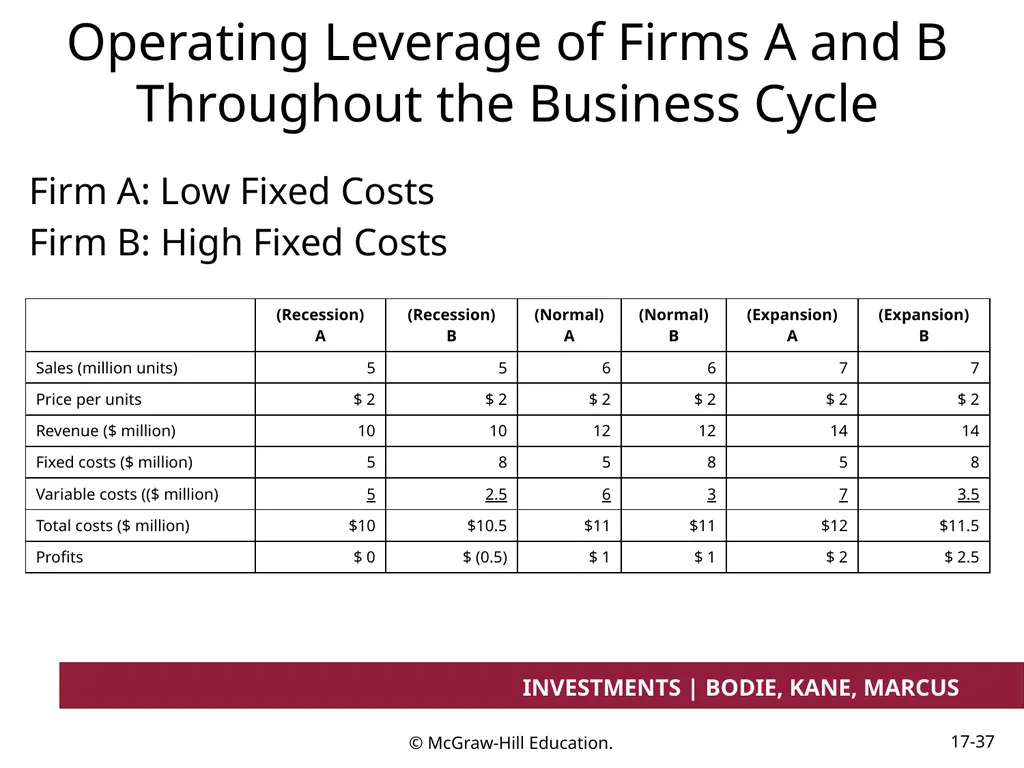
slide34. Sensitivity to the Business Cycle (2 of 3) Operating leverage
Firms with low operating leverage (less fixed assets) are less sensitive to business conditions
Firms with high operating leverage (more fixed assets) are more sensitive to the business cycle<br>
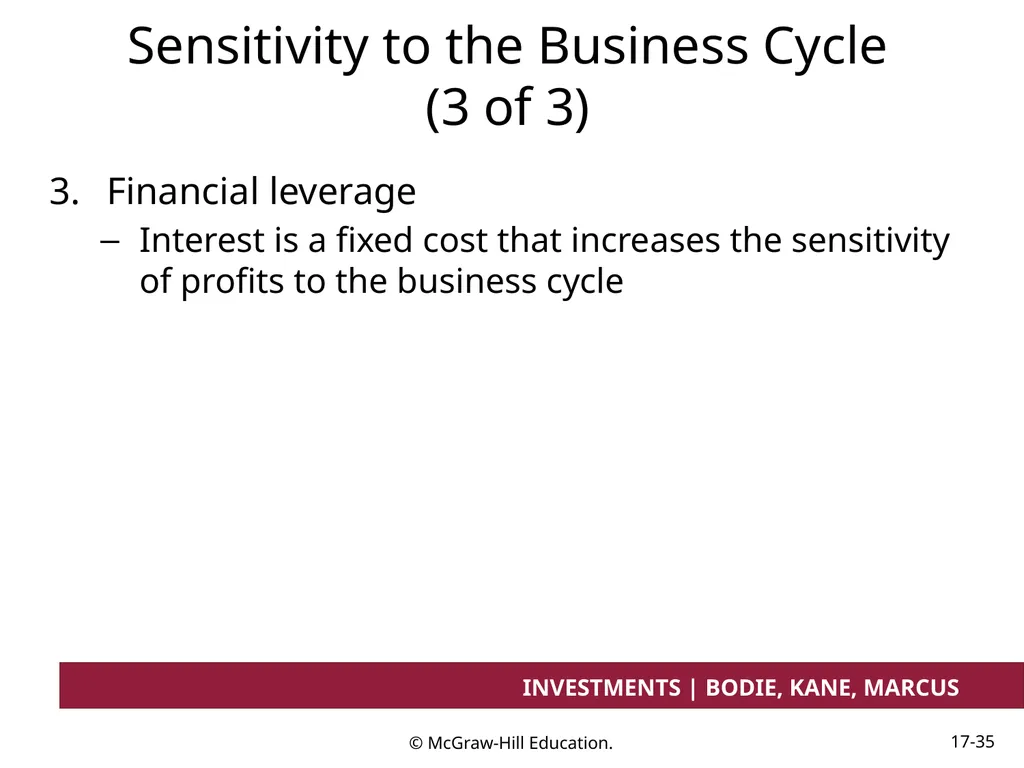
slide35. Sensitivity to the Business Cycle (3 of 3) Financial leverage
Interest is a fixed cost that increases the sensitivity of profits to the business cycle<br>
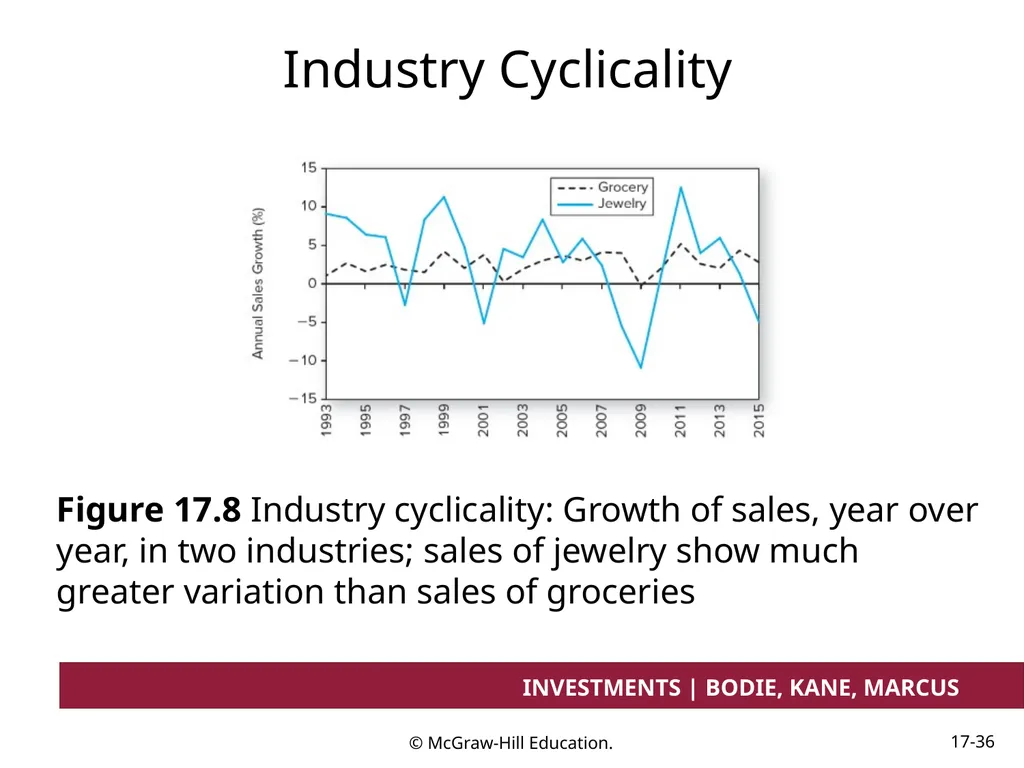
slide36. Industry Cyclicality Figure 17.8 Industry cyclicality: Growth of sales, year over year, in two industries; sales of jewelry show much greater variation than sales of groceries<br>
slide37. Operating Leverage of Firms A and B Throughout the Business Cycle Firm A: Low Fixed Costs
Firm B: High Fixed Costs<br>
slide38. A Stylized Depiction of the Business Cycle<br>
slide39. Sector Rotation (1 of 3) Portfolio is shifted into industries or sectors that should outperform, according to the stage of the business cycle<br>
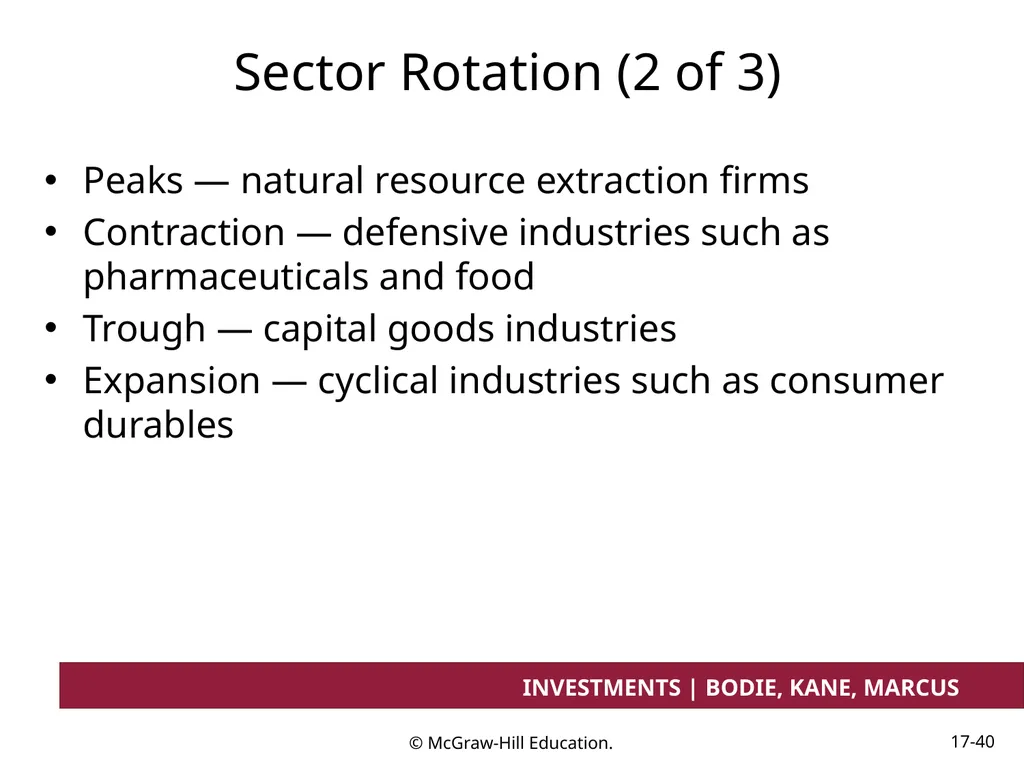
slide40. Sector Rotation (2 of 3) Peaks — natural resource extraction firms
Contraction — defensive industries such as pharmaceuticals and food
Trough — capital goods industries
Expansion — cyclical industries such as consumer durables<br>
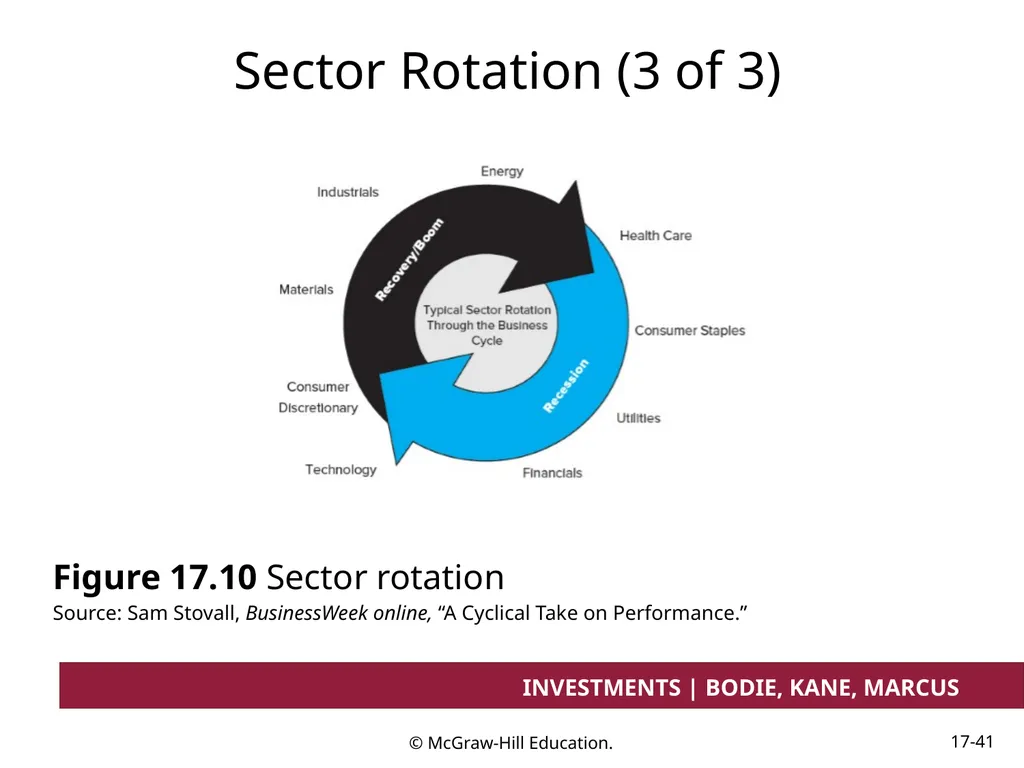
slide41. Sector Rotation (3 of 3) Figure 17.10 Sector rotation
Source: Sam Stovall, BusinessWeek online, “A Cyclical Take on Performance.”<br>
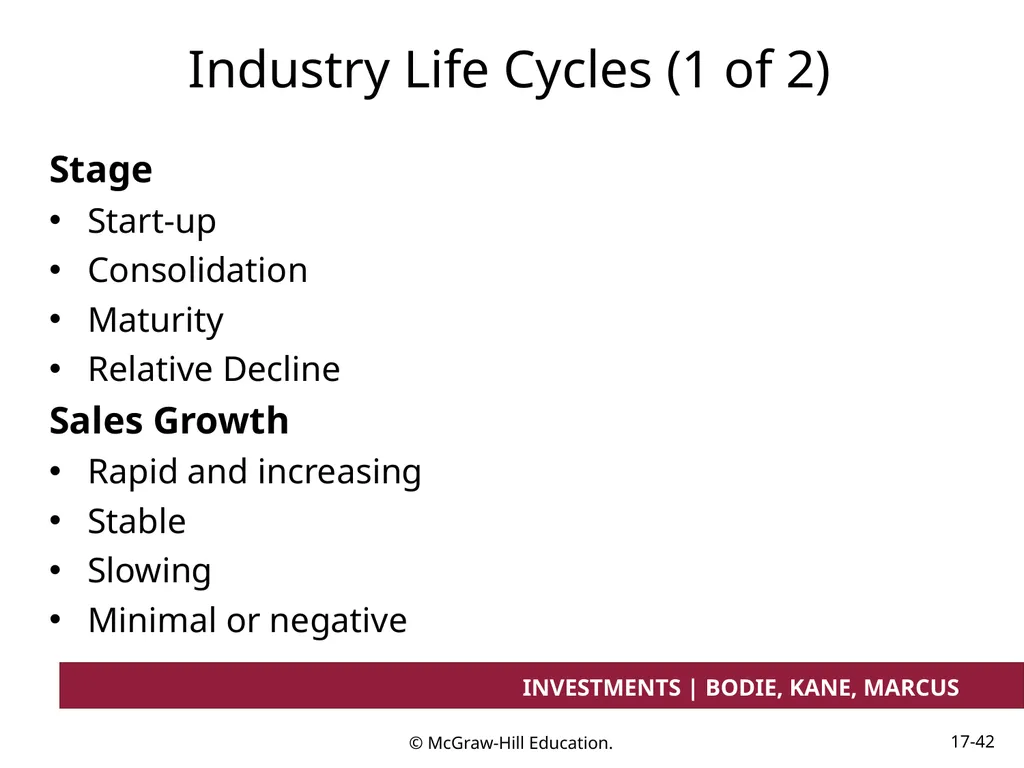
slide42. Industry Life Cycles (1 of 2) Stage
Start-up
Consolidation
Maturity
Relative Decline
Sales Growth
Rapid and increasing
Stable
Slowing
Minimal or negative<br>
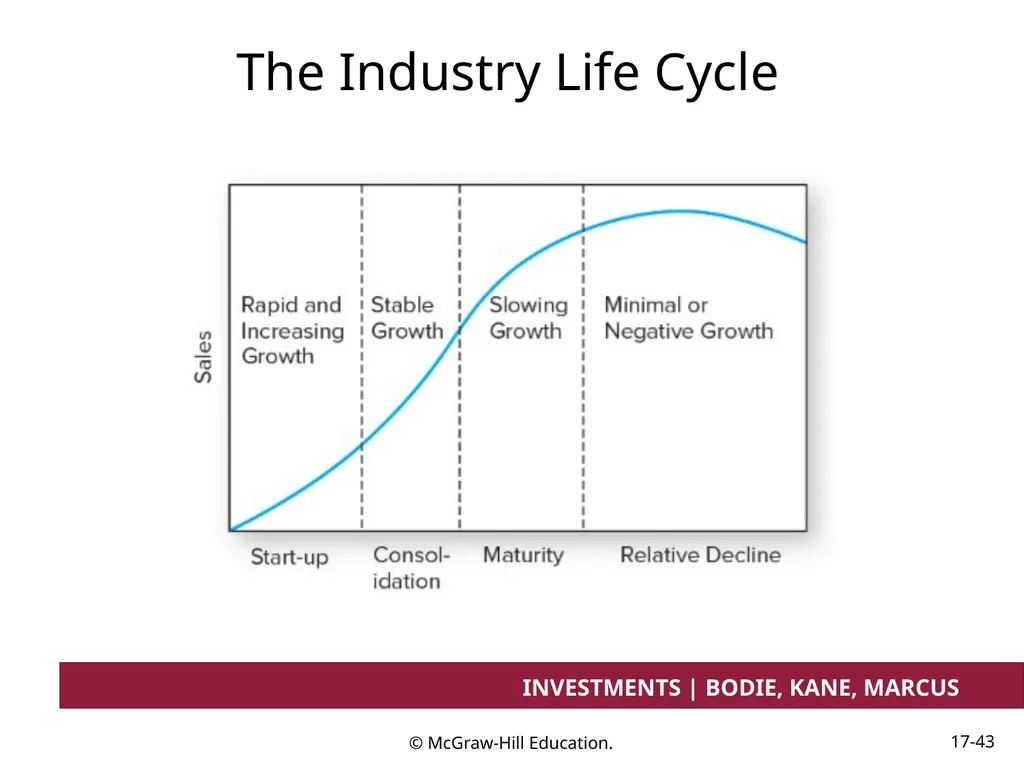
slide43. The Industry Life Cycle<br>
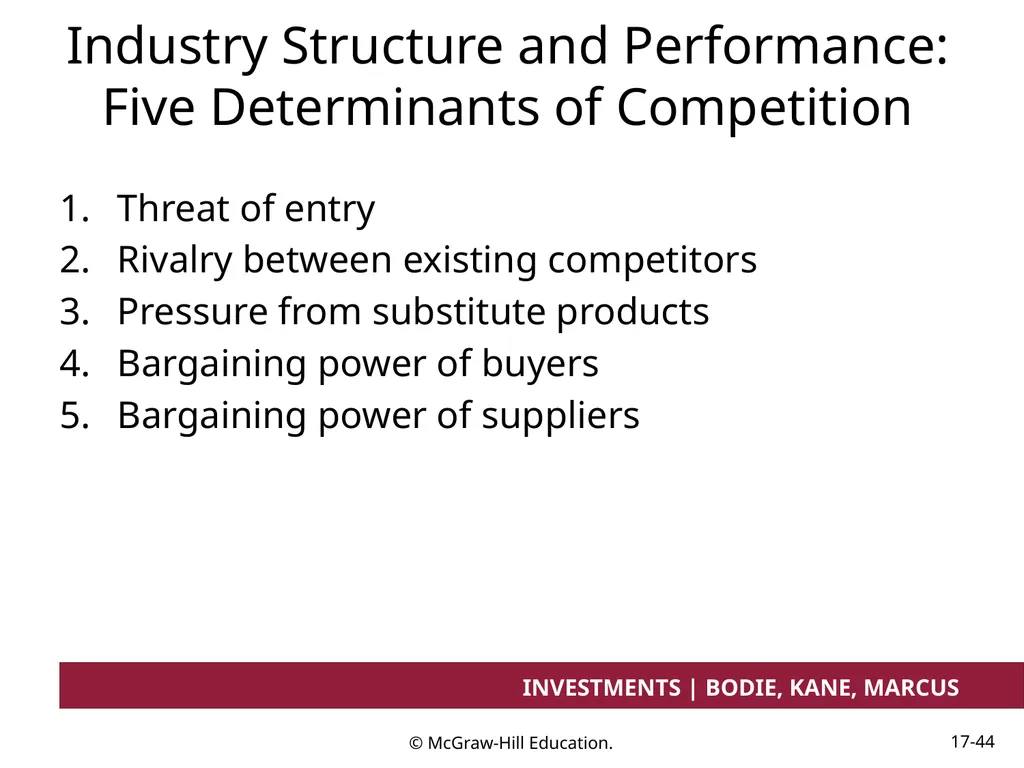
slide44. Industry Structure and Performance: Five Determinants of Competition Threat of entry
Rivalry between existing competitors
Pressure from substitute products
Bargaining power of buyers
Bargaining power of suppliers<br>
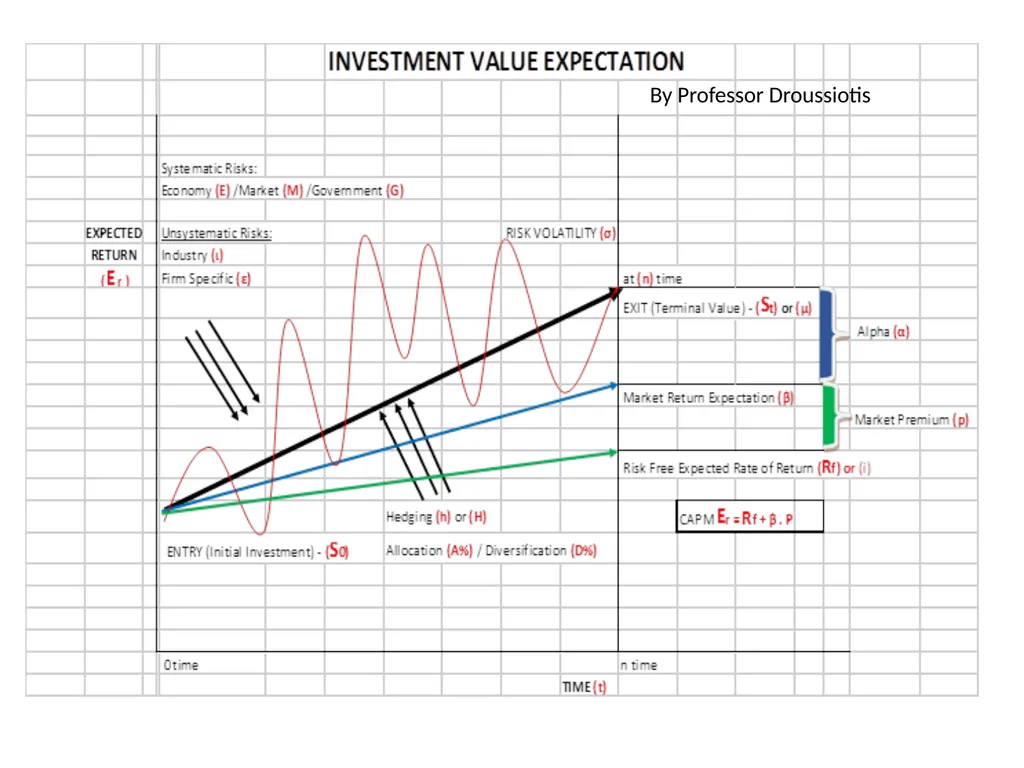
slide45. By Professor Droussiotis<br>
slide46. End of Presentation<br>
Macroeconomic and Industry Analysis INVESTMENTS | BODIE, KANE, MARCUS © McGraw-Hill Education. All rights reserved. Authorized only for instructor use in the classroom. No reproduction or further distribution permitted without the prior written consent of McGraw-Hill Education.<br>
slide2. Fundamental Analysis Intrinsic value comes from its earnings /return prospects Earnings Growth Time VALUE EXPECTATION Firm Specific (Earnings, Growth Expectation)
Investments (Bonds, Equity, Derivatives)
New Concept/Idea, Start-up<br>
slide3. Fundamental Analysis Intrinsic value comes from its earnings/return prospects Earnings Growth Time VALUE EXPECTATION Firm Specific (Earnings, Growth Expectation)
Investments (Bonds, Equity, Derivatives)
New Concept/Idea, Start-up 4 Factors Before Investing:
Expected Return/Earnings
Measuring Risk
Set Time
Apply Allocation<br>
slide4. Fundamental Analysis Intrinsic value comes from its earnings prospects determined by: Earnings Growth Time The global economic environment
Economic factors affecting the firm’s industry
The position of the firm within its industry (Competition)<br>
slide5. Fundamental Analysis Intrinsic value comes from its earnings prospects determined by: Earnings Growth Time The global economic environment
Economic factors affecting the firm’s industry
The position of the firm within its industry<br>
slide6. Fundamental Analysis Intrinsic value comes from its earnings prospects determined by: Earnings Growth Time The global economic environment (Political, FX, Government)
Economic factors affecting the firm’s industry (GDP/ Interest Rates / Unemployment / Inflation)
The position of the firm within its industry Hedging Risk
Diversification /Allocation
Efficiency /Optimization<br>
slide7. The Domestic Macro economy Stock prices rise with earnings
P/E ratios are normal range: 12-25
Forecasting the performance of the broad market begins with an assessment of the economy as a whole<br>
slide8. S&P 500 Index versus Earnings Per Share Figure 17.2 S&P 500 index versus earnings per share
Source: Author’s calculations using data from The Economic Report of the President.<br>
slide9. The Domestic Macro economy: Key Variables Gross domestic product
Unemployment rates
Inflation
Interest rates
Budget deficit
Sentiment<br>
slide10. Demand and Supply Shocks<br>
slide11. Demand-side Policy Fiscal policy —
Monetary policy —<br>
slide12. Fiscal Policy (1 of 2) Most direct way to stimulate or slow the economy
Formulation of fiscal policy is often a slow, cumbersome political process<br>
slide13. Fiscal Policy (2 of 2) The net effect of fiscal policy:
Budget surplus or deficit
Deficit stimulates the economy because:
Spending increases demand for goods > increased taxes reduces the demand for goods<br>
slide14. Monetary Policy (1 of 2) Money supply manipulation to influence economic activity
Increasing the money supply lowers interest rates stimulates the economy
Less immediate effect than fiscal policy<br>
slide15. Monetary Policy (2 of 2) Tools of monetary policy:
Open market operations
Discount rate
Reserve requirements<br>
slide16. Supply-Side Policies Creates an environment in which workers and owners of capital have the maximum incentive and means to produce and develop goods
Supply-siders focus on how tax policy can improve incentives to work and invest<br>
slide17. Business Cycles The transition points across cycles are called peaks and troughs
Peak:
Trough:<br>
slide18. The Business Cycle<br>
slide19. Economic Indicators (1 of 4) Leading indicators:
Coincident indicators:
Lagging indicators:<br>
slide20. Economic Indicators (2 of 4) Table 17.2 Indexes of Economic Indicators
Leading Indicators
Average weekly hours of production workers (manufacturing)
Initial claims for unemployment insurance
Manufacturers' new orders (consumer goods and materials industries)
Institute of Supply Management's "Index of New Orders"
New orders for nondefense capital goods
New private housing units authorized by local building permits<br>
slide21. Economic Indicators (3 of 4) Yield curve slope: 10-year Treasury minus federal funds rate
Stock prices, 500 common stocks
Leading index of credit market conditions
Index of consumer expectations for business conditions
Coincident Indicators
Employees on nonagricultural payrolls
Personal income less transfer payments
Industrial production
Manufacturing and trade sales<br>
slide22. Economic Indicators (4 of 4) Lagging Indicators
Average duration of unemployment
Ratio of trade inventories to sales
Change in index of labor cost per unit of output
Average prime rate charged by banks
Commercial and industrial loans outstanding
Ratio of consumer installment credit outstanding to personal income
Change in consumer price index for services
Source: The Conference Board, Business Cycle Indicators, June 2016.<br>
slide23. Indexes of Leading, Coincident, and Lagging Indicators (1 of 3) Index of Leading Indicators<br>
slide24. Indexes of Leading, Coincident, and Lagging Indicators (2 of 3) Index of Coincident Indicators<br>
slide25. Indexes of Leading, Coincident, and Lagging Indicators (3 of 3) Index of Lagging Indicators<br>
slide26. Economic Calendar (1 of 2) Many sources, such as The Wall Street Journal and Yahoo! Finance, publish the public announcement dates of various economic statistics<br>
slide27. Economic Calendar (2 of 2) Figure 17.4 Economic Calendar at yahoo!, week of June 14, 2016
Source: yahoo!, Finance, Earnings Calendar, biz.yahoo.com, June 20, 2016.<br>
slide28. Industry Analysis Similar to an ailing macro economy, it is unusual for a firm in a troubled industry to perform well
Economic performance can vary widely across industries<br>
slide29. Return on Equity, 2015-2016<br>
slide30. Industry Stock Price Performance, 2012 vs. 2016<br>
slide31. Defining an Industry North American Industry Classification System, or NAICS codes
Firms with the same four-digit NAICS codes are commonly taken to be in the same industry<br>
slide32. Table 17.5 Examples of NAICS Industry Codes<br>
slide33. Sensitivity to the Business Cycle (1 of 3) Three factors determine a firm’s sensitivity to the business cycle:
Sensitivity of sales
Necessities vs. discretionary goods
Items that are not sensitive to income levels (such as tobacco and movies) vs. items that are, (such as machine tools, steel, autos)<br>
slide34. Sensitivity to the Business Cycle (2 of 3) Operating leverage
Firms with low operating leverage (less fixed assets) are less sensitive to business conditions
Firms with high operating leverage (more fixed assets) are more sensitive to the business cycle<br>
slide35. Sensitivity to the Business Cycle (3 of 3) Financial leverage
Interest is a fixed cost that increases the sensitivity of profits to the business cycle<br>
slide36. Industry Cyclicality Figure 17.8 Industry cyclicality: Growth of sales, year over year, in two industries; sales of jewelry show much greater variation than sales of groceries<br>
slide37. Operating Leverage of Firms A and B Throughout the Business Cycle Firm A: Low Fixed Costs
Firm B: High Fixed Costs<br>
slide38. A Stylized Depiction of the Business Cycle<br>
slide39. Sector Rotation (1 of 3) Portfolio is shifted into industries or sectors that should outperform, according to the stage of the business cycle<br>
slide40. Sector Rotation (2 of 3) Peaks — natural resource extraction firms
Contraction — defensive industries such as pharmaceuticals and food
Trough — capital goods industries
Expansion — cyclical industries such as consumer durables<br>
slide41. Sector Rotation (3 of 3) Figure 17.10 Sector rotation
Source: Sam Stovall, BusinessWeek online, “A Cyclical Take on Performance.”<br>
slide42. Industry Life Cycles (1 of 2) Stage
Start-up
Consolidation
Maturity
Relative Decline
Sales Growth
Rapid and increasing
Stable
Slowing
Minimal or negative<br>
slide43. The Industry Life Cycle<br>
slide44. Industry Structure and Performance: Five Determinants of Competition Threat of entry
Rivalry between existing competitors
Pressure from substitute products
Bargaining power of buyers
Bargaining power of suppliers<br>
slide45. By Professor Droussiotis<br>
slide46. End of Presentation<br>