Communication Services Sector Overview Brooks Reiber and Jack Reagan Table of Contents Industry Overview Business Analysis Economic Analysis Financial Analysis Valuation Analysis Recommendation Industry Overview Sector Description YTD
Related Topics
Share
Embed code
Download this presentation From Below
"Communication Services Sector Overview Brooks" is the property of its rightful owner. Permission is granted to
download and print the materials on this website for personal, non-commercial use only, and to display it
on your personal computer provided you do not modify the materials and that you retain all copyright
notices contained in the materials. By downloading content from our website, you accept the terms of this
agreement.
Presentation Transcript
01
Communication Services Sector Overview Brooks Reiber and Jack Reagan<br>
02
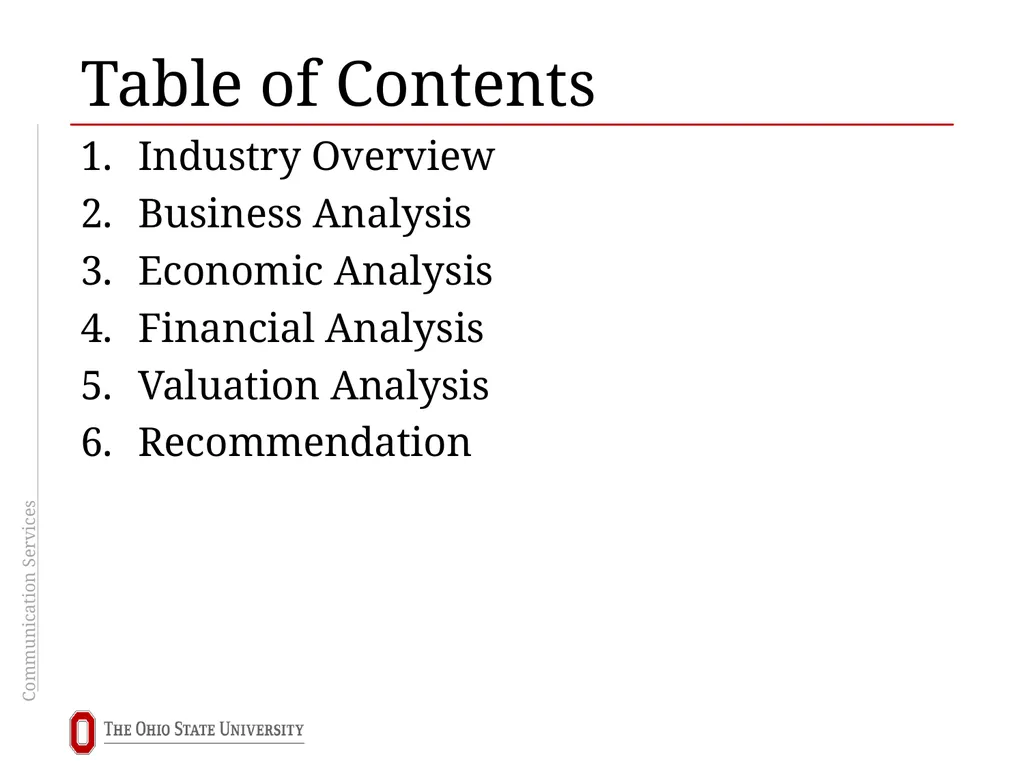
Table of Contents Industry Overview
Business Analysis
Economic Analysis
Financial Analysis
Valuation Analysis
Recommendation<br>
03
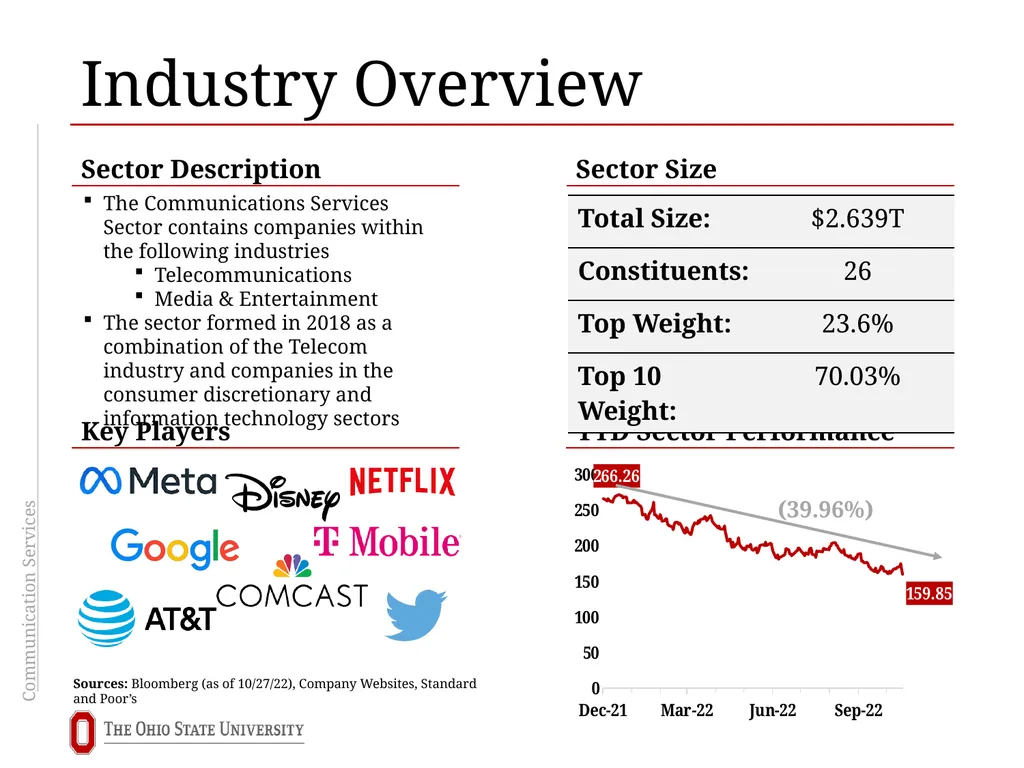
Industry Overview Sector Description YTD Sector Performance Key Players Sources: Bloomberg (as of 10/27/22), Company Websites, Standard and Poor’s Sector Size The Communications Services Sector contains companies within the following industries
Telecommunications
Media & Entertainment
The sector formed in 2018 as a combination of the Telecom industry and companies in the consumer discretionary and information technology sectors (39.96%)<br>
04
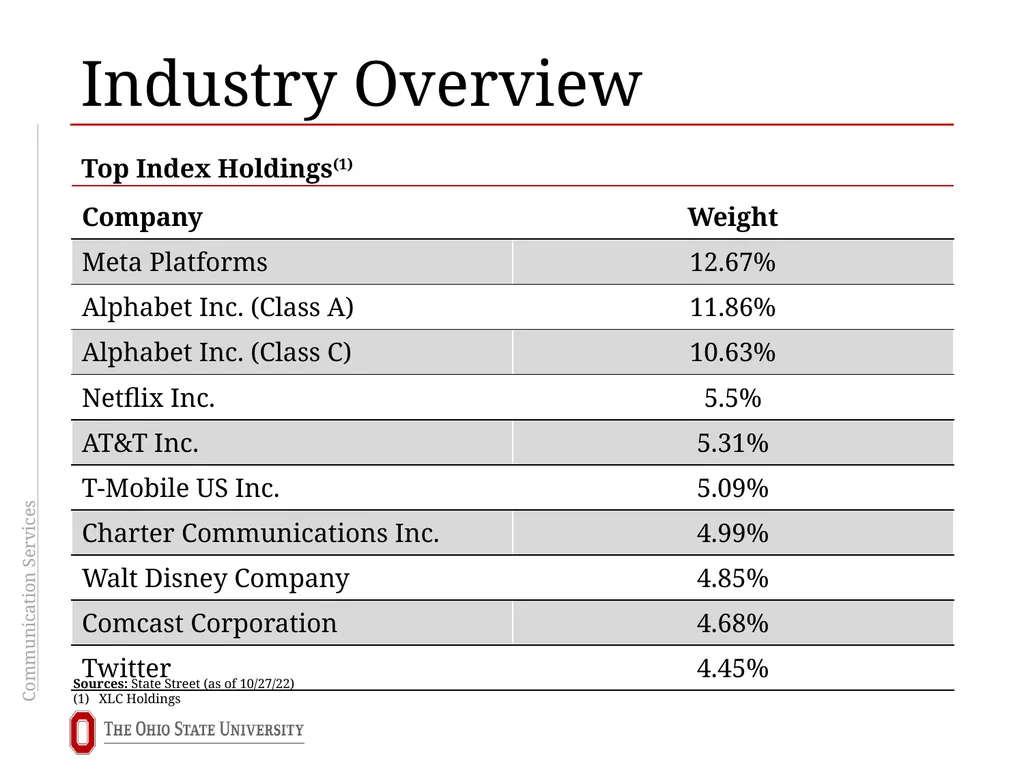
Industry Overview Top Index Holdings(1) Sources: State Street (as of 10/27/22)
XLC Holdings<br>
05
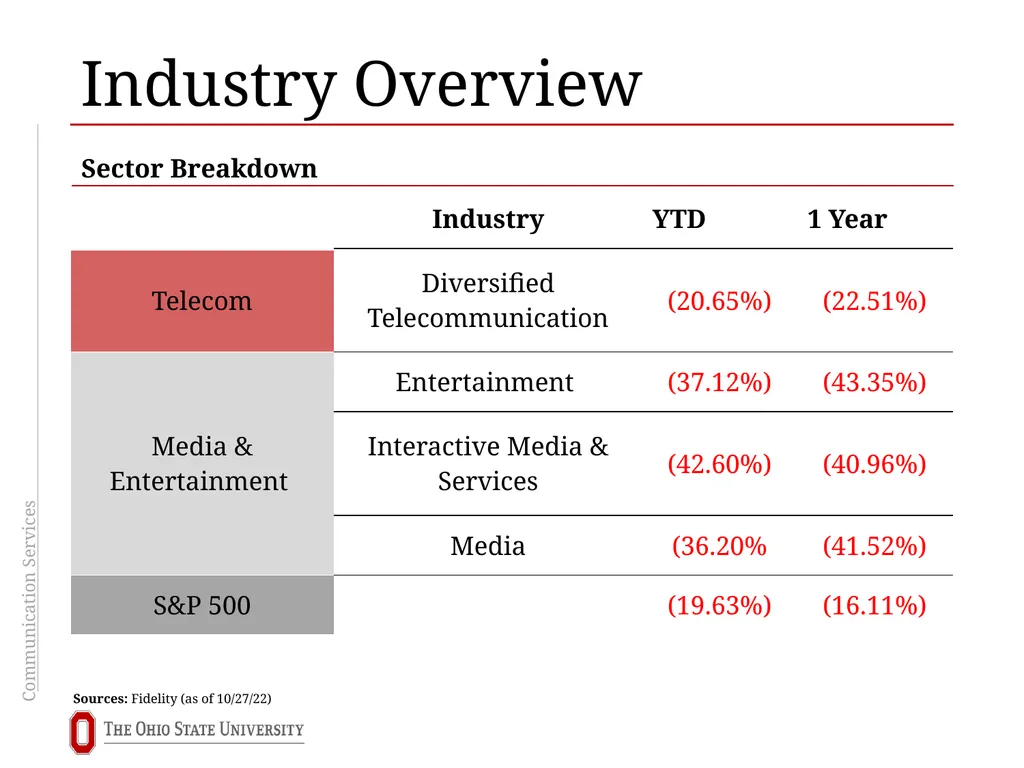
Industry Overview Sector Breakdown Sources: Fidelity (as of 10/27/22)<br>
06
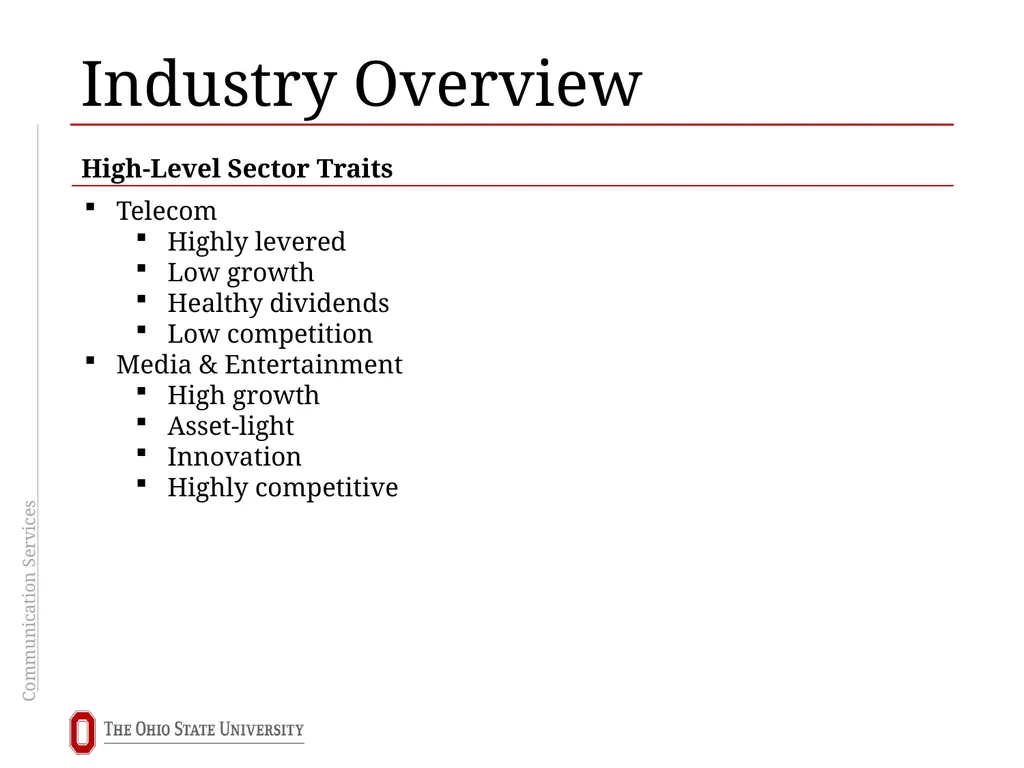
Industry Overview High-Level Sector Traits Telecom
Highly levered
Low growth
Healthy dividends
Low competition
Media & Entertainment
High growth
Asset-light
Innovation
Highly competitive<br>
07
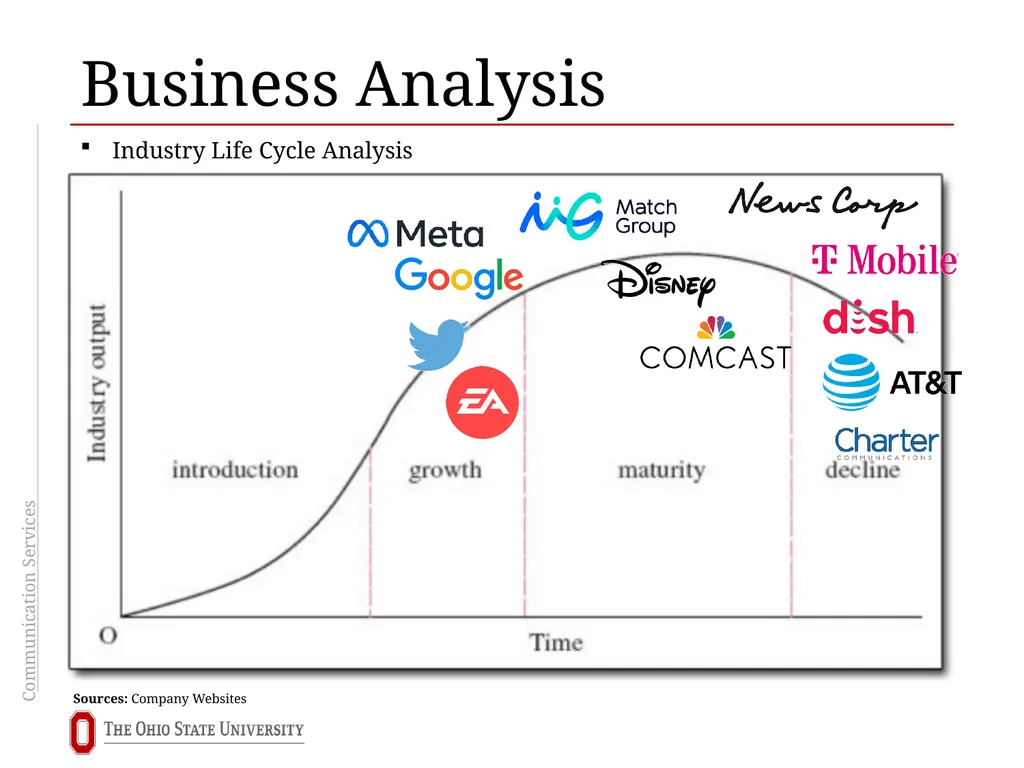
Industry Life Cycle Analysis Business Analysis Sources: Company Websites<br>
08
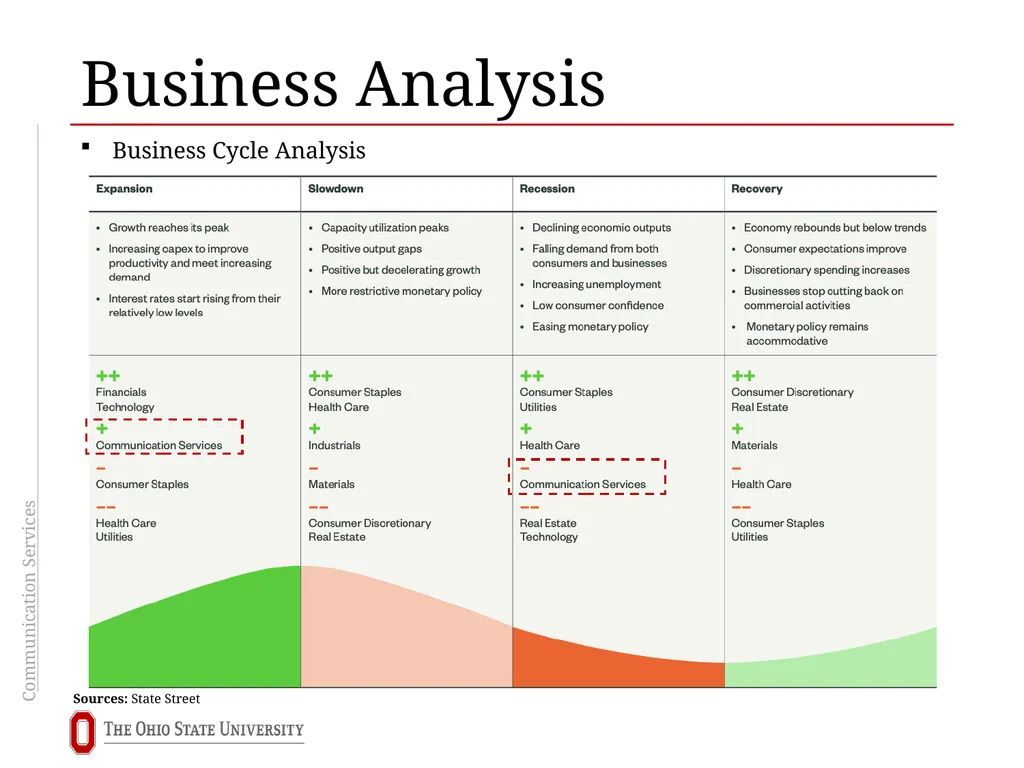
Business Cycle Analysis Business Analysis Sources: State Street<br>
09
Business Analysis<br>
10
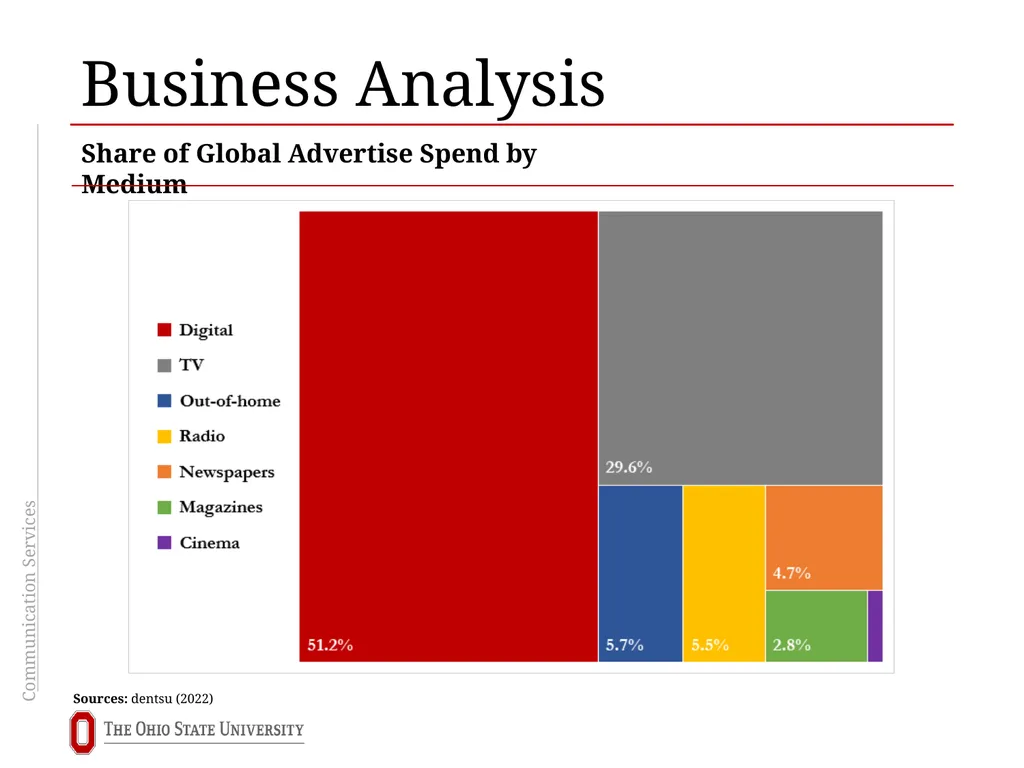
Business Analysis Sources: dentsu (2022) Share of Global Advertise Spend by Medium<br>
11
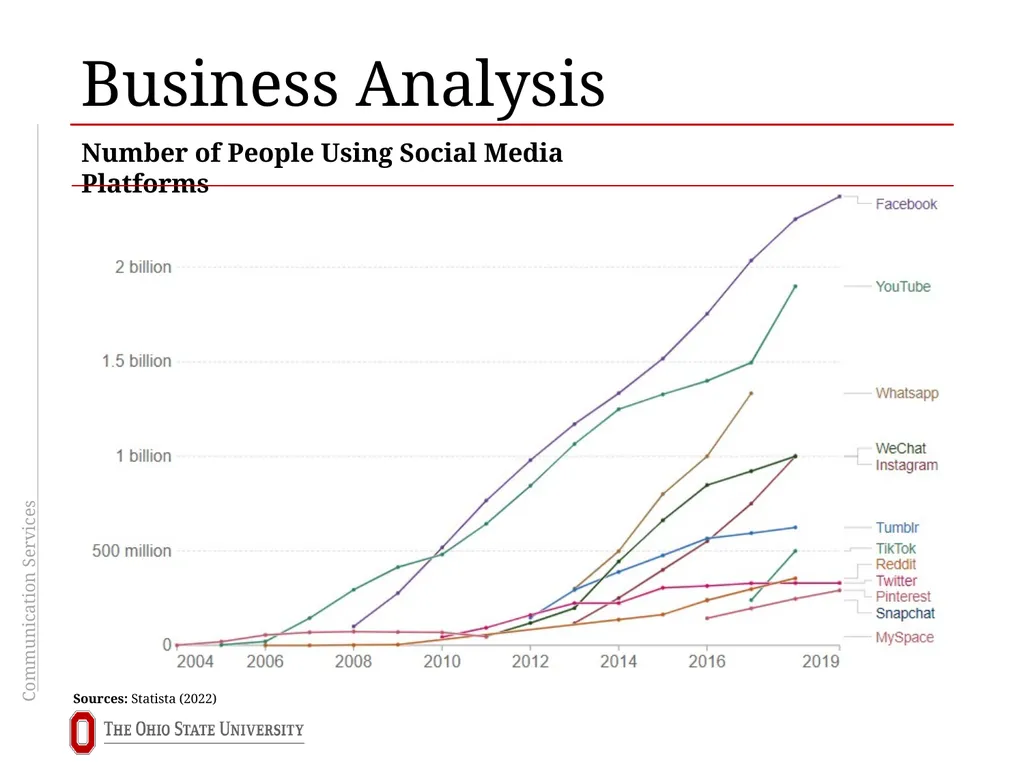
Business Analysis Sources: Statista (2022) Number of People Using Social Media Platforms<br>
12
Business Analysis Sources: Statista (2022)<br>
13
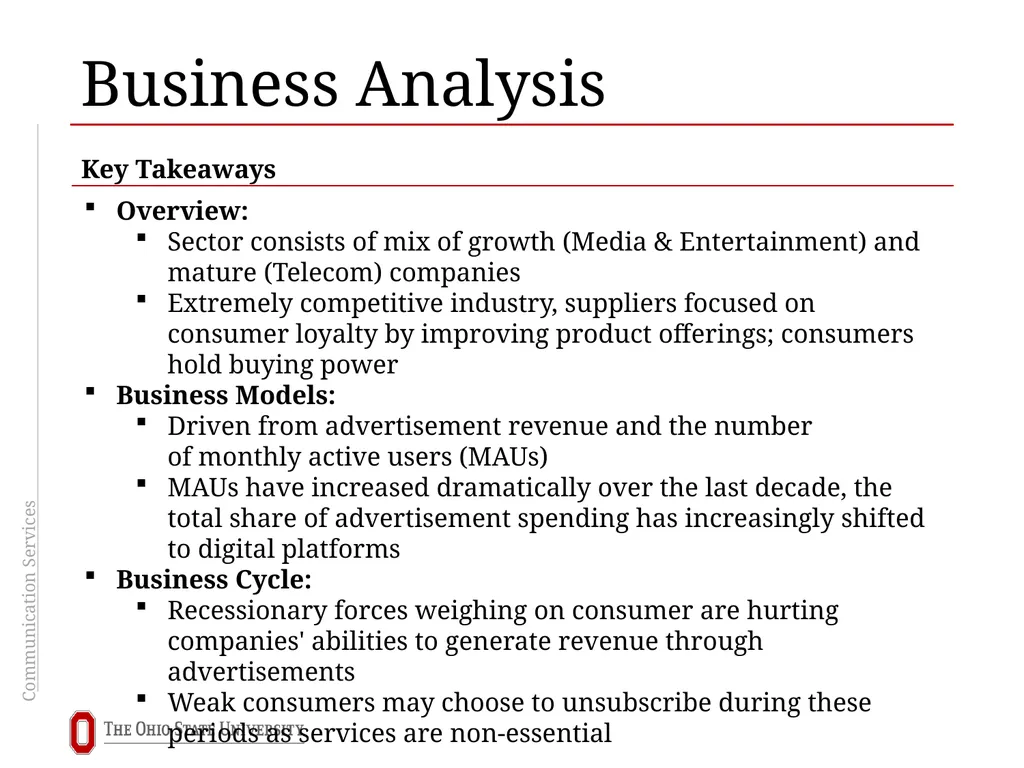
Overview:
Sector consists of mix of growth (Media & Entertainment) and mature (Telecom) companies
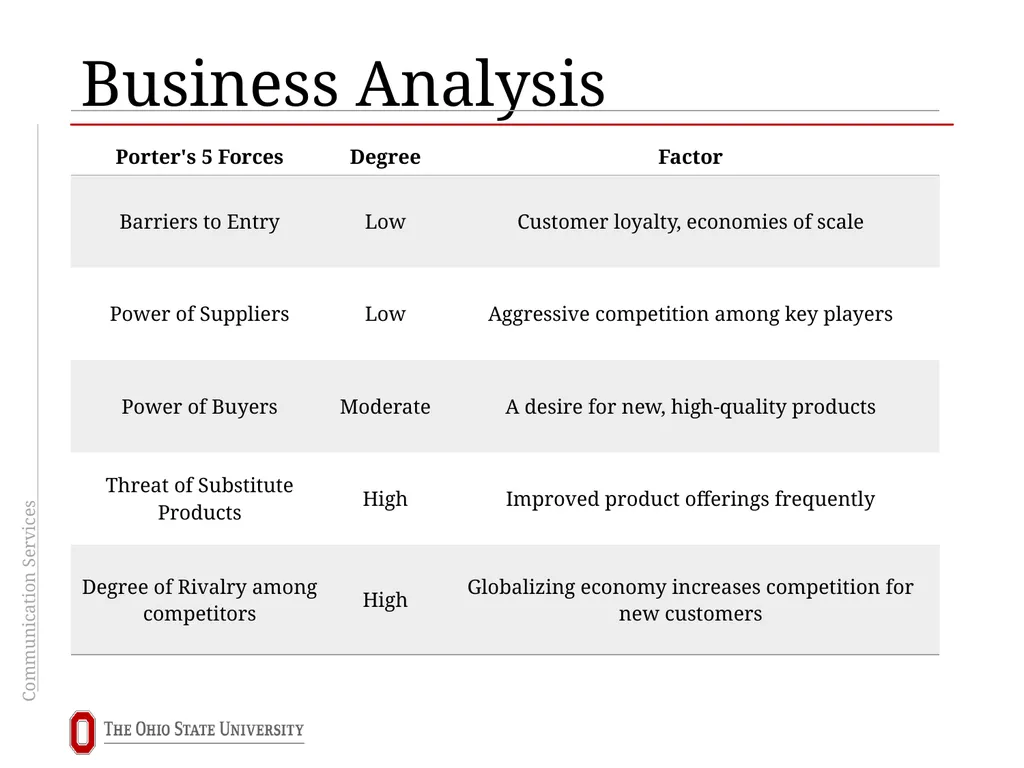
Extremely competitive industry, suppliers focused on consumer loyalty by improving product offerings; consumers hold buying power
Business Models:
Driven from advertisement revenue and the number of monthly active users (MAUs)
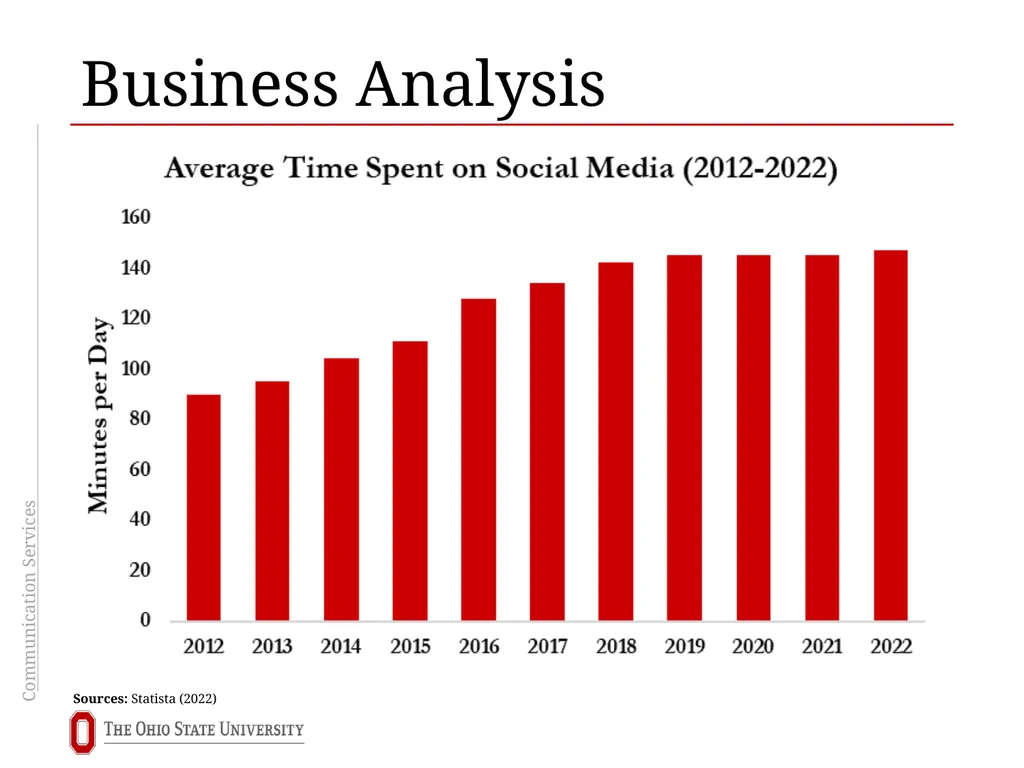
MAUs have increased dramatically over the last decade, the total share of advertisement spending has increasingly shifted to digital platforms
Business Cycle:
Recessionary forces weighing on consumer are hurting companies' abilities to generate revenue through advertisements
Weak consumers may choose to unsubscribe during these periods as services are non-essential Business Analysis Key Takeaways<br>
14
Economic Analysis Correlation to Consumer Spending Sources: Bloomberg (as of 10/27/22)<br>
15
Economic Analysis Correlation to Fed Funds Rate Sources: Bloomberg (as of 10/27/22)<br>
16
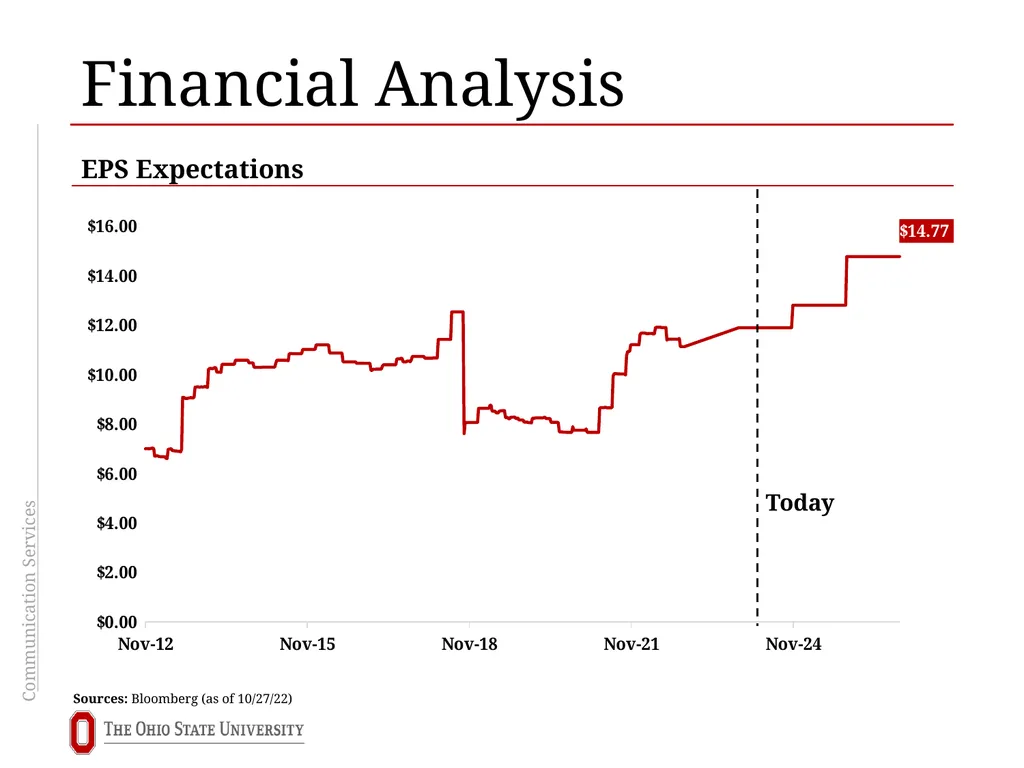
Financial Analysis EPS Expectations Sources: Bloomberg (as of 10/27/22) Today<br>
17
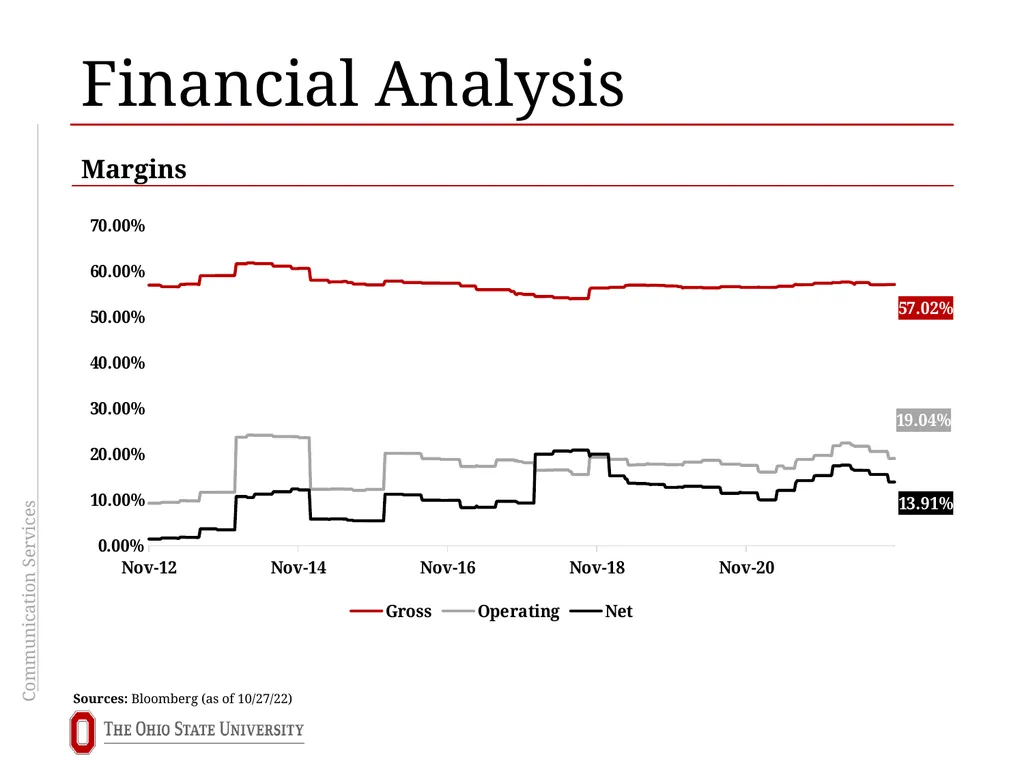
Financial Analysis Sources: Bloomberg (as of 10/27/22) Margins<br>
18
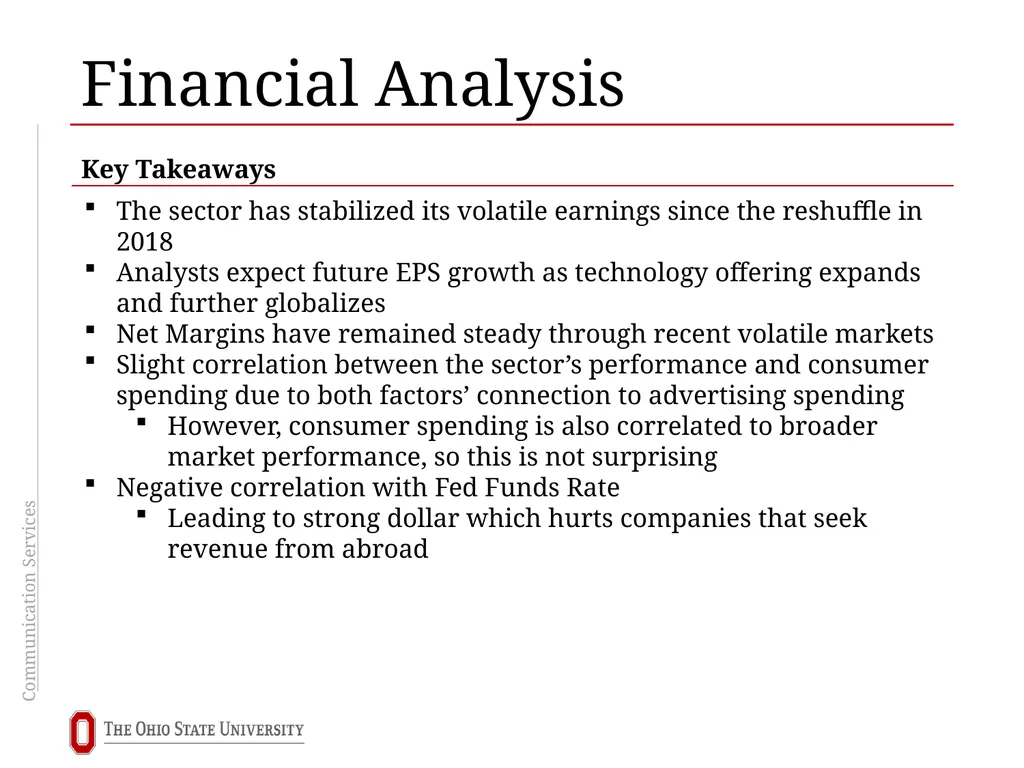
Financial Analysis The sector has stabilized its volatile earnings since the reshuffle in 2018
Analysts expect future EPS growth as technology offering expands and further globalizes
Net Margins have remained steady through recent volatile markets
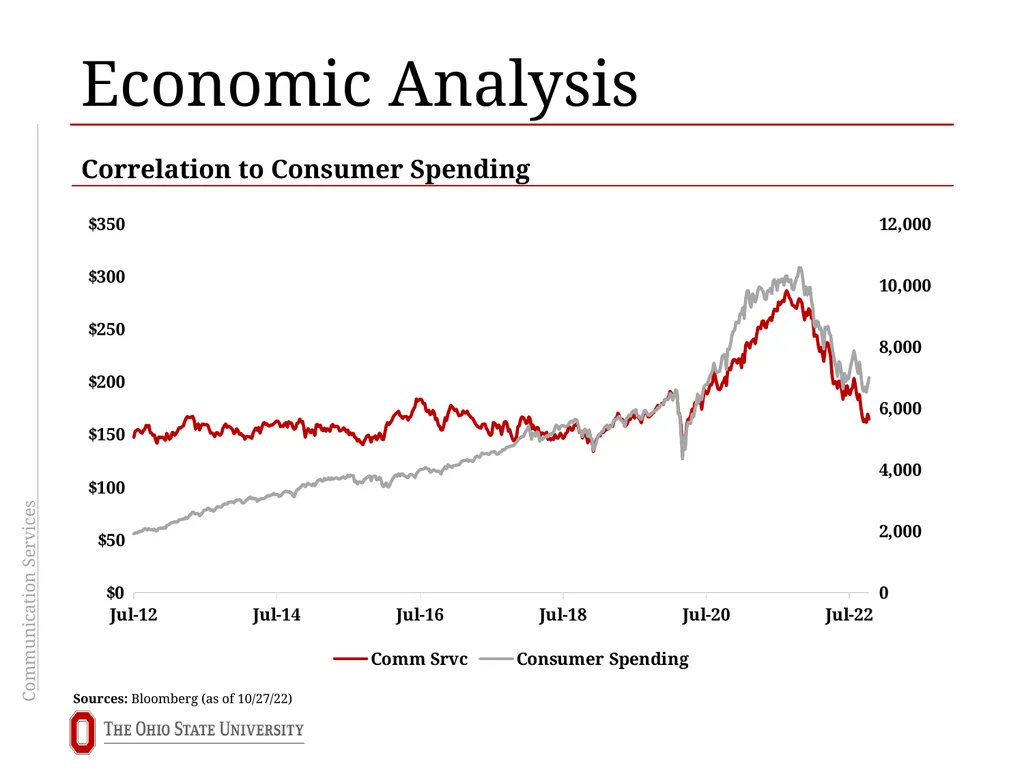
Slight correlation between the sector’s performance and consumer spending due to both factors’ connection to advertising spending
However, consumer spending is also correlated to broader market performance, so this is not surprising
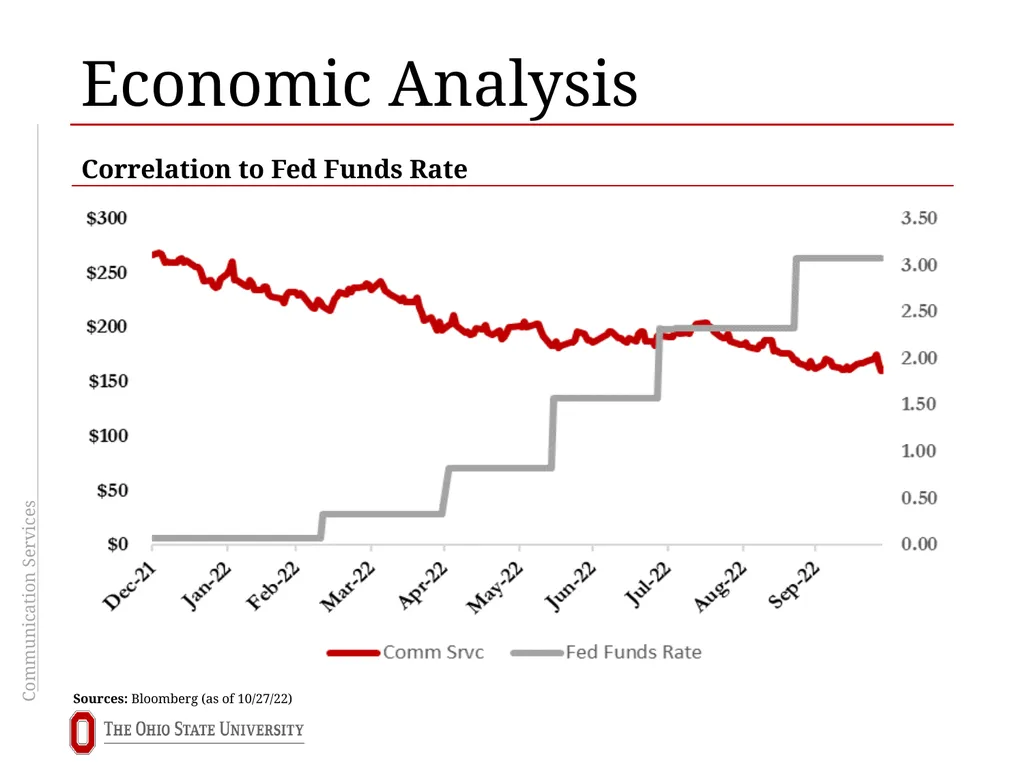
Negative correlation with Fed Funds Rate
Leading to strong dollar which hurts companies that seek revenue from abroad Key Takeaways<br>
19
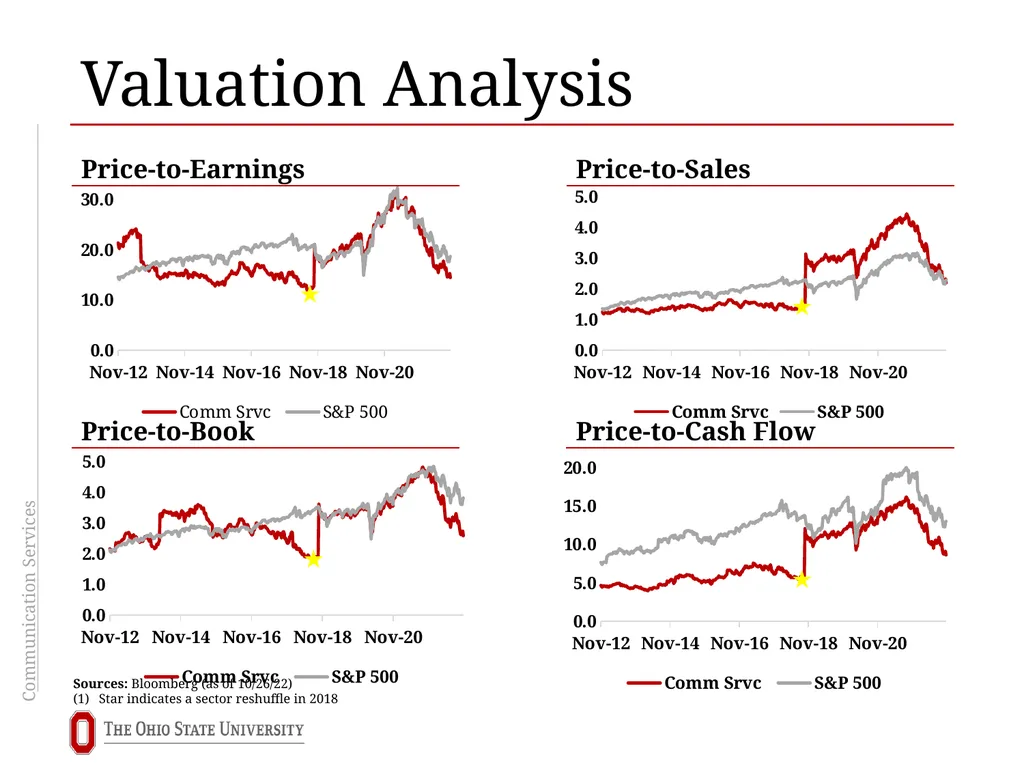
Valuation Analysis Price-to-Earnings Price-to-Cash Flow Price-to-Book Sources: Bloomberg (as of 10/26/22)
Star indicates a sector reshuffle in 2018 Price-to-Sales<br>
20
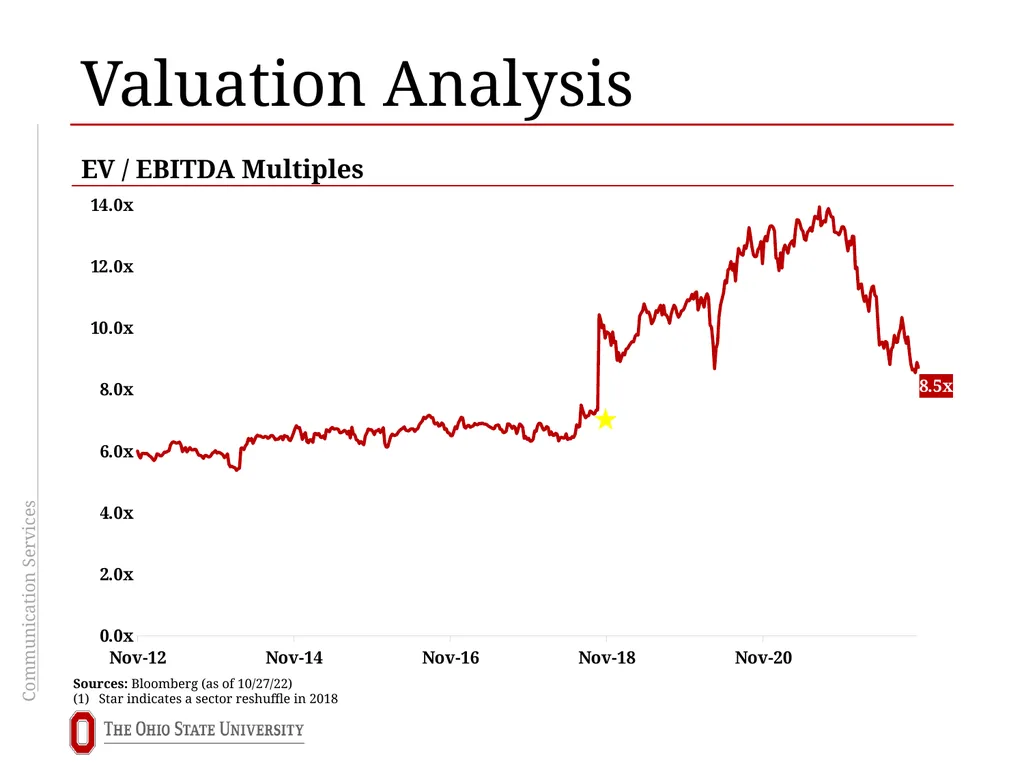
Valuation Analysis EV / EBITDA Multiples Sources: Bloomberg (as of 10/27/22)
Star indicates a sector reshuffle in 2018<br>
21
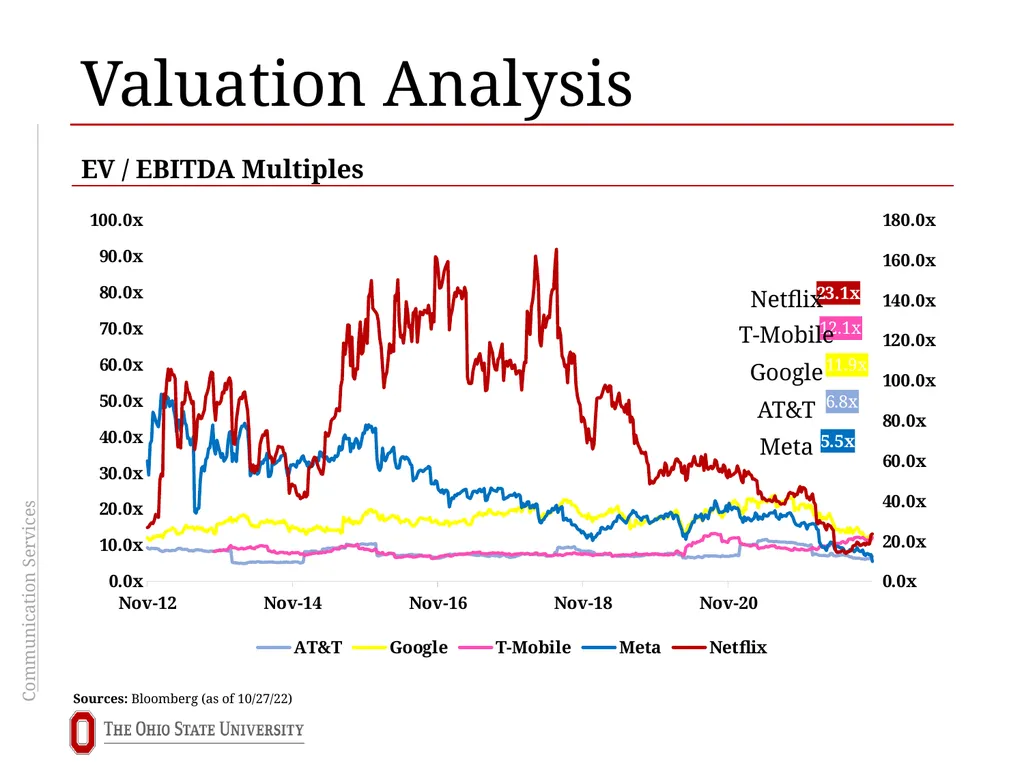
Valuation Analysis Sources: Bloomberg (as of 10/27/22) EV / EBITDA Multiples Meta AT&T Google T-Mobile Netflix<br>
22
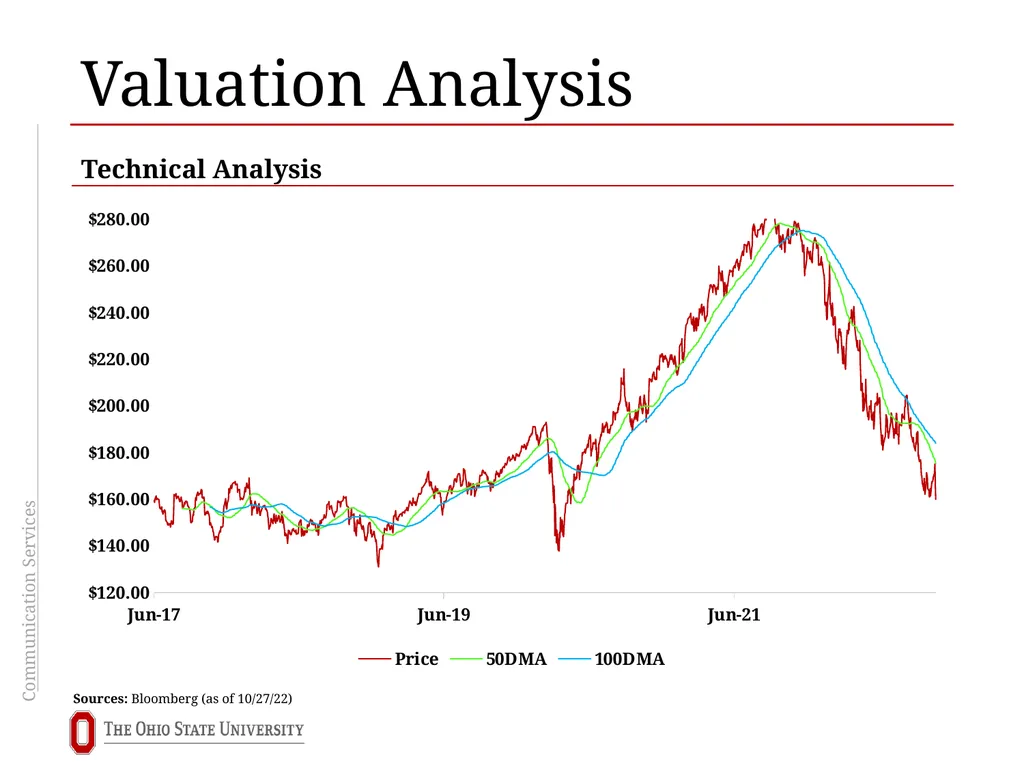
Valuation Analysis Technical Analysis Sources: Bloomberg (as of 10/27/22)<br>
23
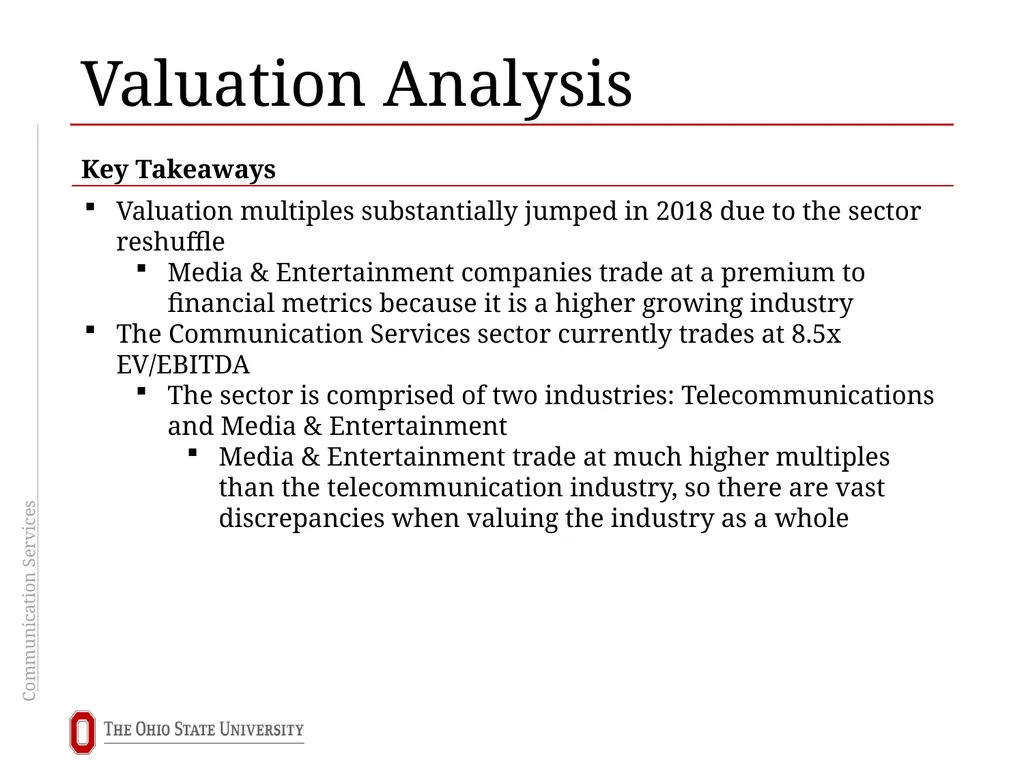
Valuation Analysis Valuation multiples substantially jumped in 2018 due to the sector reshuffle
Media & Entertainment companies trade at a premium to financial metrics because it is a higher growing industry
The Communication Services sector currently trades at 8.5x EV/EBITDA
The sector is comprised of two industries: Telecommunications and Media & Entertainment
Media & Entertainment trade at much higher multiples than the telecommunication industry, so there are vast discrepancies when valuing the industry as a whole Key Takeaways<br>
24
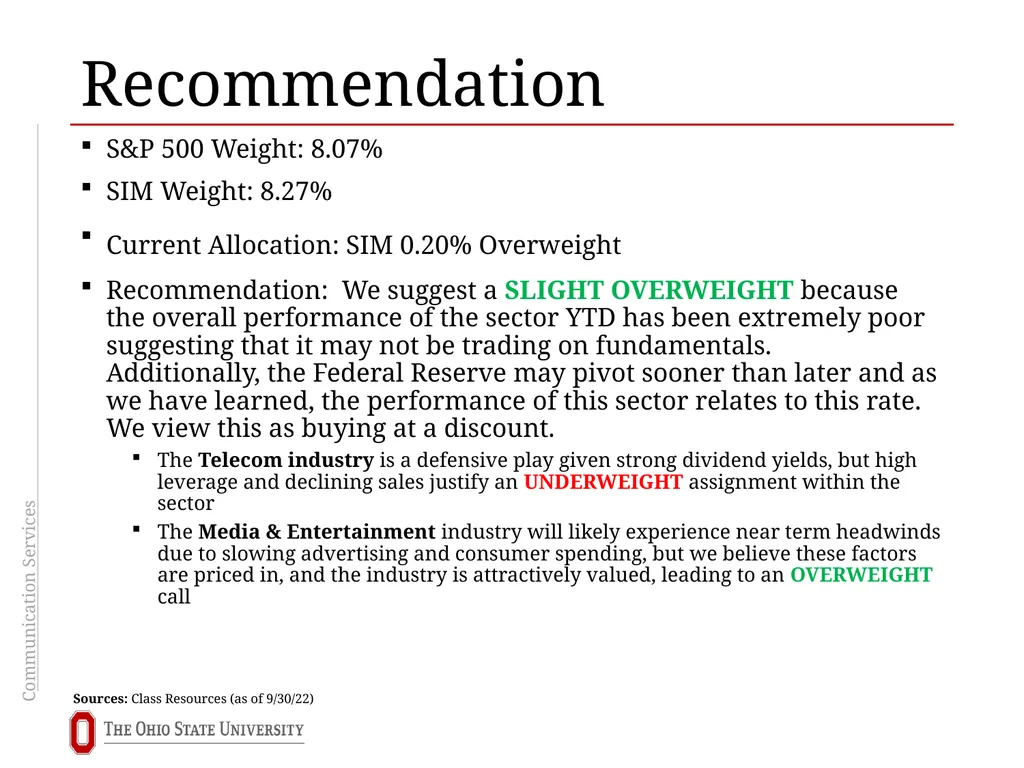
Recommendation S&P 500 Weight: 8.07%
SIM Weight: 8.27%
Current Allocation: SIM 0.20% Overweight
Recommendation: We suggest a SLIGHT OVERWEIGHT because the overall performance of the sector YTD has been extremely poor suggesting that it may not be trading on fundamentals. Additionally, the Federal Reserve may pivot sooner than later and as we have learned, the performance of this sector relates to this rate. We view this as buying at a discount.
The Telecom industry is a defensive play given strong dividend yields, but high leverage and declining sales justify an UNDERWEIGHT assignment within the sector
The Media & Entertainment industry will likely experience near term headwinds due to slowing advertising and consumer spending, but we believe these factors are priced in, and the industry is attractively valued, leading to an OVERWEIGHT call Sources: Class Resources (as of 9/30/22)<br>