Equipment Leasing Finance Industry Snapshot October 2019 Data: Table of Contents 2. Investment 3. Business Health 1. Overall Economy p. 3 2 p. 8 p. 11 Source: U.S. Bureau of Economic Analysis, Keybridge LLC 3 30-Year Quarterly Average
Related Topics
Share
Embed code
Download this presentation From Below
"Equipment Leasing & Finance Industry Snapshot" is the property of its rightful owner. Permission is granted to
download and print the materials on this website for personal, non-commercial use only, and to display it
on your personal computer provided you do not modify the materials and that you retain all copyright
notices contained in the materials. By downloading content from our website, you accept the terms of this
agreement.
Presentation Transcript
01
Equipment Leasing & Finance Industry Snapshot October 2019<br>
02
Data: Table of Contents 2. Investment 3. Business Health 1. Overall Economy p. 3 2 p. 8 p. 11<br>
03
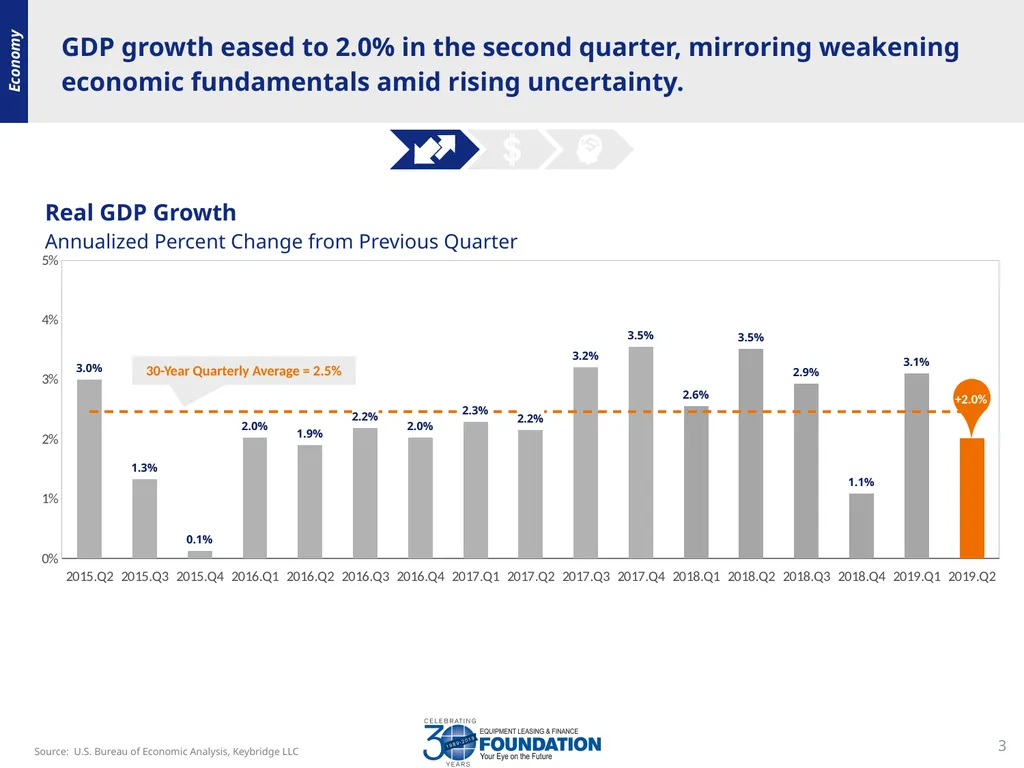
Source: U.S. Bureau of Economic Analysis, Keybridge LLC 3 30-Year Quarterly Average = 2.5% GDP growth eased to 2.0% in the second quarter, mirroring weakening economic fundamentals amid rising uncertainty. Economy<br>
04
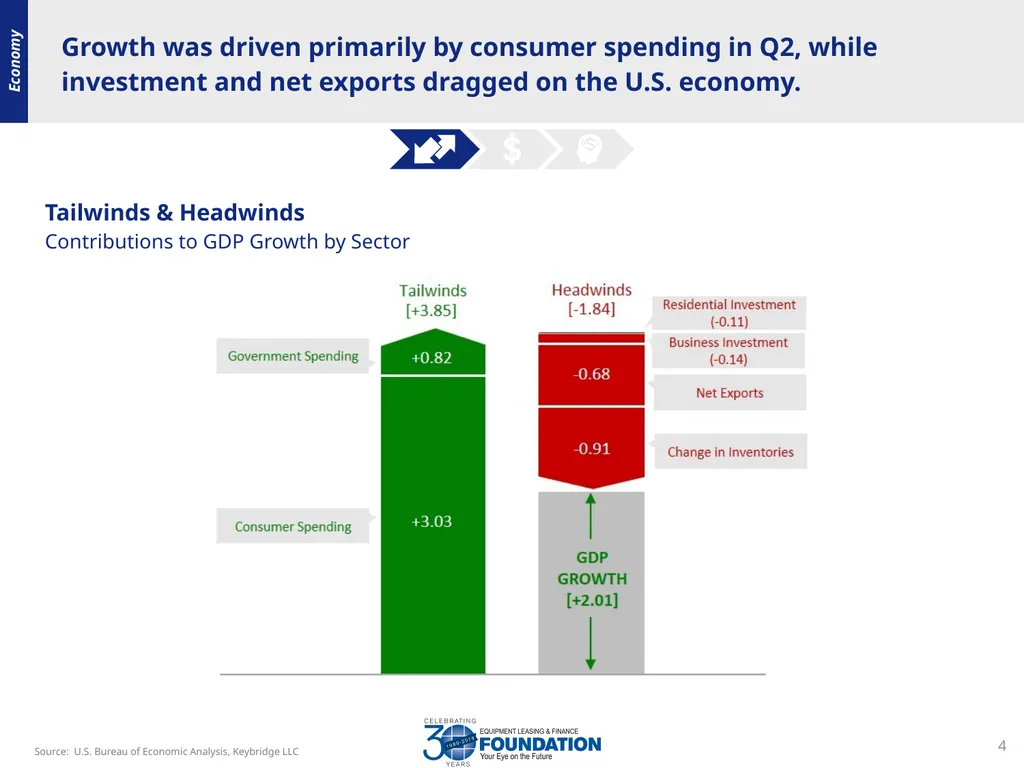
Growth was driven primarily by consumer spending in Q2, while investment and net exports dragged on the U.S. economy. 4 Source: U.S. Bureau of Economic Analysis, Keybridge LLC Economy<br>
05
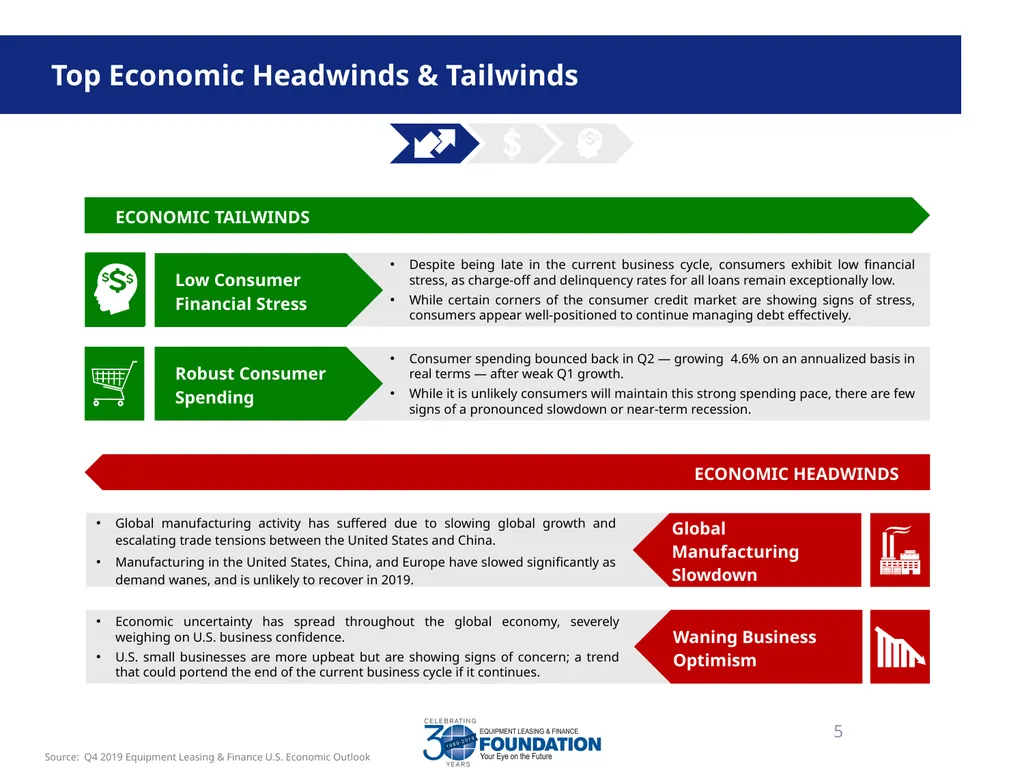
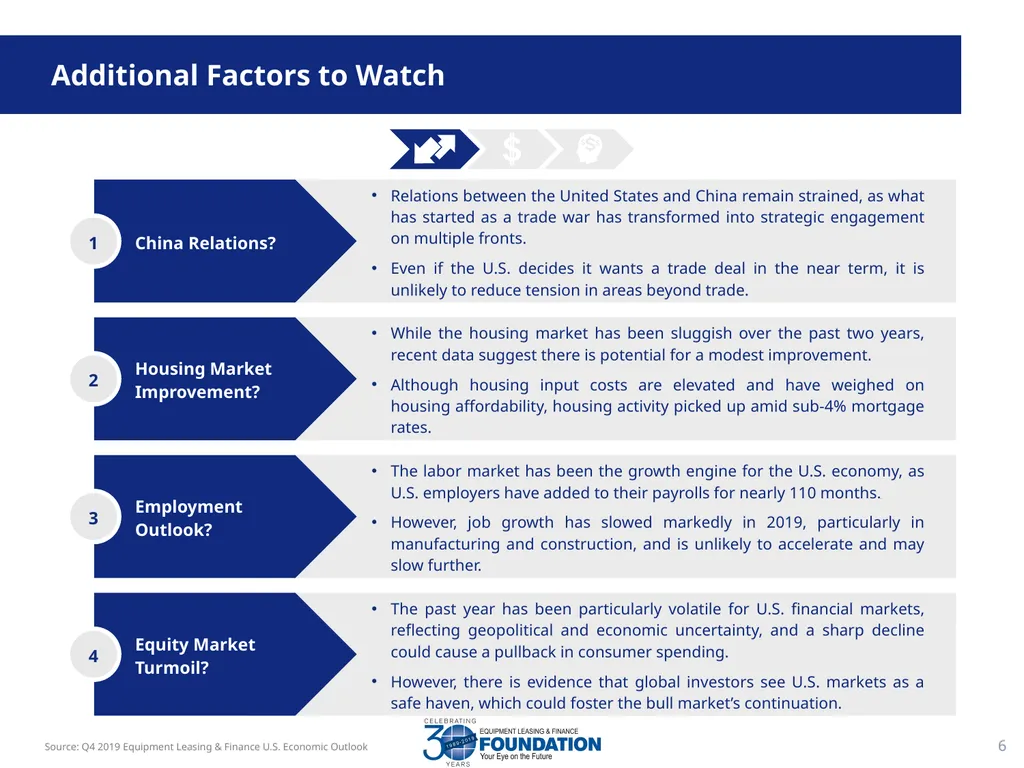
Source: Q4 2019 Equipment Leasing & Finance U.S. Economic Outlook 5 Top Economic Headwinds & Tailwinds ECONOMIC TAILWINDS Consumer spending bounced back in Q2 — growing 4.6% on an annualized basis in real terms — after weak Q1 growth.
While it is unlikely consumers will maintain this strong spending pace, there are few signs of a pronounced slowdown or near-term recession. Robust Consumer Spending ECONOMIC HEADWINDS Economic uncertainty has spread throughout the global economy, severely weighing on U.S. business confidence.
U.S. small businesses are more upbeat but are showing signs of concern; a trend that could portend the end of the current business cycle if it continues. Waning Business Optimism<br>
06
6 Additional Factors to Watch Source: Q4 2019 Equipment Leasing & Finance U.S. Economic Outlook<br>
07
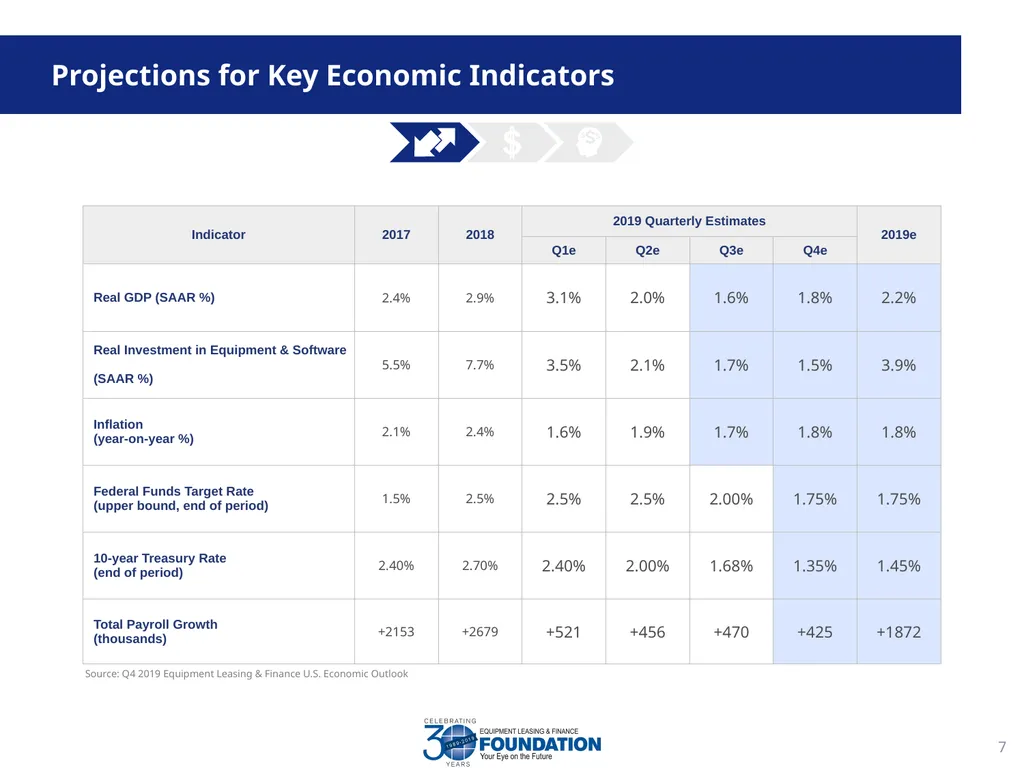
Projections for Key Economic Indicators 7 Source: Q4 2019 Equipment Leasing & Finance U.S. Economic Outlook<br>
08
Business investment contracted in Q2 for the first time since early 2016. Source: U.S. Bureau of Economic Analysis Investment 8<br>
09
Equipment investment growth should remain weak over the remainder of the year, but momentum has improved somewhat since the Q3 Snapshot. Investment 9 Source: Q4 2019 Equipment Leasing & Finance U.S. Economic Outlook
For more information on how to use the Momentum Monitors, see final slide.<br>
10
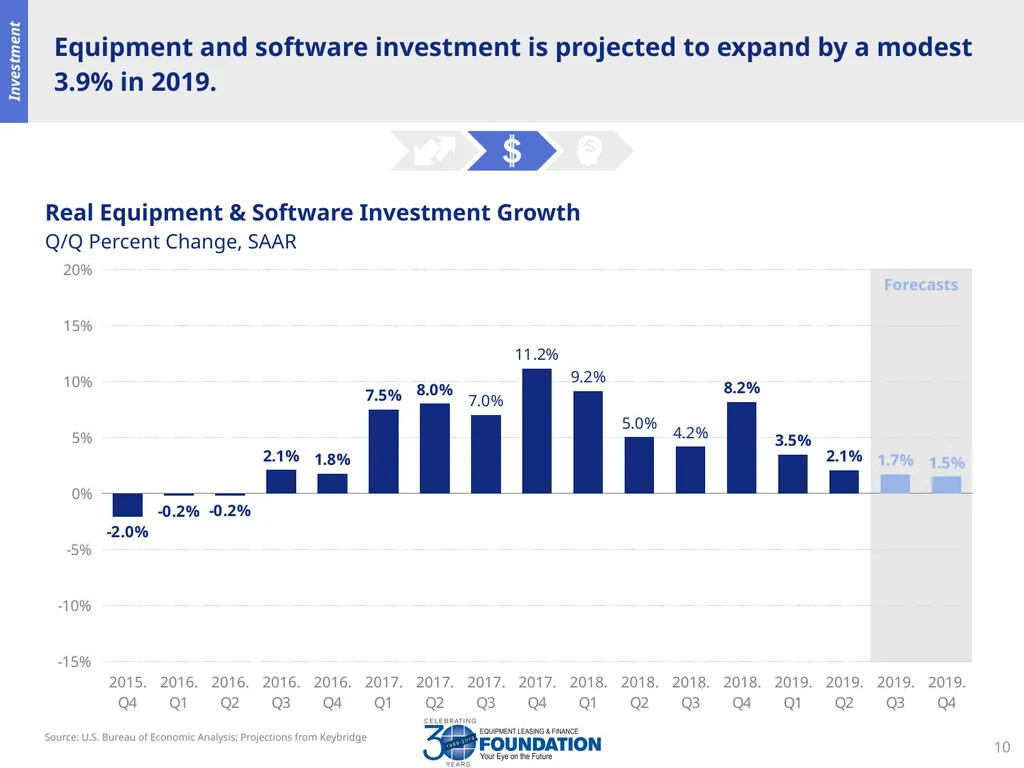
Equipment and software investment is projected to expand by a modest 3.9% in 2019. Forecasts Investment Source: U.S. Bureau of Economic Analysis; Projections from Keybridge 10<br>
11
New business volume growth in 2019 is on track to beat 2018 levels after recovering from a slow first half of the year. Bus. Health 11 *2019 data through August – projected through end of year using a simple year-to-date extrapolation.
Source: ELFA MLFI-25 Through August*, investment is up 3.4% relative to year-ago levels<br>
12
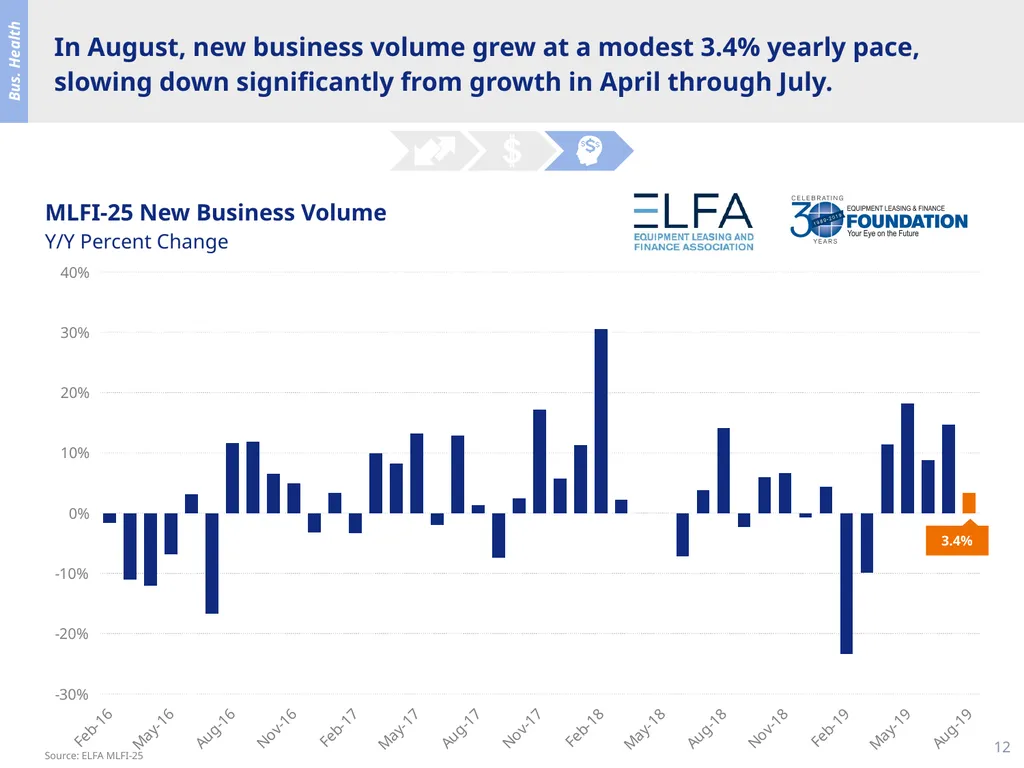
In August, new business volume grew at a modest 3.4% yearly pace, slowing down significantly from growth in April through July. 12 Bus. Health Source: ELFA MLFI-25 3.4%<br>
13
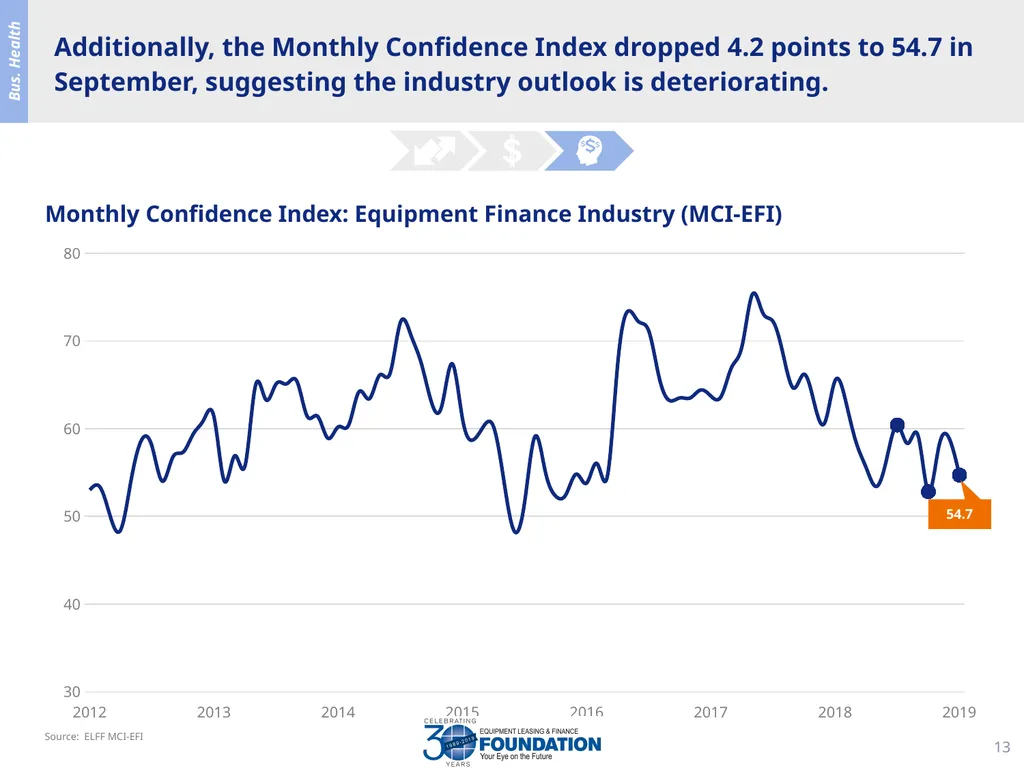
Additionally, the Monthly Confidence Index dropped 4.2 points to 54.7 in September, suggesting the industry outlook is deteriorating. 13 Monthly Confidence Index: Equipment Finance Industry (MCI-EFI) Source: ELFF MCI-EFI Bus. Health 54.7<br>
14
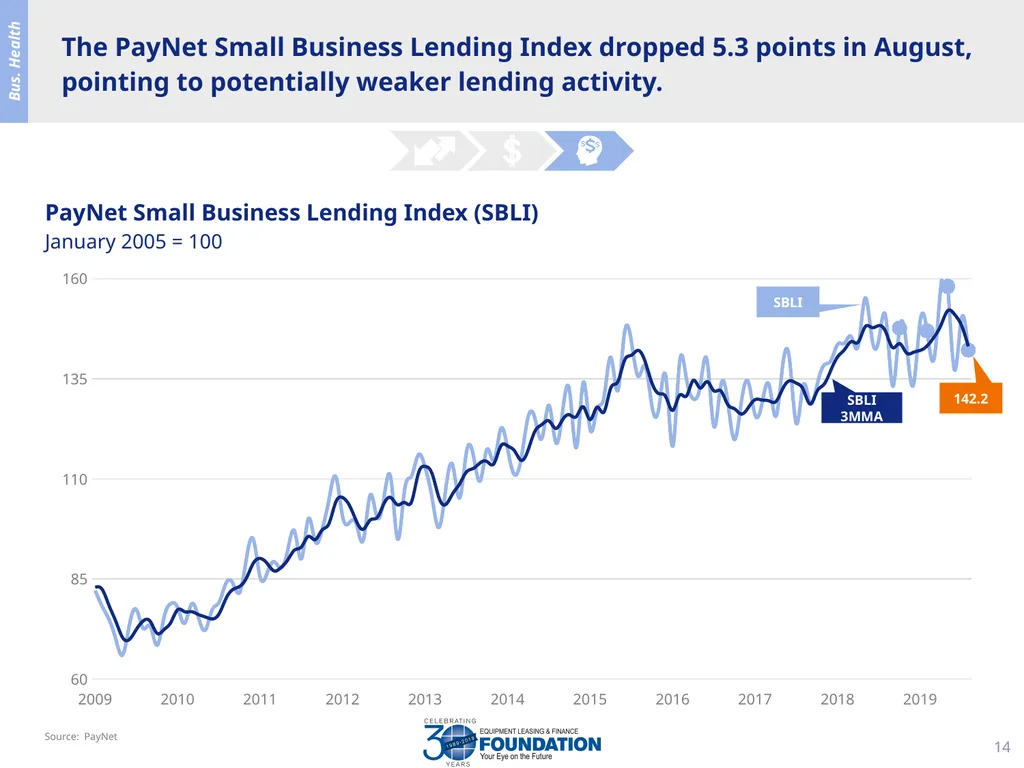
The PayNet Small Business Lending Index dropped 5.3 points in August, pointing to potentially weaker lending activity. Source: PayNet Bus. Health 14 142.2 SBLI SBLI 3MMA<br>
15
For more information on how you can use this information in your business, download the recently-updated Applied Economics Handbook. EQUIPMENT LEASING & FINANCE FOUNDATION Reports are available to download at www.store.leasefoundation.org 15<br>
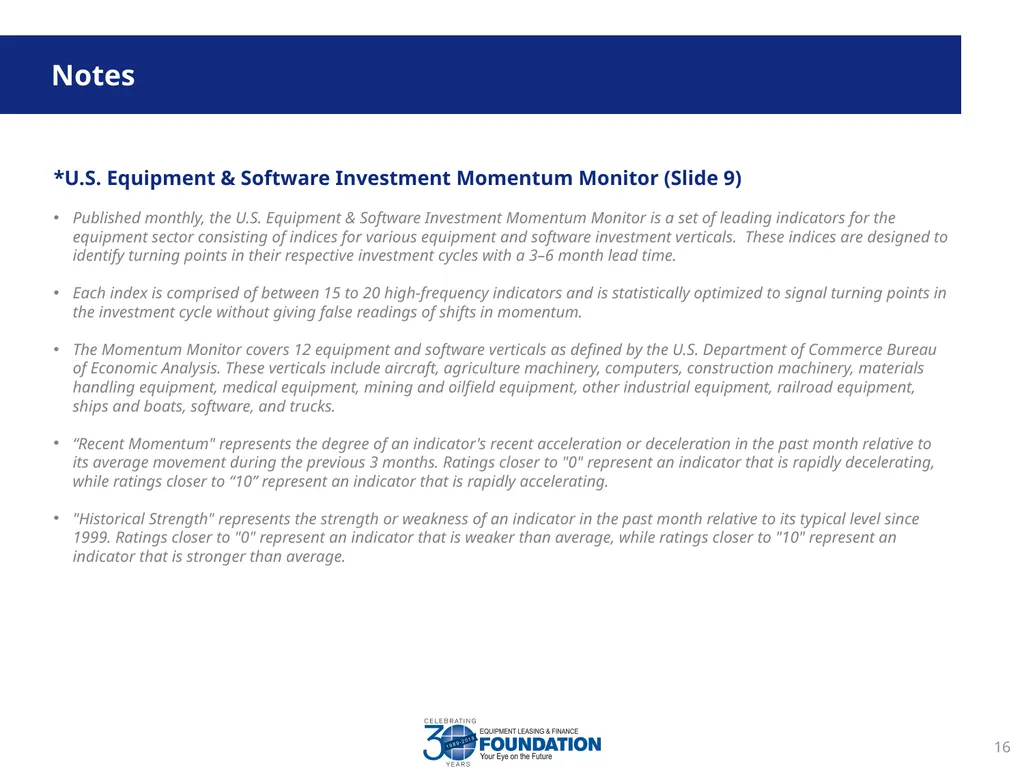
Published monthly, the U.S. Equipment & Software Investment Momentum Monitor is a set of leading indicators for the equipment sector consisting of indices for various equipment and software investment verticals. These indices are designed to identify turning points in their respective investment cycles with a 3–6 month lead time.
Each index is comprised of between 15 to 20 high-frequency indicators and is statistically optimized to signal turning points in the investment cycle without giving false readings of shifts in momentum.
The Momentum Monitor covers 12 equipment and software verticals as defined by the U.S. Department of Commerce Bureau of Economic Analysis. These verticals include aircraft, agriculture machinery, computers, construction machinery, materials handling equipment, medical equipment, mining and oilfield equipment, other industrial equipment, railroad equipment, ships and boats, software, and trucks.
“Recent Momentum" represents the degree of an indicator's recent acceleration or deceleration in the past month relative to its average movement during the previous 3 months. Ratings closer to "0" represent an indicator that is rapidly decelerating, while ratings closer to “10” represent an indicator that is rapidly accelerating.
"Historical Strength" represents the strength or weakness of an indicator in the past month relative to its typical level since 1999. Ratings closer to "0" represent an indicator that is weaker than average, while ratings closer to "10" represent an indicator that is stronger than average. 16<br>