IPSP Space Weather Socio-Economic Study L5 in Tandem with L1 : Future Space Weather Missions Workshop Monday 6th March 2017 Enrico Biffis Catherine Burnett Copyright 2017 1 Project Strategy Literature Review defined economic strategy
Related Topics
Share
Embed code
Download this presentation From Below
"IPSP Space Weather Socio-Economic Study L5 in" is the property of its rightful owner. Permission is granted to
download and print the materials on this website for personal, non-commercial use only, and to display it
on your personal computer provided you do not modify the materials and that you retain all copyright
notices contained in the materials. By downloading content from our website, you accept the terms of this
agreement.
Presentation Transcript
01
IPSP Space Weather
Socio-Economic Study L5 in Tandem with L1 : Future Space Weather Missions Workshop
Project Strategy Literature Review defined economic strategy
Space Weather Events -
Everyday or 1 in 10 year (2003 event)
1 in 30 year (1989 event)
1 in 100 year (Carrington scale event)
Forecast Capability -
None = loss of existing key L1 satellite observations
Current capability with existing key L1 satellite observations
Enhanced capability L1 and L5 satellite observations
Collate user and proxy data<br>
03
Forecast Scenario No forecast available - Existing satellite observing systems are lost orno t replaced
The current level of forecast – Based on data from multiple satellites
Deep Space Climate Observatory (DSCOVR)
Solar and Heliospheric Observatory(SOHO)
Advanced Composition Explorer (ACE)
Geostationary Operational Environmental Satellite (GOES)
Solar Dynamic Observatory (SDO)
Improved level of forecasting – Reflecting the standard that could be achieved if the current observation satellites were supplemented by satellites off the Sun Earth line, as demonstrated by the STEREO mission e.g. at the Lagrange 4 (L4)or Lagrange 5(L5) positions<br>
04
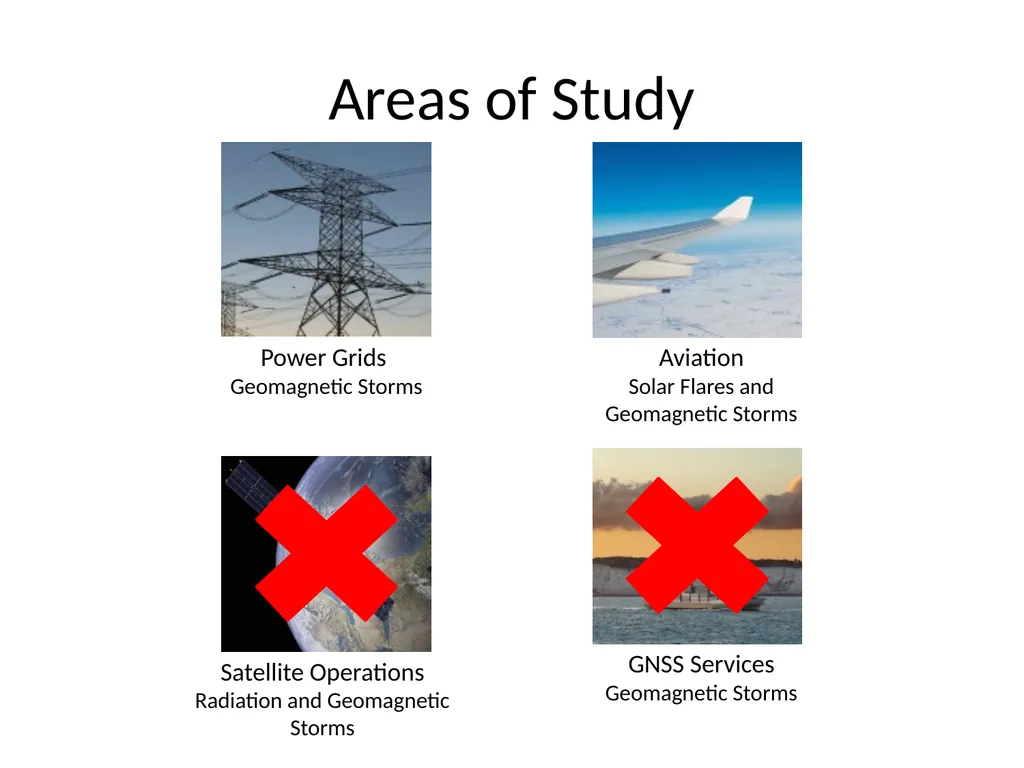
Areas of Study Power Grids
Geomagnetic Storms Aviation
Solar Flares and Geomagnetic Storms Satellite Operations
Radiation and Geomagnetic Storms GNSS Services
Geomagnetic Storms<br>
05
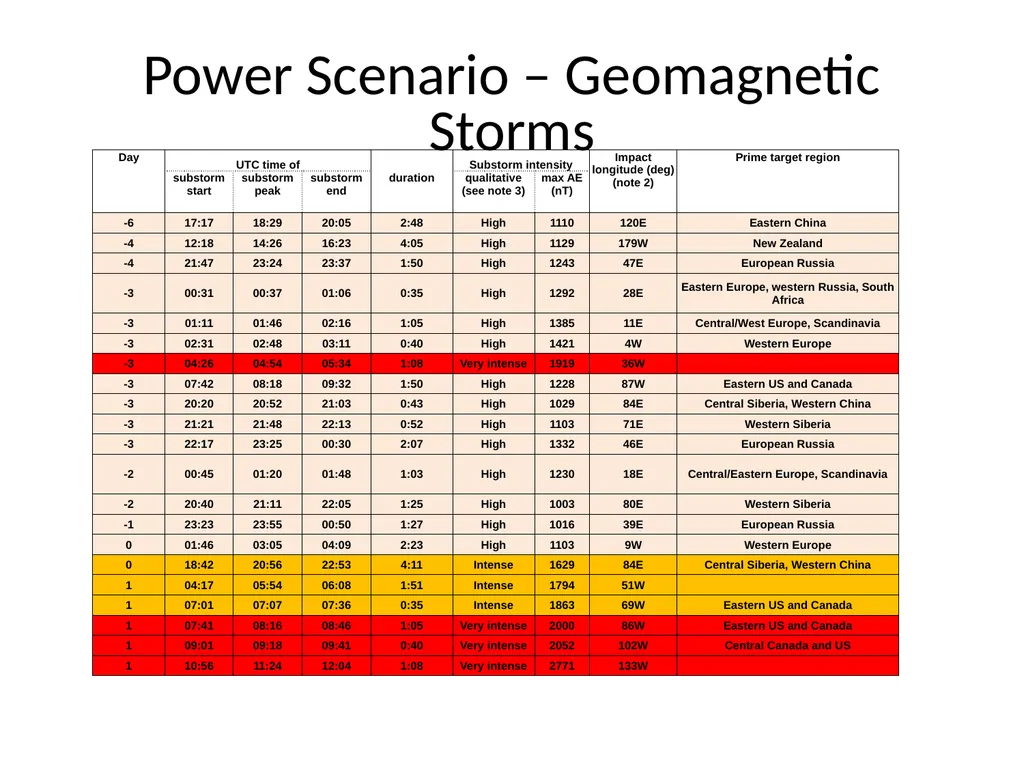
Power Scenario – Geomagnetic Storms<br>
06
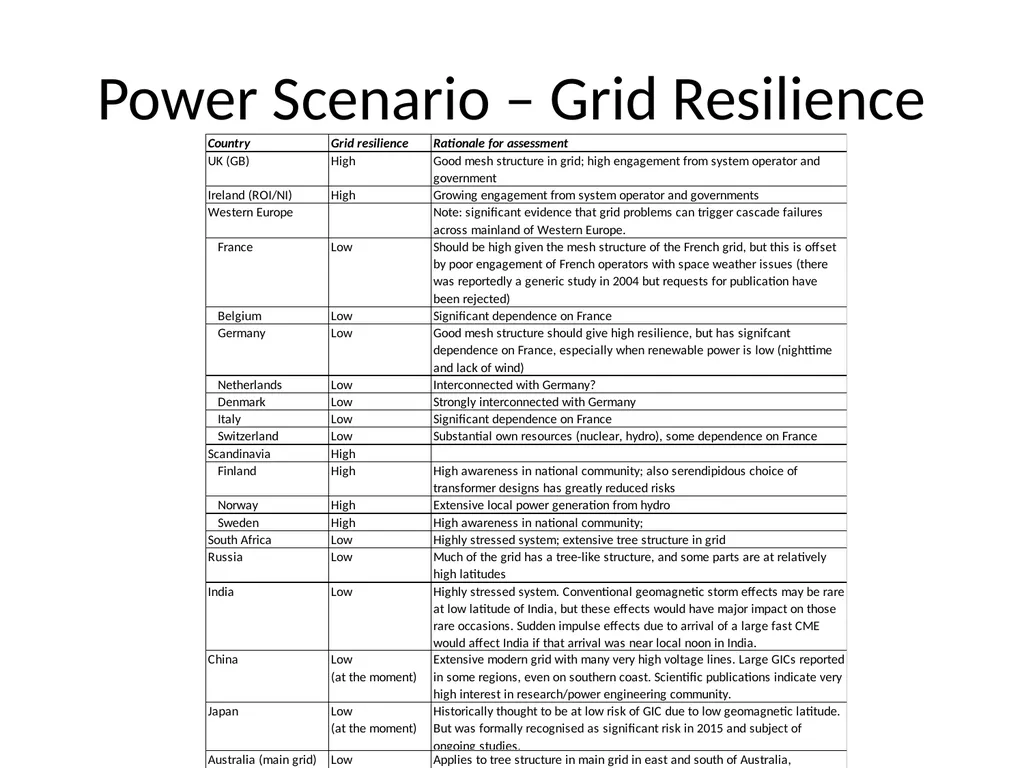
Power Scenario – Grid Resilience<br>
07
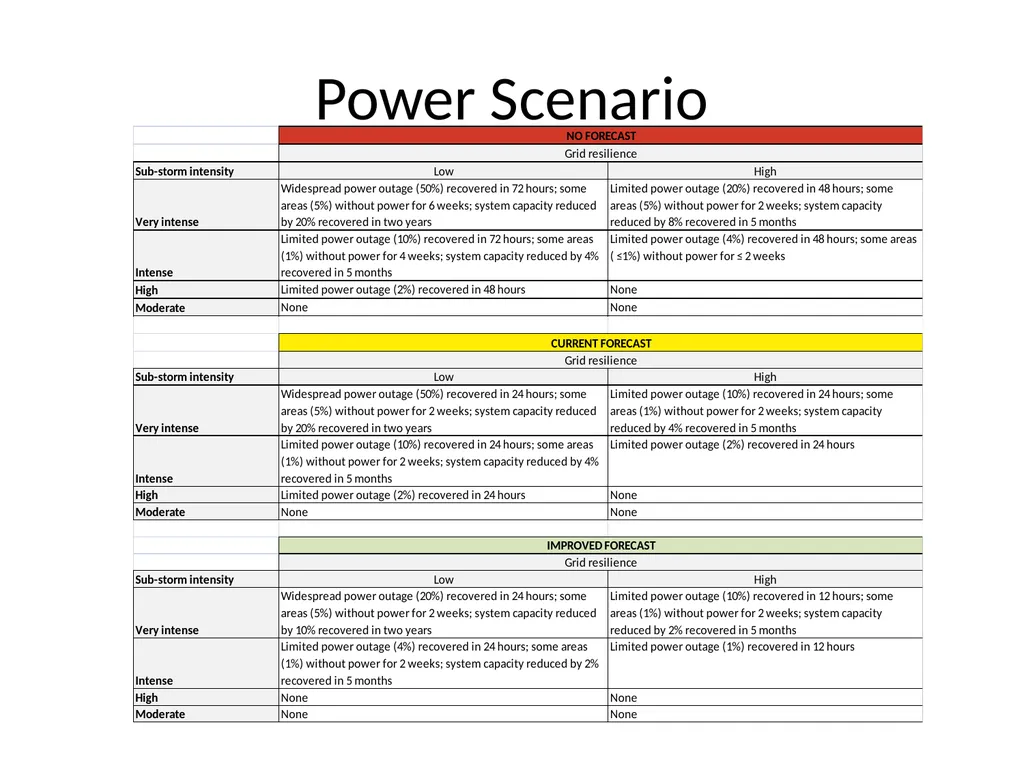
Power Scenario<br>
08
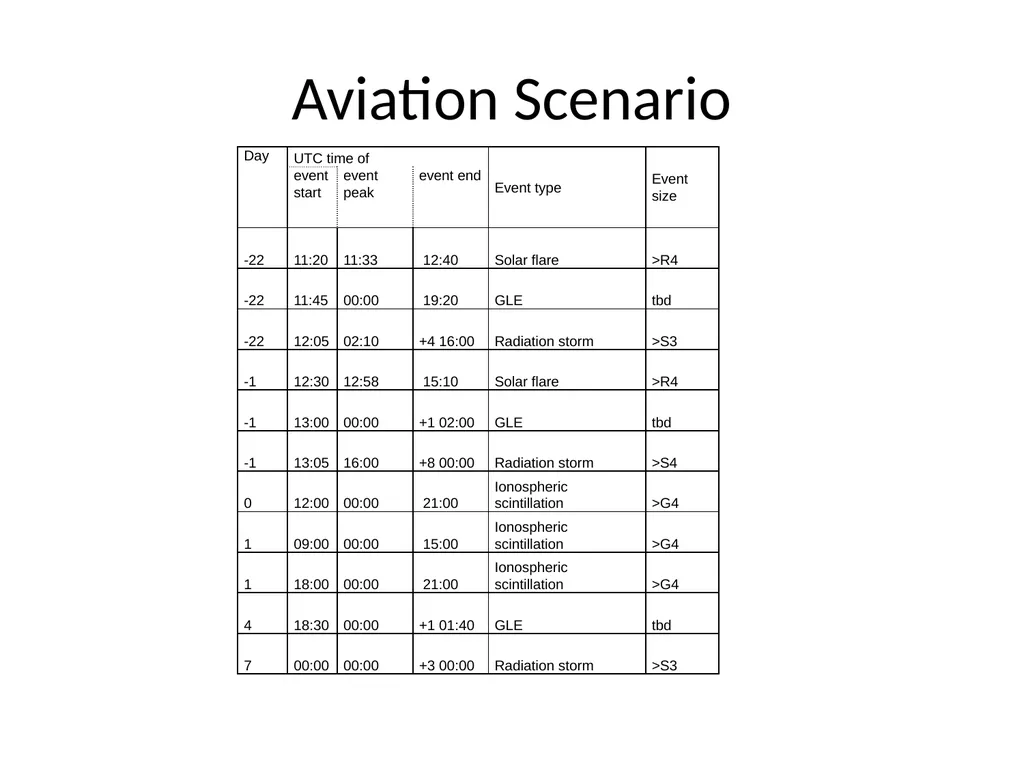
Aviation Scenario<br>
09
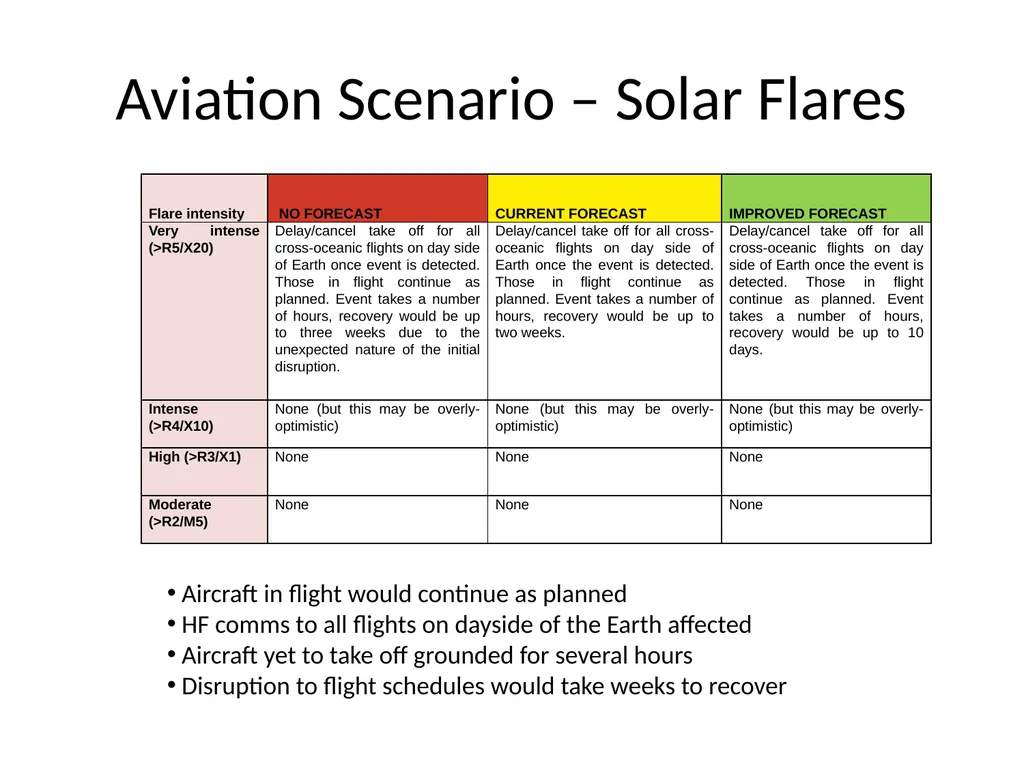
Aviation Scenario – Solar Flares Aircraft in flight would continue as planned
HF comms to all flights on dayside of the Earth affected
Aircraft yet to take off grounded for several hours
Disruption to flight schedules would take weeks to recover<br>
10
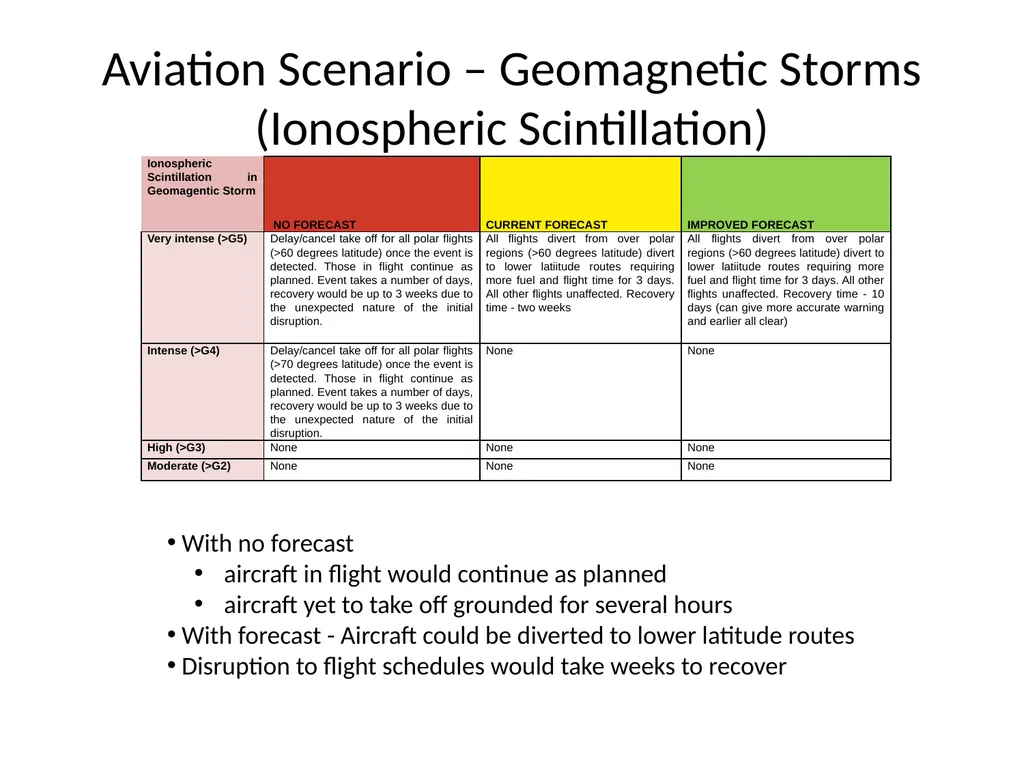
Aviation Scenario – Geomagnetic Storms (Ionospheric Scintillation) With no forecast
aircraft in flight would continue as planned
aircraft yet to take off grounded for several hours
With forecast - Aircraft could be diverted to lower latitude routes
Disruption to flight schedules would take weeks to recover<br>
11
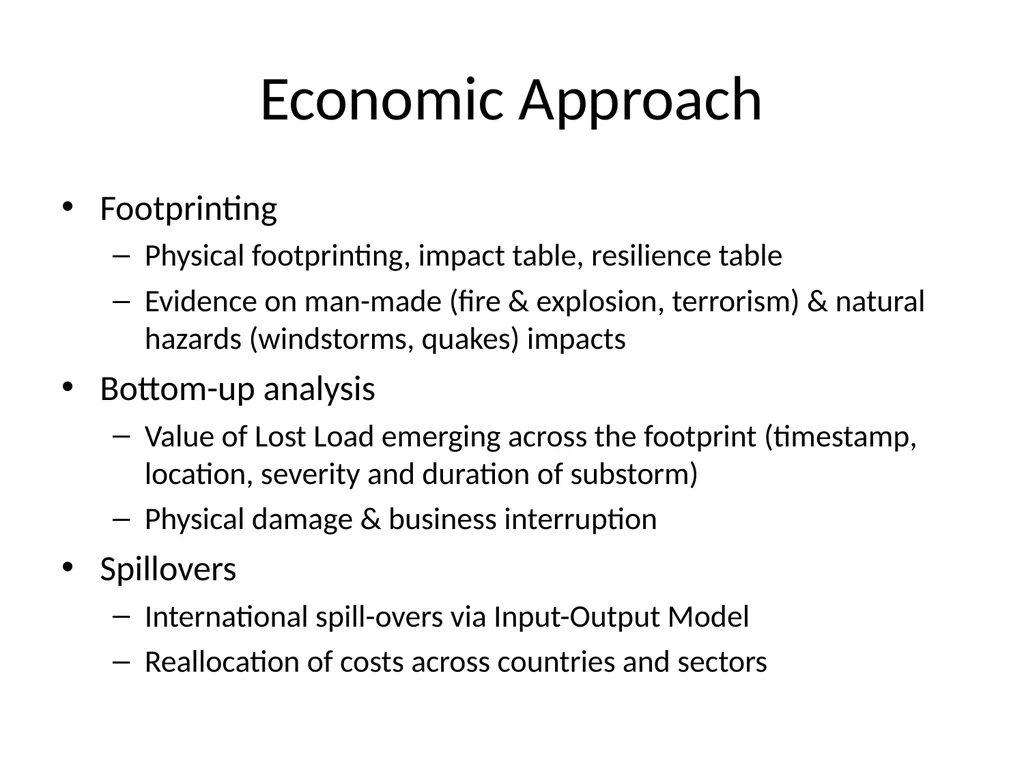
Economic Approach Footprinting
Physical footprinting, impact table, resilience table
Evidence on man-made (fire & explosion, terrorism) & natural hazards (windstorms, quakes) impacts
Bottom-up analysis
Value of Lost Load emerging across the footprint (timestamp, location, severity and duration of substorm)
Physical damage & business interruption
Spillovers
International spill-overs via Input-Output Model
Reallocation of costs across countries and sectors<br>
12
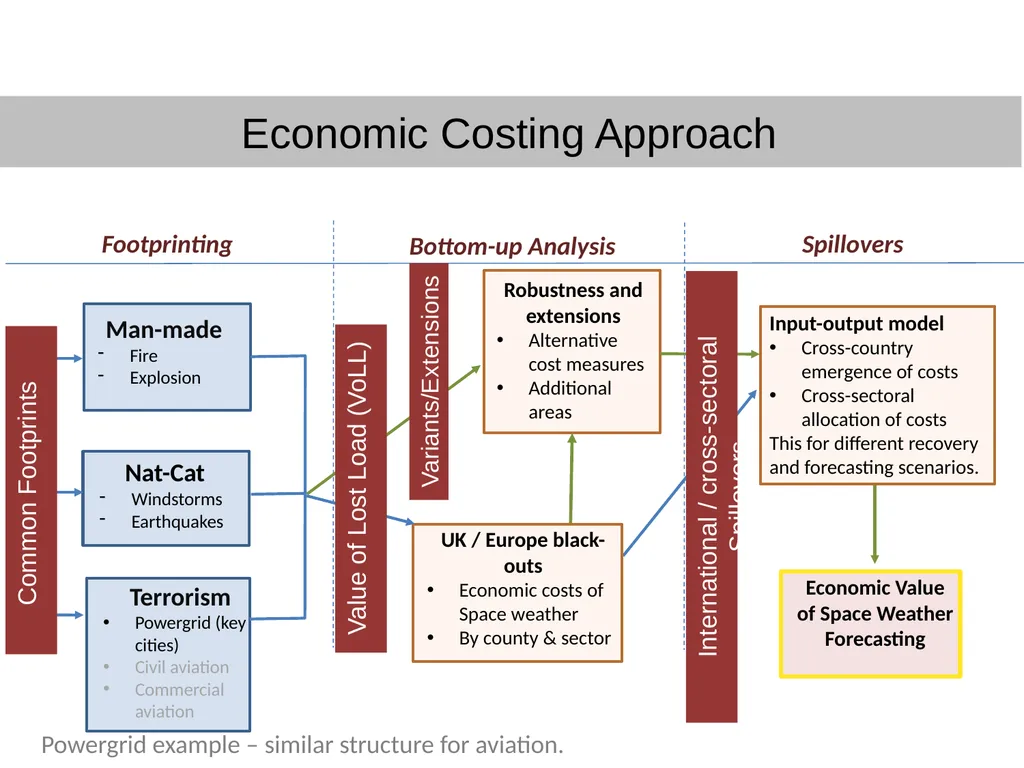
Value of Lost Load (VoLL) Bottom-up Analysis Variants/Extensions Spillovers International / cross-sectoral Spillovers Footprinting Economic Costing Approach Powergrid example – similar structure for aviation.<br>
13
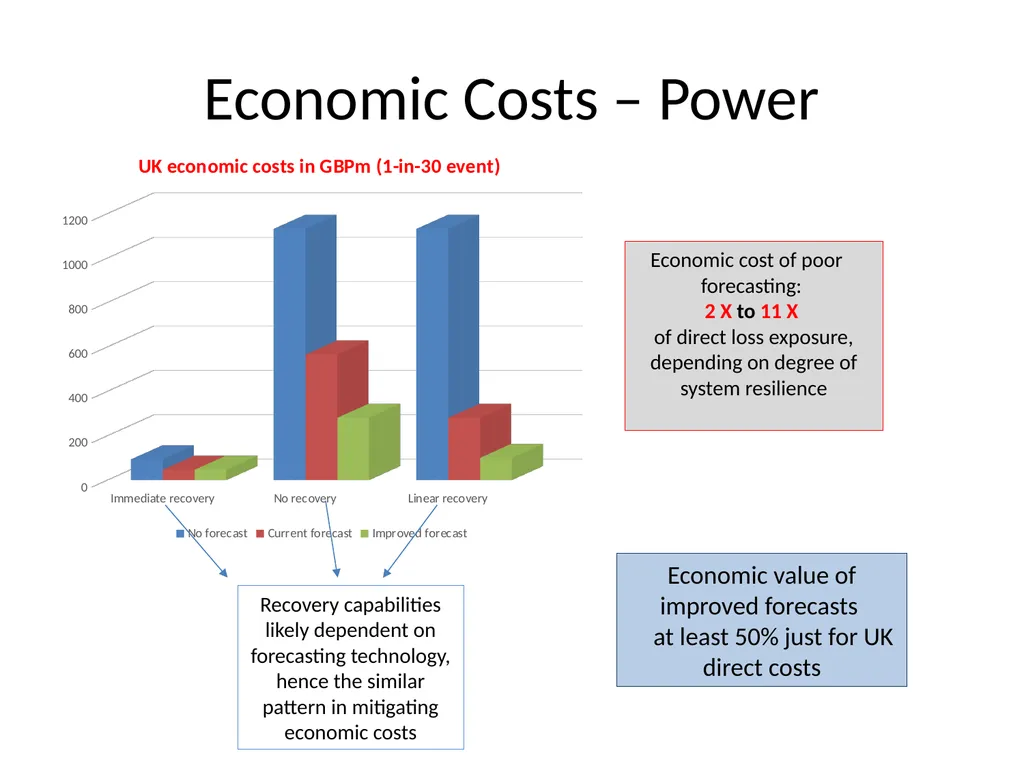
Economic Costs – Power Recovery capabilities likely dependent on forecasting technology, hence the similar pattern in mitigating economic costs Economic value of improved forecasts
at least 50% just for UK direct costs Economic cost of poor
forecasting:
2 X to 11 X
of direct loss exposure, depending on degree of system resilience<br>
14
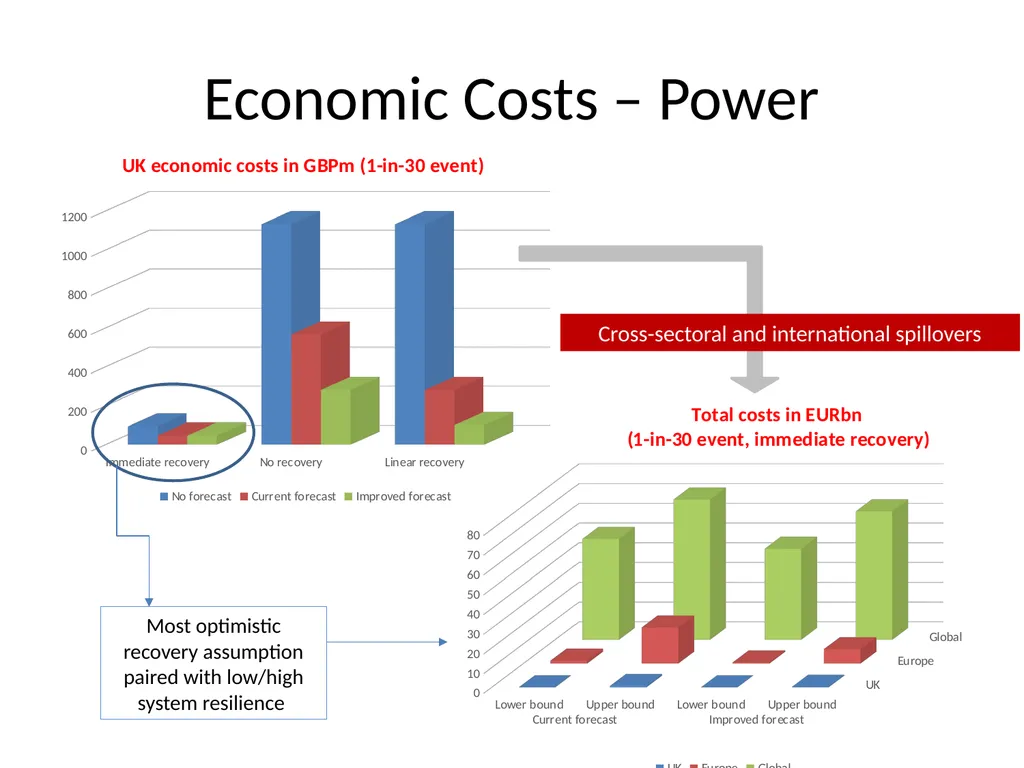
Economic Costs – Power Most optimistic recovery assumption paired with low/high system resilience Cross-sectoral and international spillovers<br>
15
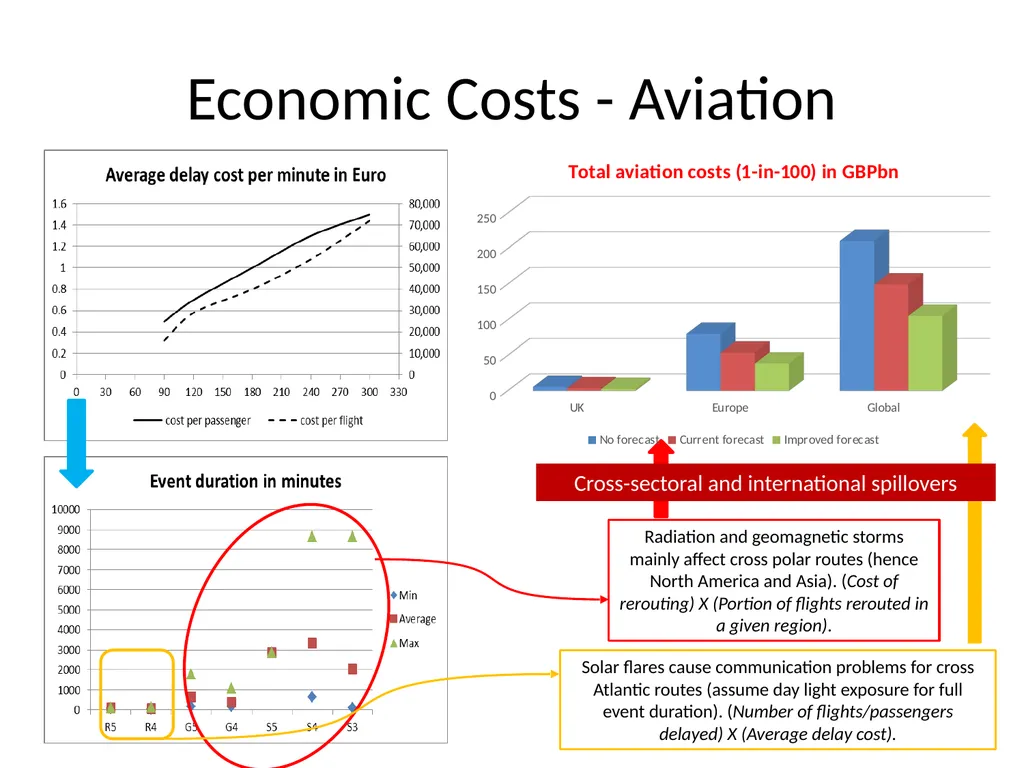
Economic Costs - Aviation Radiation and geomagnetic storms mainly affect cross polar routes (hence North America and Asia). (Cost of rerouting) X (Portion of flights rerouted in a given region). Solar flares cause communication problems for cross Atlantic routes (assume day light exposure for full event duration). (Number of flights/passengers delayed) X (Average delay cost). Cross-sectoral and international spillovers<br>
16
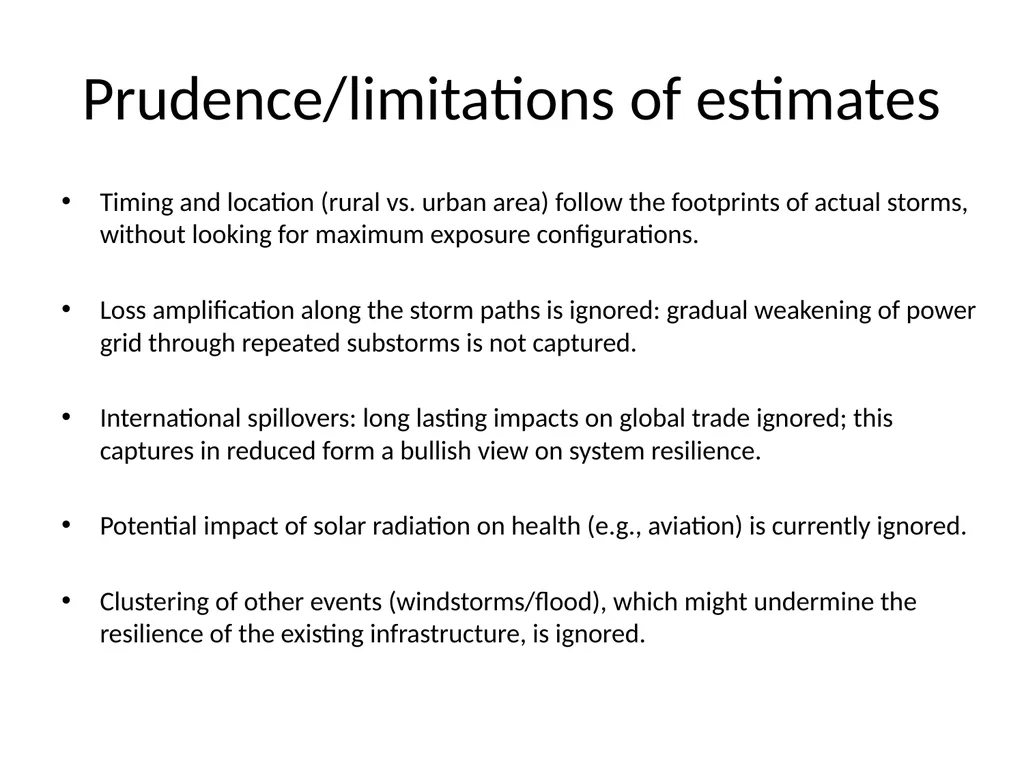
Prudence/limitations of estimates Timing and location (rural vs. urban area) follow the footprints of actual storms, without looking for maximum exposure configurations.
Loss amplification along the storm paths is ignored: gradual weakening of power grid through repeated substorms is not captured.
International spillovers: long lasting impacts on global trade ignored; this captures in reduced form a bullish view on system resilience.
Potential impact of solar radiation on health (e.g., aviation) is currently ignored.
Clustering of other events (windstorms/flood), which might undermine the resilience of the existing infrastructure, is ignored.<br>
17
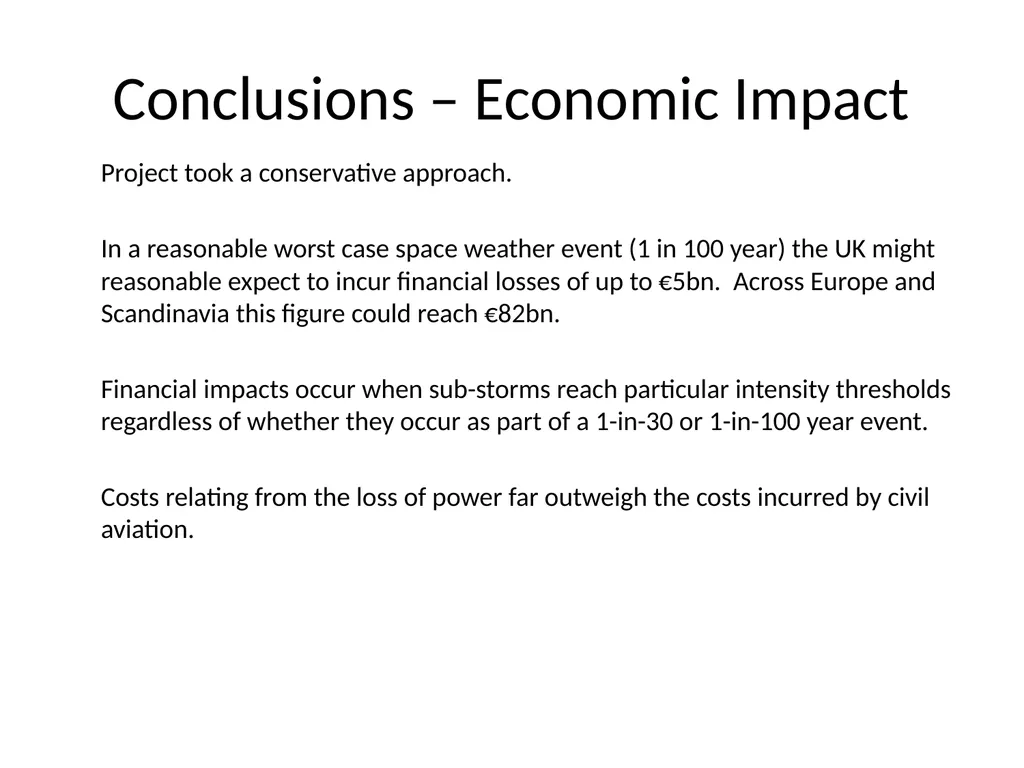
Conclusions – Economic Impact Project took a conservative approach.
In a reasonable worst case space weather event (1 in 100 year) the UK might reasonable expect to incur financial losses of up to €5bn. Across Europe and Scandinavia this figure could reach €82bn.
Financial impacts occur when sub-storms reach particular intensity thresholds regardless of whether they occur as part of a 1-in-30 or 1-in-100 year event.
Costs relating from the loss of power far outweigh the costs incurred by civil aviation.<br>
18
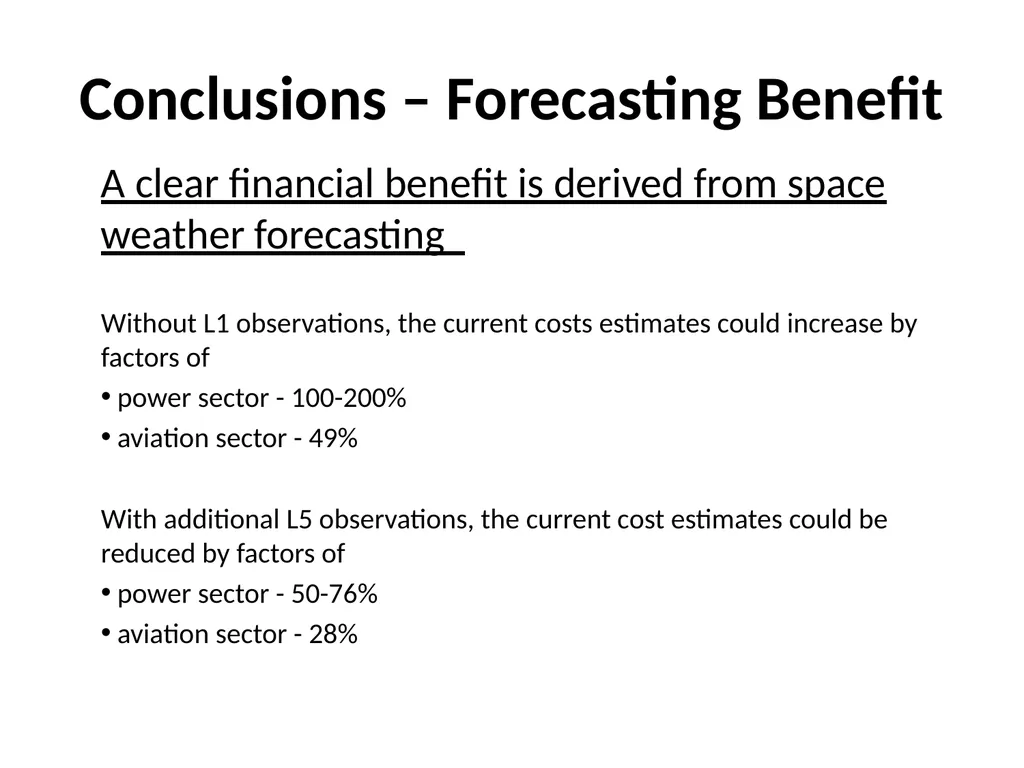
Conclusions – Forecasting Benefit A clear financial benefit is derived from space weather forecasting
Without L1 observations, the current costs estimates could increase by factors of
power sector - 100-200%
aviation sector - 49%
With additional L5 observations, the current cost estimates could be reduced by factors of
power sector - 50-76%
aviation sector - 28%<br>
19
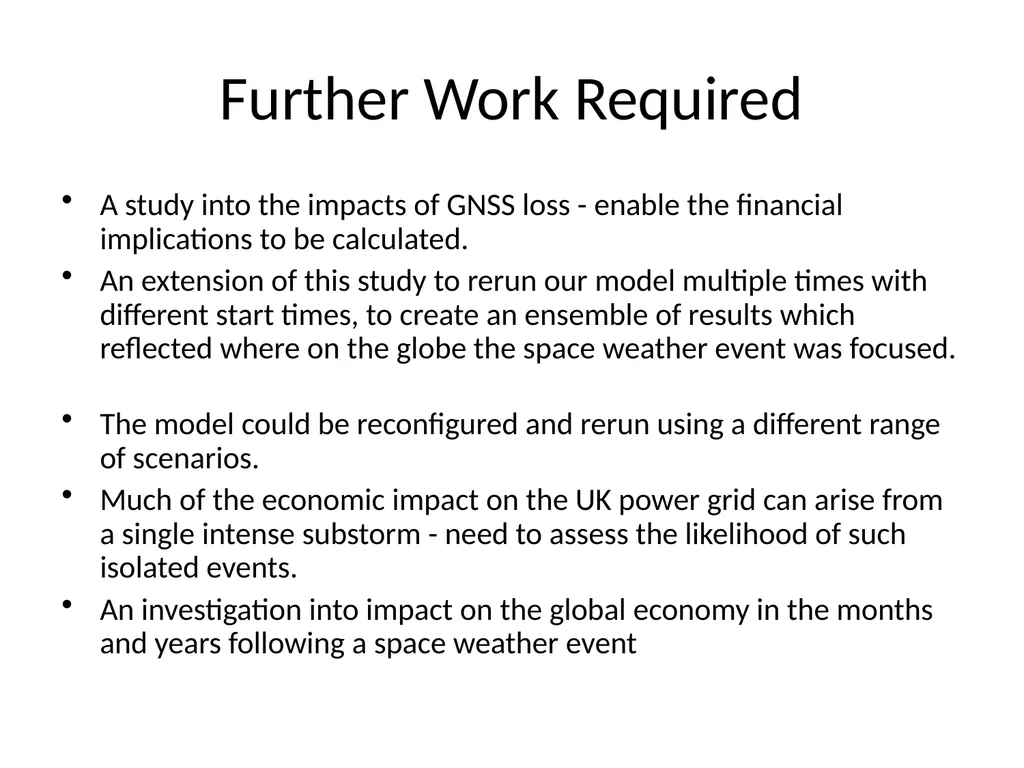
Further Work Required A study into the impacts of GNSS loss - enable the financial implications to be calculated.
An extension of this study to rerun our model multiple times with different start times, to create an ensemble of results which reflected where on the globe the space weather event was focused.
The model could be reconfigured and rerun using a different range of scenarios.
Much of the economic impact on the UK power grid can arise from a single intense substorm - need to assess the likelihood of such isolated events.
An investigation into impact on the global economy in the months and years following a space weather event<br>