
New Mexico educational retirement board december
GB
Published · 37 slides · 0 views

1 / 1









Description
New Mexico educational retirement board december 2022 Robert Goldthorpe, ASA, Investment Director Asset-Liability study NMERB remains in a poor funded position though steps have been made to improve going forward NEPC estimate of June 30,
Related Topics
Share
Embed code
Download this presentation From Below
"New Mexico educational retirement board december" is the property of its rightful owner. Permission is granted to download and print the materials on this website for personal, non-commercial use only, and to display it on your personal computer provided you do not modify the materials and that you retain all copyright notices contained in the materials. By downloading content from our website, you accept the terms of this agreement.
Presentation Transcript
01
New Mexico educational retirement board december 2022 Robert Goldthorpe, ASA, Investment Director Asset-Liability study<br>
02
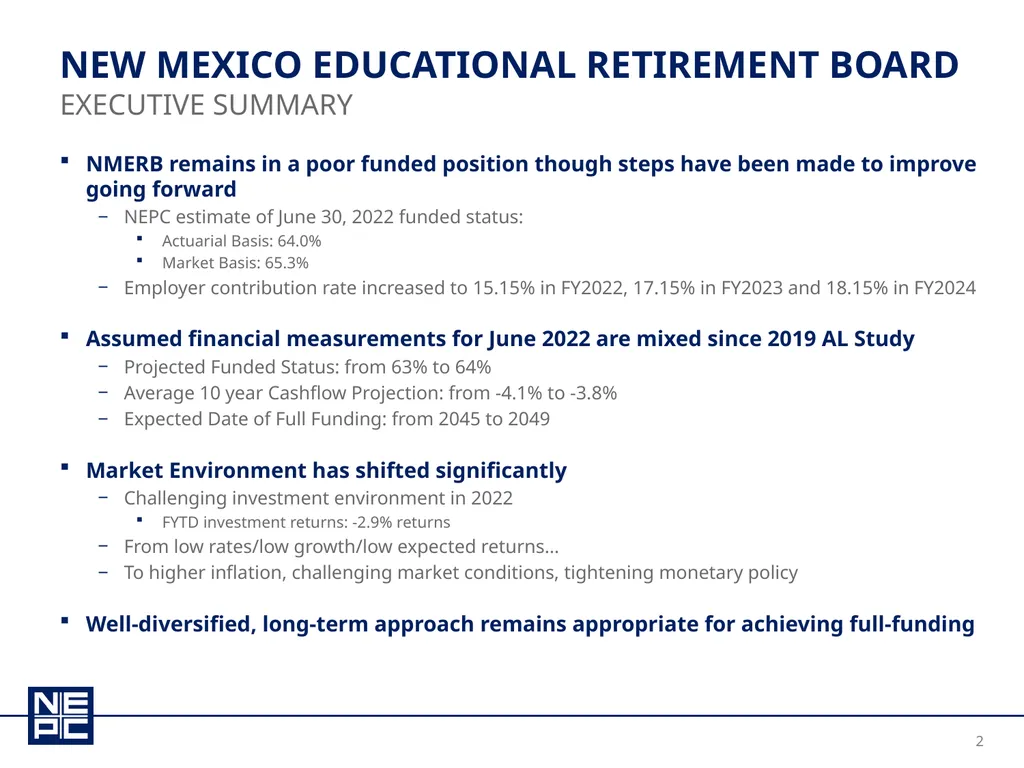
NMERB remains in a poor funded position though steps have been made to improve going forward
NEPC estimate of June 30, 2022 funded status:
Actuarial Basis: 64.0%
Market Basis: 65.3%
Employer contribution rate increased to 15.15% in FY2022, 17.15% in FY2023 and 18.15% in FY2024
Assumed financial measurements for June 2022 are mixed since 2019 AL Study
Projected Funded Status: from 63% to 64%
Average 10 year Cashflow Projection: from -4.1% to -3.8%
Expected Date of Full Funding: from 2045 to 2049
Market Environment has shifted significantly
Challenging investment environment in 2022
FYTD investment returns: -2.9% returns
From low rates/low growth/low expected returns…
To higher inflation, challenging market conditions, tightening monetary policy
Well-diversified, long-term approach remains appropriate for achieving full-funding New Mexico educational retirement board Executive summary<br>
NEPC estimate of June 30, 2022 funded status:
Actuarial Basis: 64.0%
Market Basis: 65.3%
Employer contribution rate increased to 15.15% in FY2022, 17.15% in FY2023 and 18.15% in FY2024
Assumed financial measurements for June 2022 are mixed since 2019 AL Study
Projected Funded Status: from 63% to 64%
Average 10 year Cashflow Projection: from -4.1% to -3.8%
Expected Date of Full Funding: from 2045 to 2049
Market Environment has shifted significantly
Challenging investment environment in 2022
FYTD investment returns: -2.9% returns
From low rates/low growth/low expected returns…
To higher inflation, challenging market conditions, tightening monetary policy
Well-diversified, long-term approach remains appropriate for achieving full-funding New Mexico educational retirement board Executive summary<br>
03
Purpose & Methodology of AL Study<br>
04
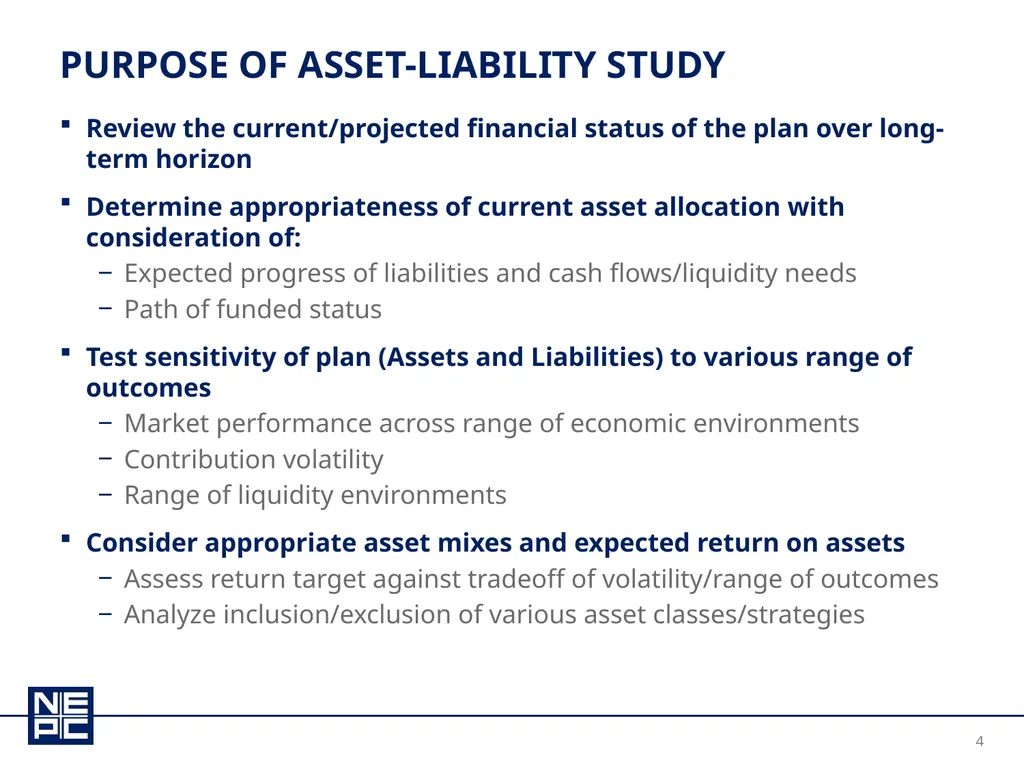
Review the current/projected financial status of the plan over long-term horizon
Determine appropriateness of current asset allocation with consideration of:
Expected progress of liabilities and cash flows/liquidity needs
Path of funded status
Test sensitivity of plan (Assets and Liabilities) to various range of outcomes
Market performance across range of economic environments
Contribution volatility
Range of liquidity environments
Consider appropriate asset mixes and expected return on assets
Assess return target against tradeoff of volatility/range of outcomes
Analyze inclusion/exclusion of various asset classes/strategies Purpose of Asset-Liability Study<br>
Determine appropriateness of current asset allocation with consideration of:
Expected progress of liabilities and cash flows/liquidity needs
Path of funded status
Test sensitivity of plan (Assets and Liabilities) to various range of outcomes
Market performance across range of economic environments
Contribution volatility
Range of liquidity environments
Consider appropriate asset mixes and expected return on assets
Assess return target against tradeoff of volatility/range of outcomes
Analyze inclusion/exclusion of various asset classes/strategies Purpose of Asset-Liability Study<br>
05
The funding of pension benefits is made possible through the combination of member and employer contributions and returns on investment
The long-term expected return on assets drives the selection of an appropriate interest rate for discounting public pension liabilities
Expected Return on Assets is based on assumptions – actual experience will likely depart from those assumptions
Long-term nature of pension obligations positions well-funded pension plans to take advantage of long-term investment opportunities
It is critical and healthy for pension trustees to regularly review fundamental characteristics of the pension plan:
Risk tolerance
Viability of long-term investment return
Risk is multi-dimensional and should be considered from different perspectives – Risk is not just volatility!
Volatility, Potential for drawdowns, Illiquidity, Exposure to economic factors, etc.
Return expectations are generally lower than historical returns, forcing many investors to reconsider both return expectations and appropriate levels of risk First Principles<br>
The long-term expected return on assets drives the selection of an appropriate interest rate for discounting public pension liabilities
Expected Return on Assets is based on assumptions – actual experience will likely depart from those assumptions
Long-term nature of pension obligations positions well-funded pension plans to take advantage of long-term investment opportunities
It is critical and healthy for pension trustees to regularly review fundamental characteristics of the pension plan:
Risk tolerance
Viability of long-term investment return
Risk is multi-dimensional and should be considered from different perspectives – Risk is not just volatility!
Volatility, Potential for drawdowns, Illiquidity, Exposure to economic factors, etc.
Return expectations are generally lower than historical returns, forcing many investors to reconsider both return expectations and appropriate levels of risk First Principles<br>
06
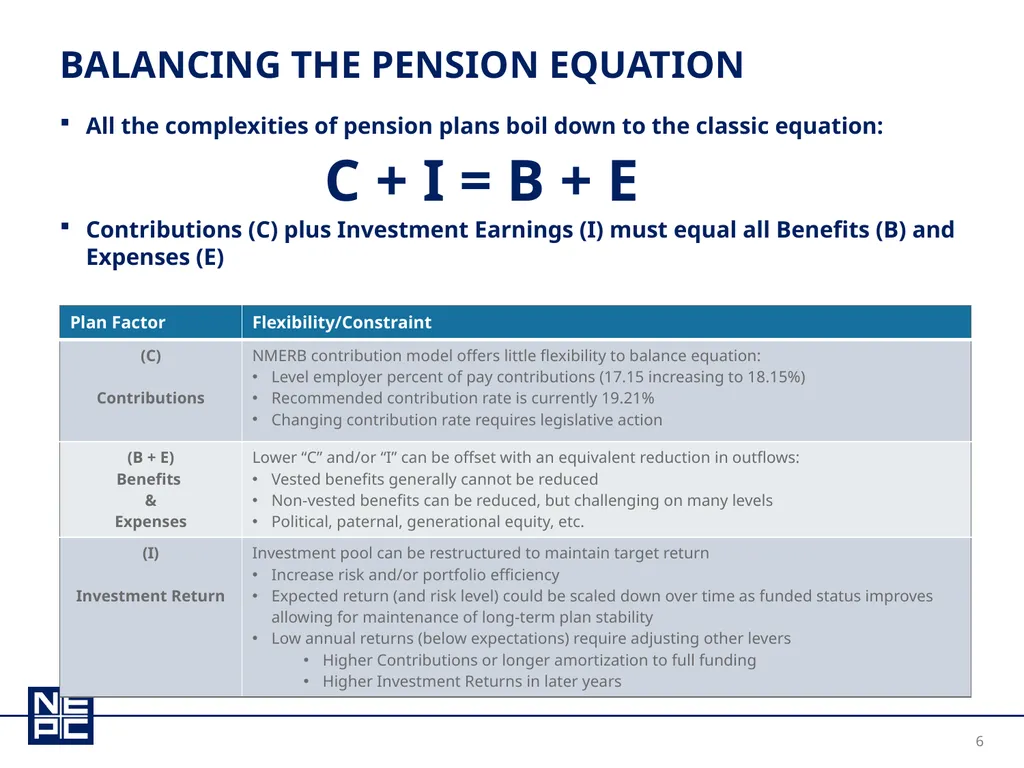
Balancing the Pension Equation All the complexities of pension plans boil down to the classic equation:
Contributions (C) plus Investment Earnings (I) must equal all Benefits (B) and Expenses (E) C + I = B + E<br>
Contributions (C) plus Investment Earnings (I) must equal all Benefits (B) and Expenses (E) C + I = B + E<br>
07
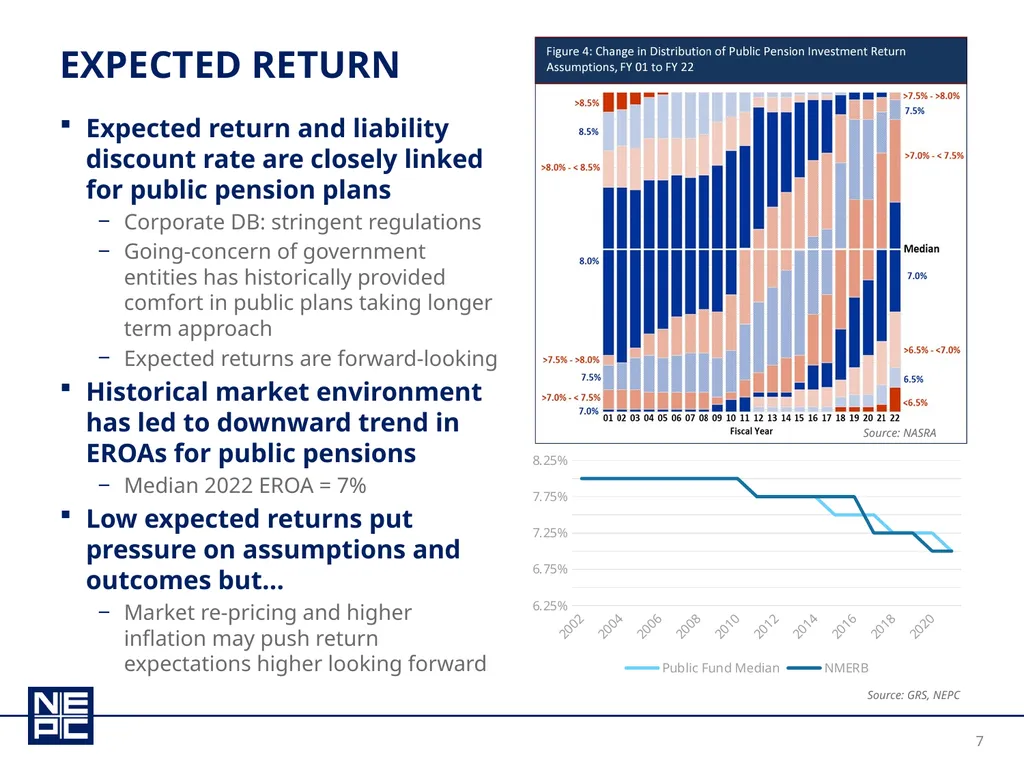
Expected Return Expected return and liability discount rate are closely linked for public pension plans
Corporate DB: stringent regulations
Going-concern of government entities has historically provided comfort in public plans taking longer term approach
Expected returns are forward-looking
Historical market environment has led to downward trend in EROAs for public pensions
Median 2022 EROA = 7%
Low expected returns put pressure on assumptions and outcomes but…
Market re-pricing and higher inflation may push return expectations higher looking forward Source: NASRA Source: GRS, NEPC<br>
Corporate DB: stringent regulations
Going-concern of government entities has historically provided comfort in public plans taking longer term approach
Expected returns are forward-looking
Historical market environment has led to downward trend in EROAs for public pensions
Median 2022 EROA = 7%
Low expected returns put pressure on assumptions and outcomes but…
Market re-pricing and higher inflation may push return expectations higher looking forward Source: NASRA Source: GRS, NEPC<br>
08
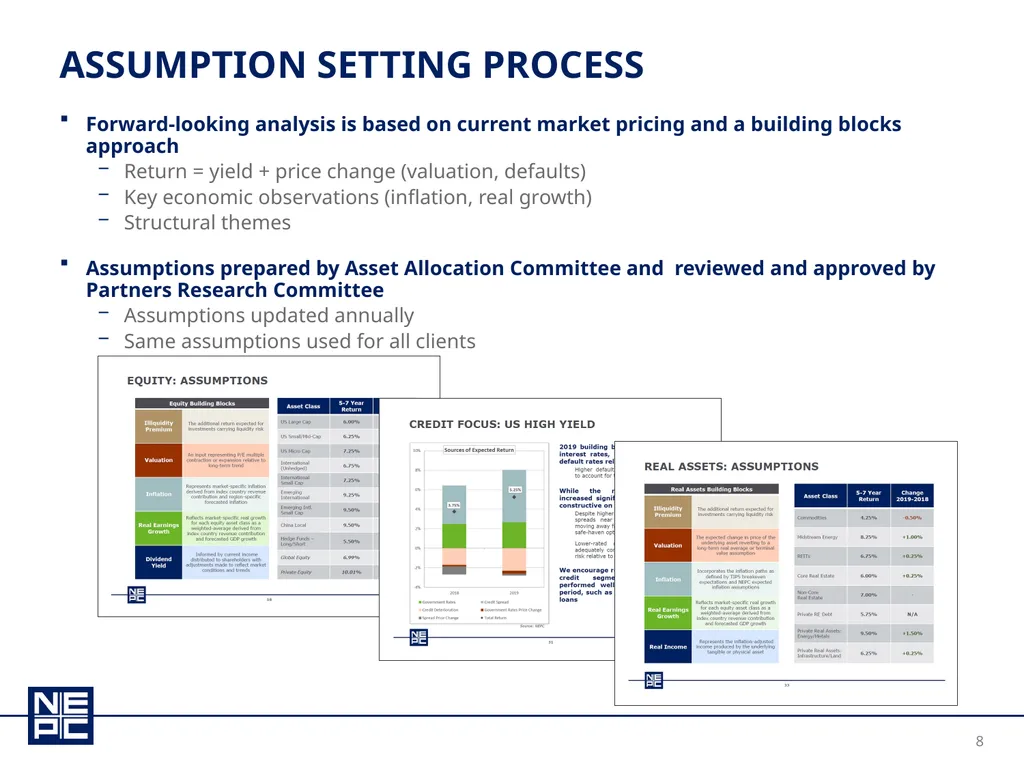
Assumption Setting Process Forward-looking analysis is based on current market pricing and a building blocks approach
Return = yield + price change (valuation, defaults)
Key economic observations (inflation, real growth)
Structural themes
Assumptions prepared by Asset Allocation Committee and reviewed and approved by Partners Research Committee
Assumptions updated annually
Same assumptions used for all clients<br>
Return = yield + price change (valuation, defaults)
Key economic observations (inflation, real growth)
Structural themes
Assumptions prepared by Asset Allocation Committee and reviewed and approved by Partners Research Committee
Assumptions updated annually
Same assumptions used for all clients<br>
09
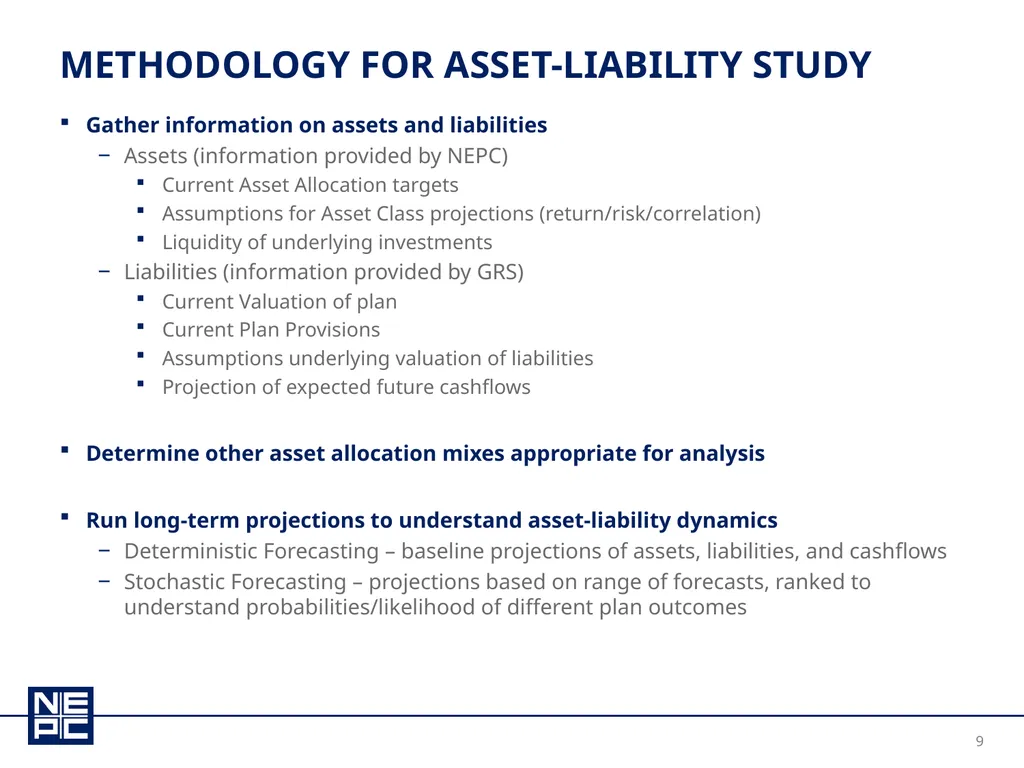
Gather information on assets and liabilities
Assets (information provided by NEPC)
Current Asset Allocation targets
Assumptions for Asset Class projections (return/risk/correlation)
Liquidity of underlying investments
Liabilities (information provided by GRS)
Current Valuation of plan
Current Plan Provisions
Assumptions underlying valuation of liabilities
Projection of expected future cashflows
Determine other asset allocation mixes appropriate for analysis
Run long-term projections to understand asset-liability dynamics
Deterministic Forecasting – baseline projections of assets, liabilities, and cashflows
Stochastic Forecasting – projections based on range of forecasts, ranked to understand probabilities/likelihood of different plan outcomes Methodology for Asset-Liability Study<br>
Assets (information provided by NEPC)
Current Asset Allocation targets
Assumptions for Asset Class projections (return/risk/correlation)
Liquidity of underlying investments
Liabilities (information provided by GRS)
Current Valuation of plan
Current Plan Provisions
Assumptions underlying valuation of liabilities
Projection of expected future cashflows
Determine other asset allocation mixes appropriate for analysis
Run long-term projections to understand asset-liability dynamics
Deterministic Forecasting – baseline projections of assets, liabilities, and cashflows
Stochastic Forecasting – projections based on range of forecasts, ranked to understand probabilities/likelihood of different plan outcomes Methodology for Asset-Liability Study<br>
10
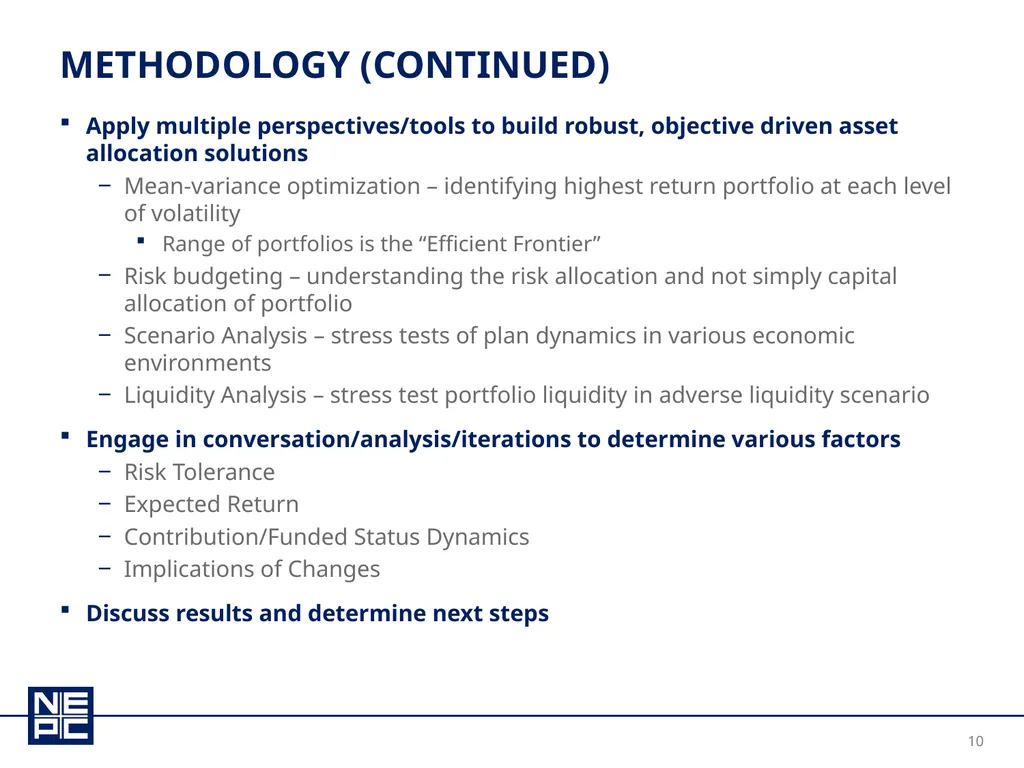
Apply multiple perspectives/tools to build robust, objective driven asset allocation solutions
Mean-variance optimization – identifying highest return portfolio at each level of volatility
Range of portfolios is the “Efficient Frontier”
Risk budgeting – understanding the risk allocation and not simply capital allocation of portfolio
Scenario Analysis – stress tests of plan dynamics in various economic environments
Liquidity Analysis – stress test portfolio liquidity in adverse liquidity scenario
Engage in conversation/analysis/iterations to determine various factors
Risk Tolerance
Expected Return
Contribution/Funded Status Dynamics
Implications of Changes
Discuss results and determine next steps Methodology (continued)<br>
Mean-variance optimization – identifying highest return portfolio at each level of volatility
Range of portfolios is the “Efficient Frontier”
Risk budgeting – understanding the risk allocation and not simply capital allocation of portfolio
Scenario Analysis – stress tests of plan dynamics in various economic environments
Liquidity Analysis – stress test portfolio liquidity in adverse liquidity scenario
Engage in conversation/analysis/iterations to determine various factors
Risk Tolerance
Expected Return
Contribution/Funded Status Dynamics
Implications of Changes
Discuss results and determine next steps Methodology (continued)<br>
11
Background<br>
12
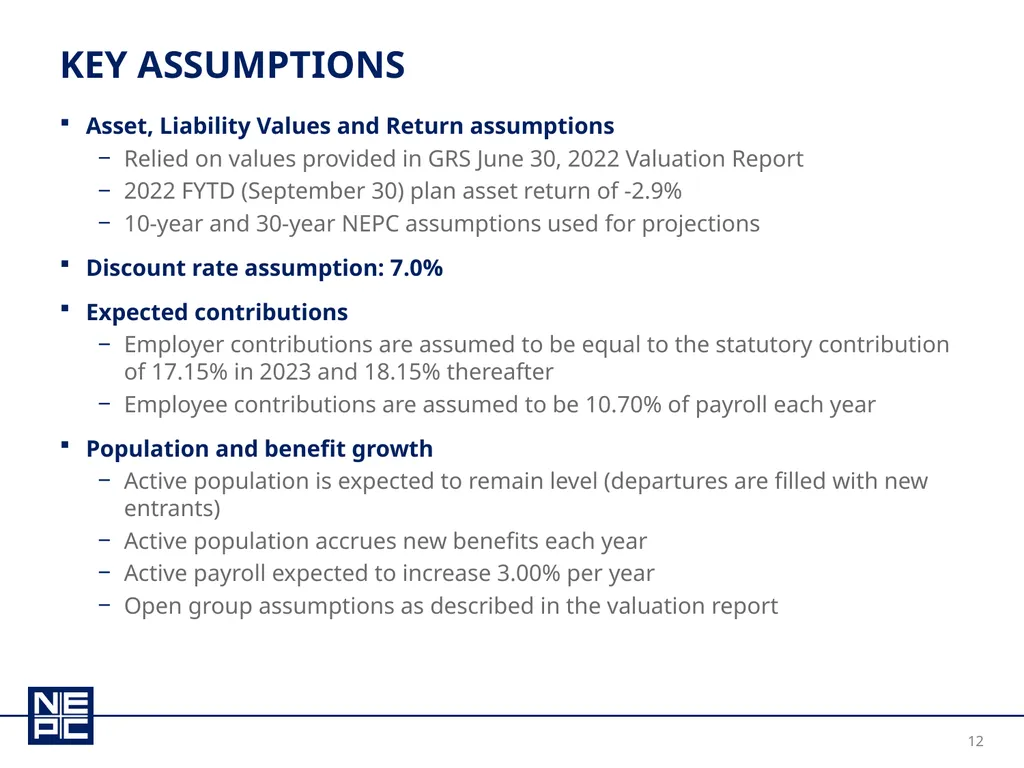
Asset, Liability Values and Return assumptions
Relied on values provided in GRS June 30, 2022 Valuation Report
2022 FYTD (September 30) plan asset return of -2.9%
10-year and 30-year NEPC assumptions used for projections
Discount rate assumption: 7.0%
Expected contributions
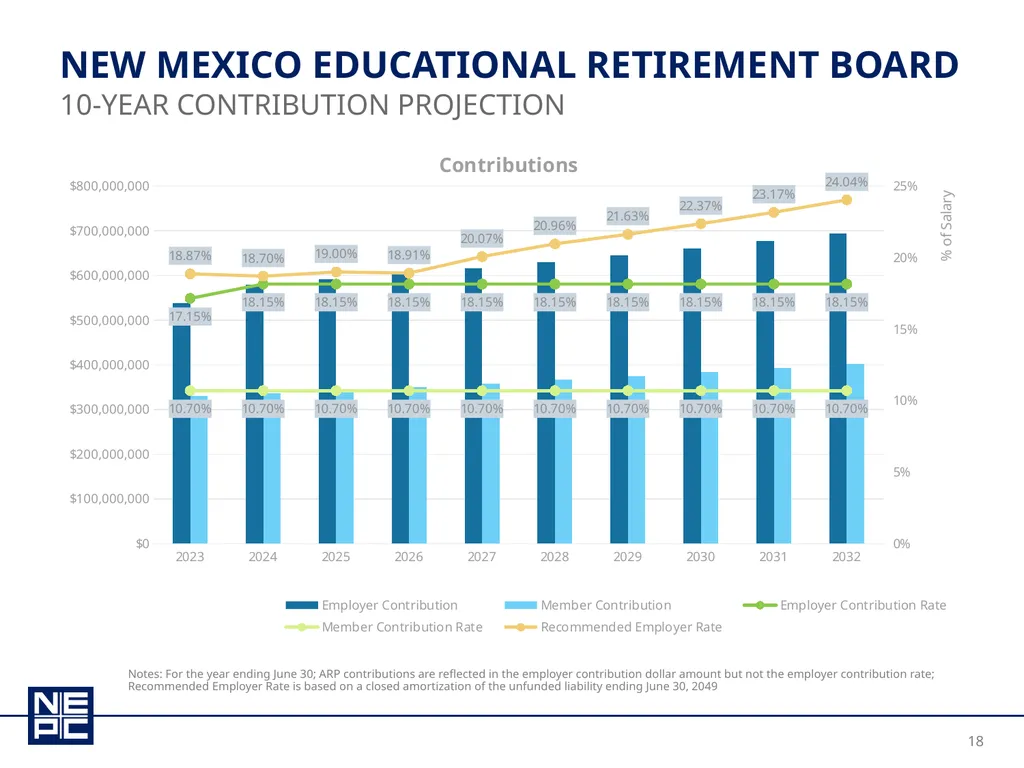
Employer contributions are assumed to be equal to the statutory contribution of 17.15% in 2023 and 18.15% thereafter
Employee contributions are assumed to be 10.70% of payroll each year
Population and benefit growth
Active population is expected to remain level (departures are filled with new entrants)
Active population accrues new benefits each year
Active payroll expected to increase 3.00% per year
Open group assumptions as described in the valuation report Key Assumptions<br>
Relied on values provided in GRS June 30, 2022 Valuation Report
2022 FYTD (September 30) plan asset return of -2.9%
10-year and 30-year NEPC assumptions used for projections
Discount rate assumption: 7.0%
Expected contributions
Employer contributions are assumed to be equal to the statutory contribution of 17.15% in 2023 and 18.15% thereafter
Employee contributions are assumed to be 10.70% of payroll each year
Population and benefit growth
Active population is expected to remain level (departures are filled with new entrants)
Active population accrues new benefits each year
Active payroll expected to increase 3.00% per year
Open group assumptions as described in the valuation report Key Assumptions<br>
13
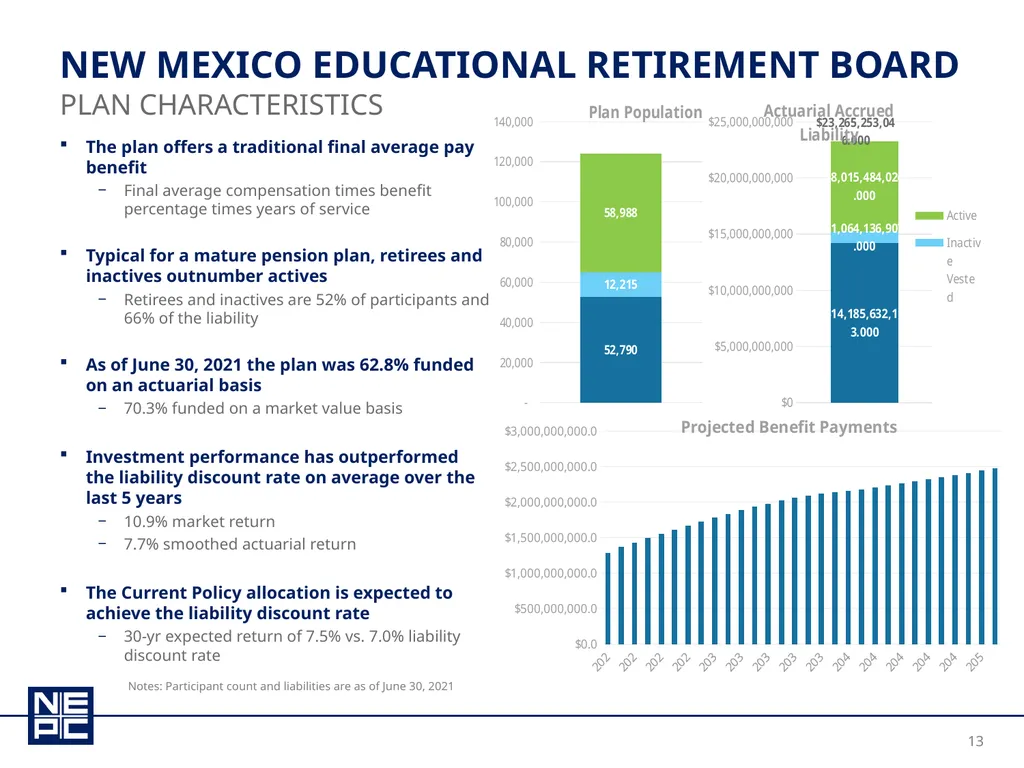
New Mexico educational retirement board The plan offers a traditional final average pay benefit
Final average compensation times benefit percentage times years of service
Typical for a mature pension plan, retirees and inactives outnumber actives
Retirees and inactives are 52% of participants and 66% of the liability
As of June 30, 2021 the plan was 62.8% funded on an actuarial basis
70.3% funded on a market value basis
Investment performance has outperformed the liability discount rate on average over the last 5 years
10.9% market return
7.7% smoothed actuarial return
The Current Policy allocation is expected to achieve the liability discount rate
30-yr expected return of 7.5% vs. 7.0% liability discount rate Plan characteristics Notes: Participant count and liabilities are as of June 30, 2021<br>
Final average compensation times benefit percentage times years of service
Typical for a mature pension plan, retirees and inactives outnumber actives
Retirees and inactives are 52% of participants and 66% of the liability
As of June 30, 2021 the plan was 62.8% funded on an actuarial basis
70.3% funded on a market value basis
Investment performance has outperformed the liability discount rate on average over the last 5 years
10.9% market return
7.7% smoothed actuarial return
The Current Policy allocation is expected to achieve the liability discount rate
30-yr expected return of 7.5% vs. 7.0% liability discount rate Plan characteristics Notes: Participant count and liabilities are as of June 30, 2021<br>
14
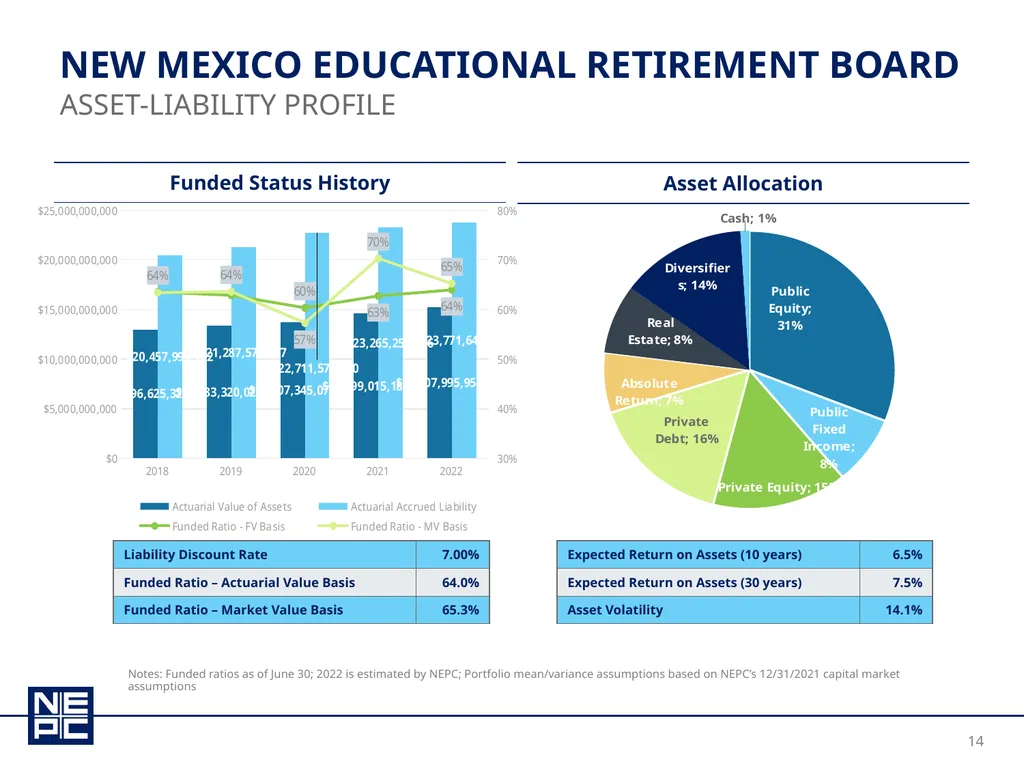
New Mexico educational retirement board Asset-Liability profile Notes: Funded ratios as of June 30; 2022 is estimated by NEPC; Portfolio mean/variance assumptions based on NEPC’s 12/31/2021 capital market assumptions<br>
15
ALM study oVerview<br>
16
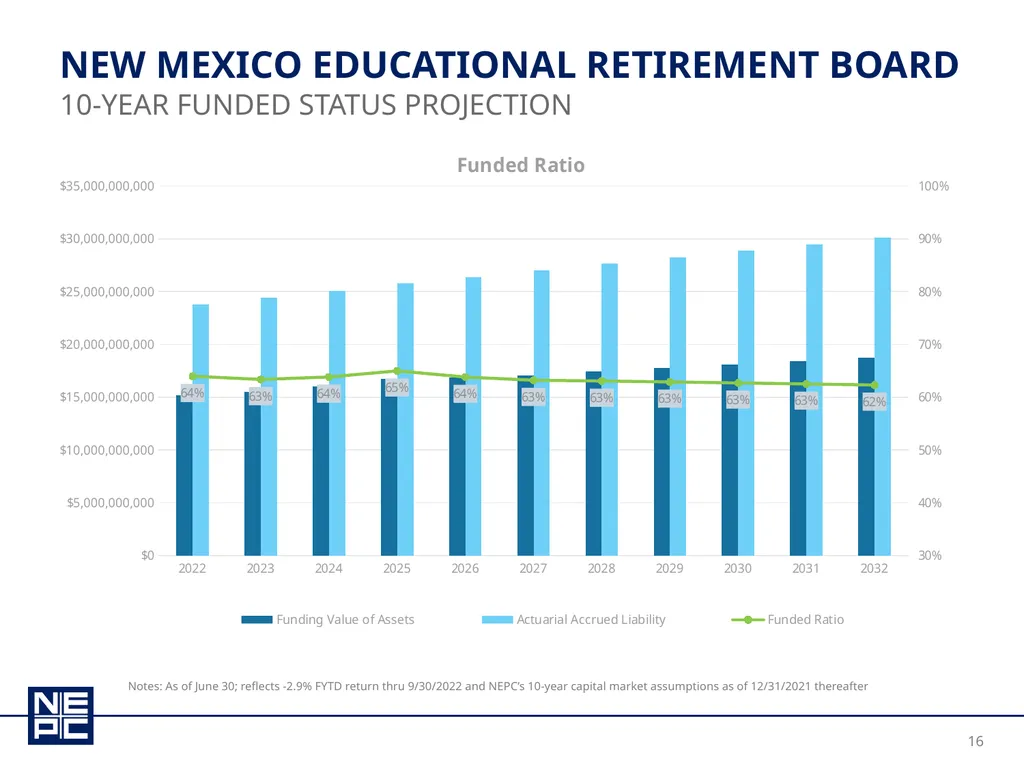
New Mexico educational retirement board 10-year funded status projection Notes: As of June 30; reflects -2.9% FYTD return thru 9/30/2022 and NEPC’s 10-year capital market assumptions as of 12/31/2021 thereafter<br>
17
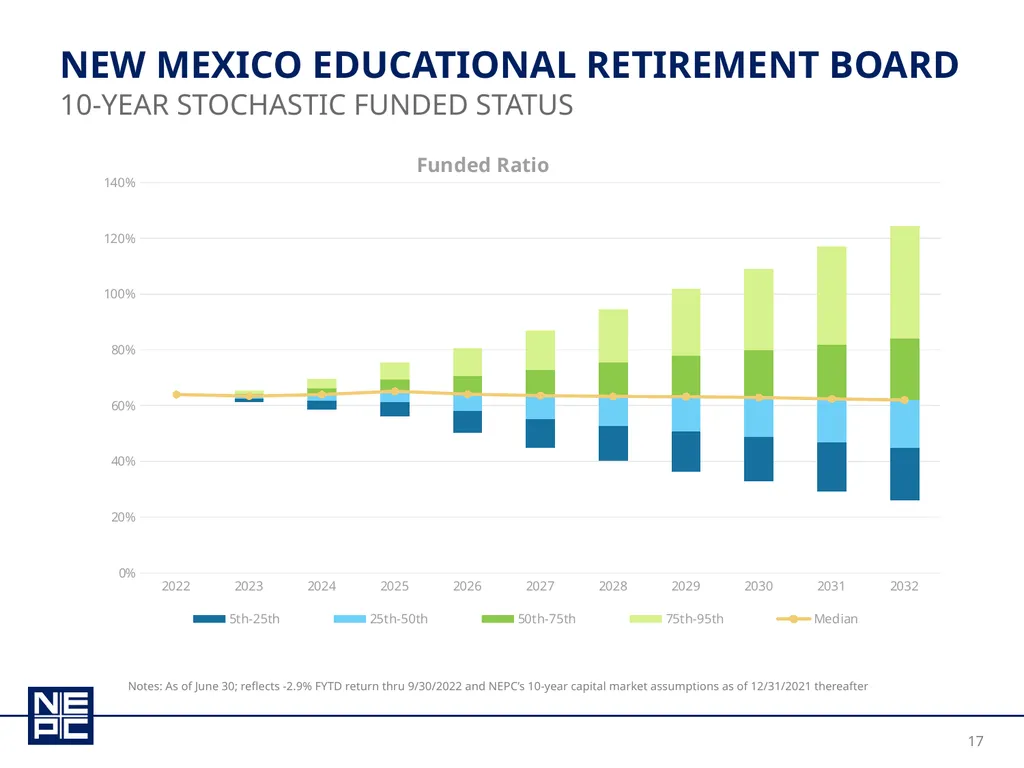
New Mexico educational retirement board 10-year stochastic funded status Notes: As of June 30; reflects -2.9% FYTD return thru 9/30/2022 and NEPC’s 10-year capital market assumptions as of 12/31/2021 thereafter<br>
18
New Mexico educational retirement board 10-year contribution projection Notes: For the year ending June 30; ARP contributions are reflected in the employer contribution dollar amount but not the employer contribution rate; Recommended Employer Rate is based on a closed amortization of the unfunded liability ending June 30, 2049<br>
19
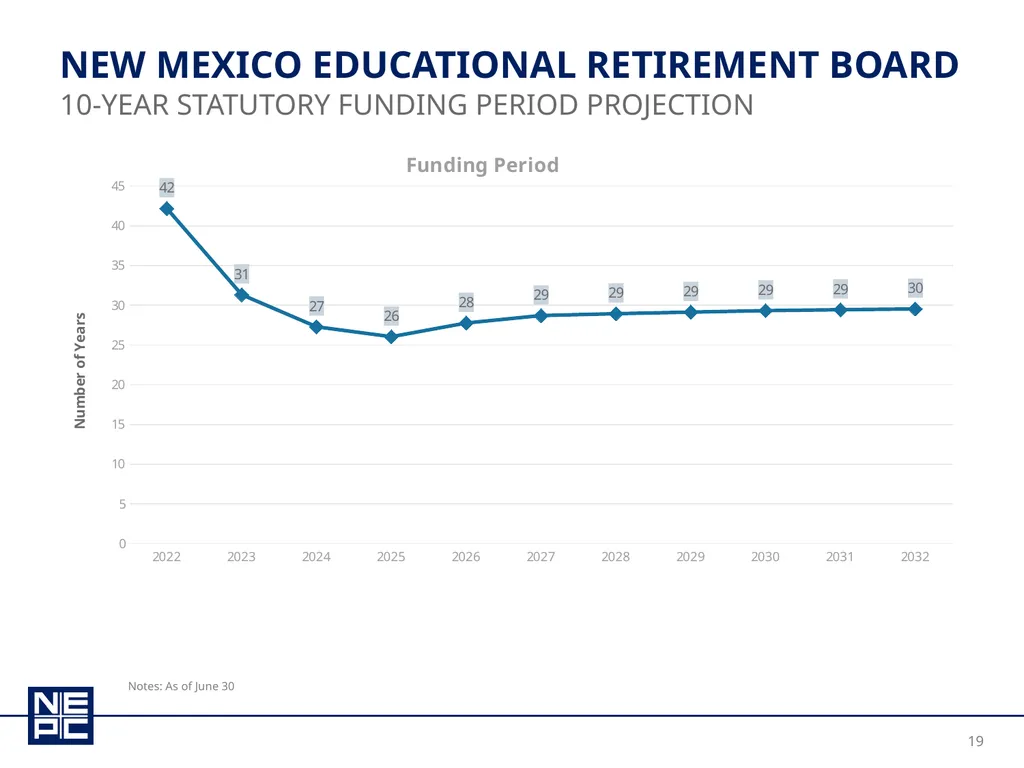
New Mexico educational retirement board 10-year Statutory Funding period projection Notes: As of June 30<br>
20
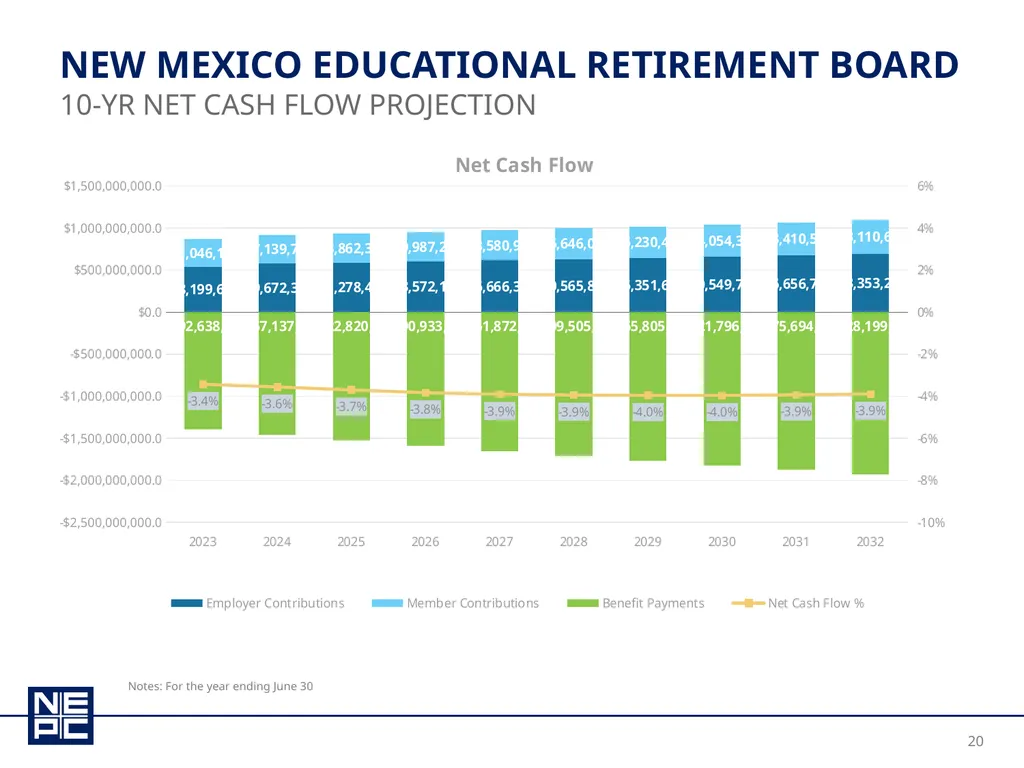
New Mexico educational retirement board 10-yr Net Cash flow projection Notes: For the year ending June 30<br>
21
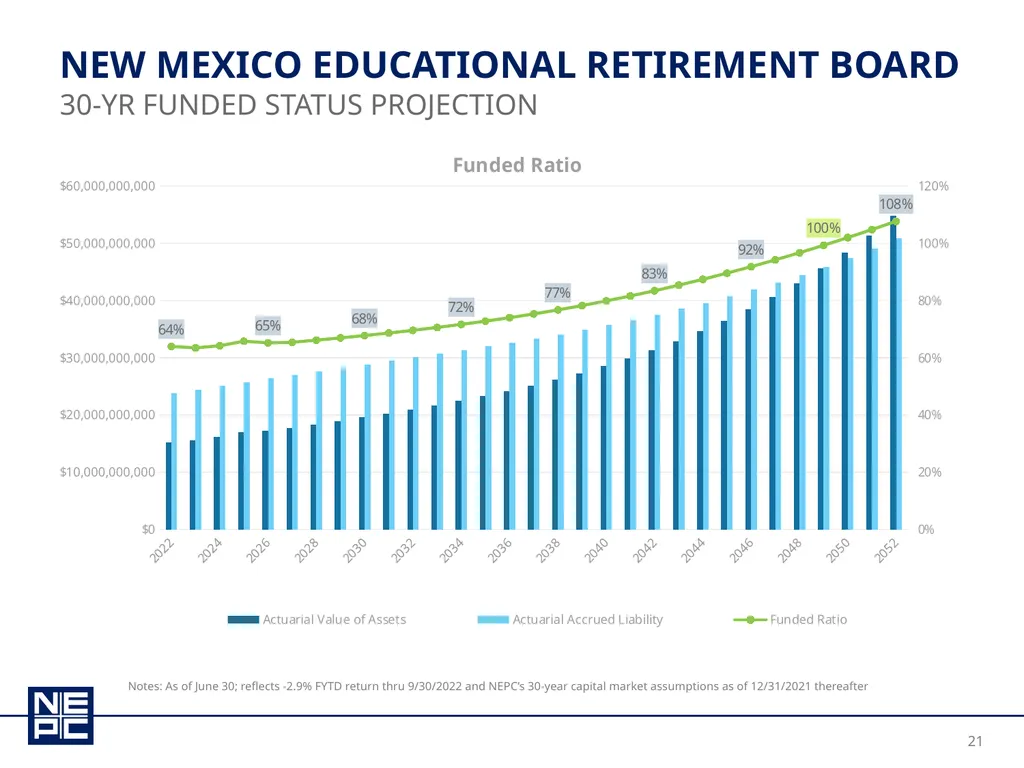
New Mexico educational retirement board 30-yr funded status projection Notes: As of June 30; reflects -2.9% FYTD return thru 9/30/2022 and NEPC’s 30-year capital market assumptions as of 12/31/2021 thereafter<br>
22
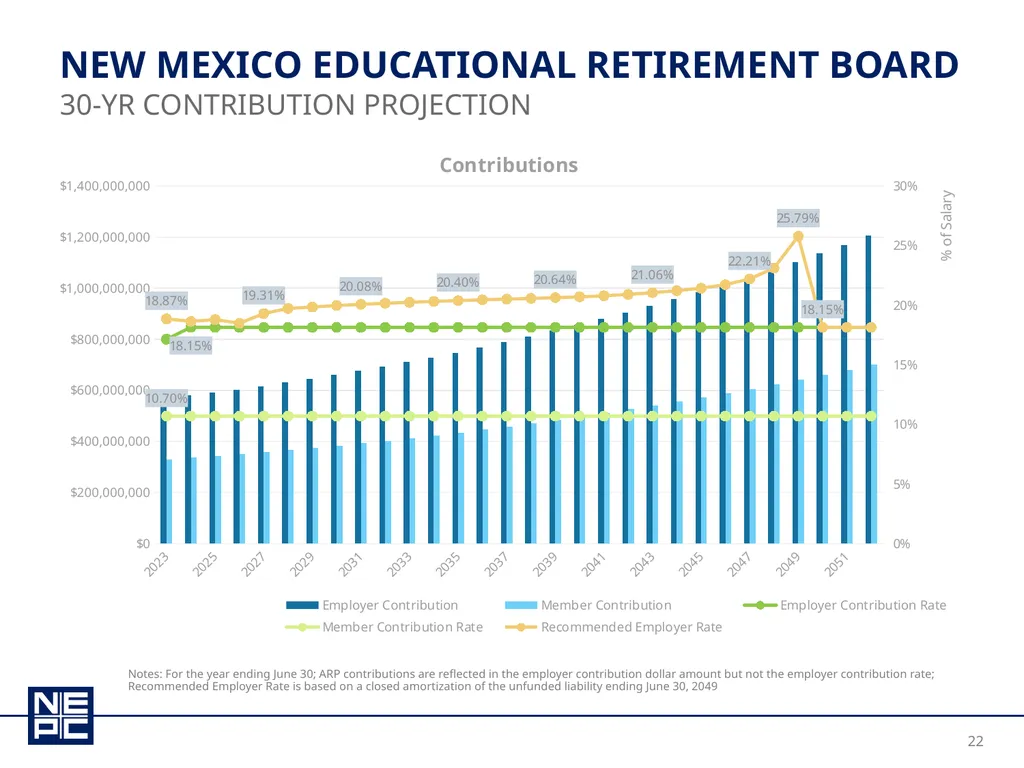
New Mexico educational retirement board 30-yr contribution projection Notes: For the year ending June 30; ARP contributions are reflected in the employer contribution dollar amount but not the employer contribution rate; Recommended Employer Rate is based on a closed amortization of the unfunded liability ending June 30, 2049<br>
23
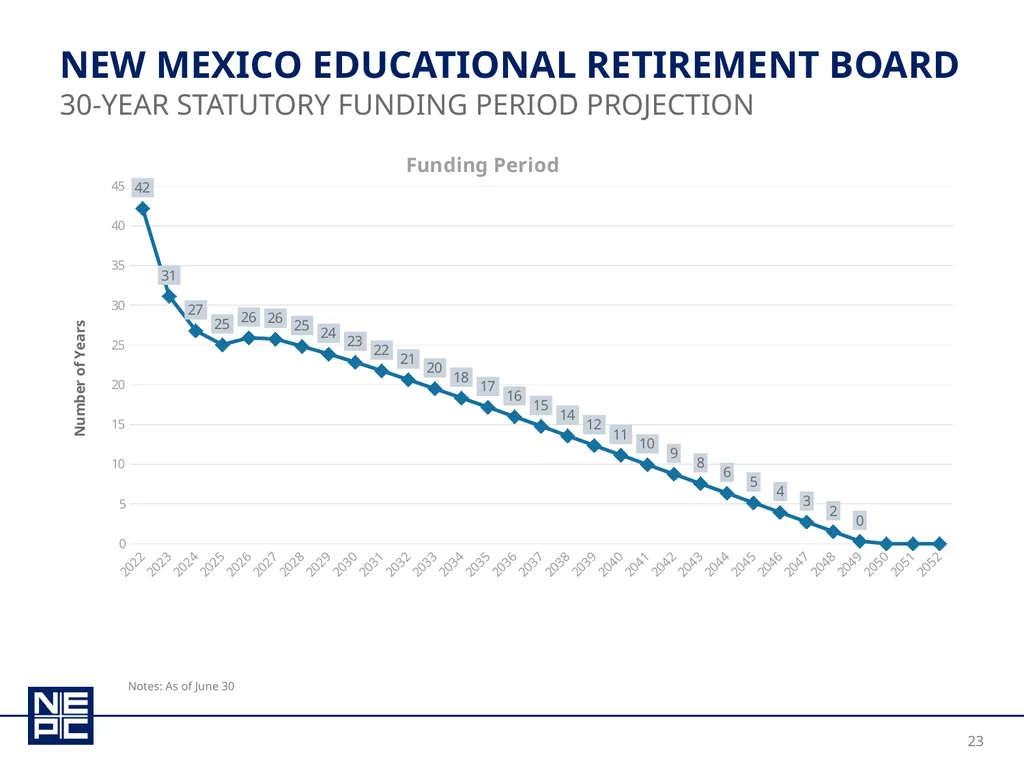
New Mexico educational retirement board 30-year Statutory Funding period projection Notes: As of June 30<br>
24
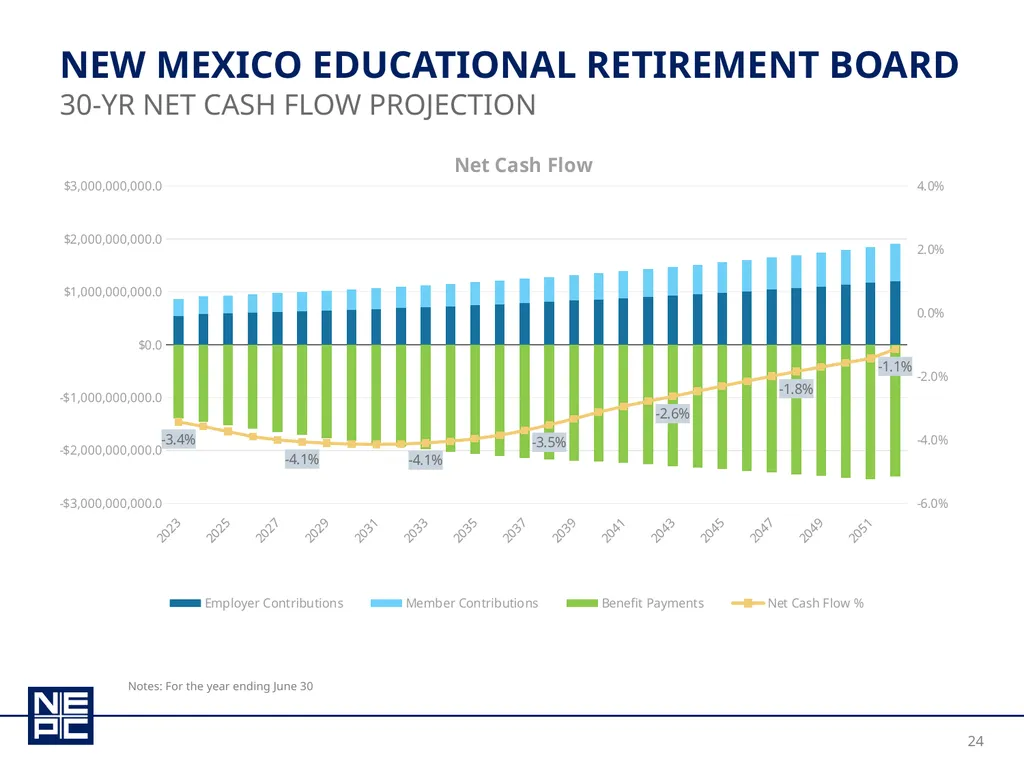
New Mexico educational retirement board 30-yr net cash flow projection Notes: For the year ending June 30<br>
25
Asset allocation<br>
26
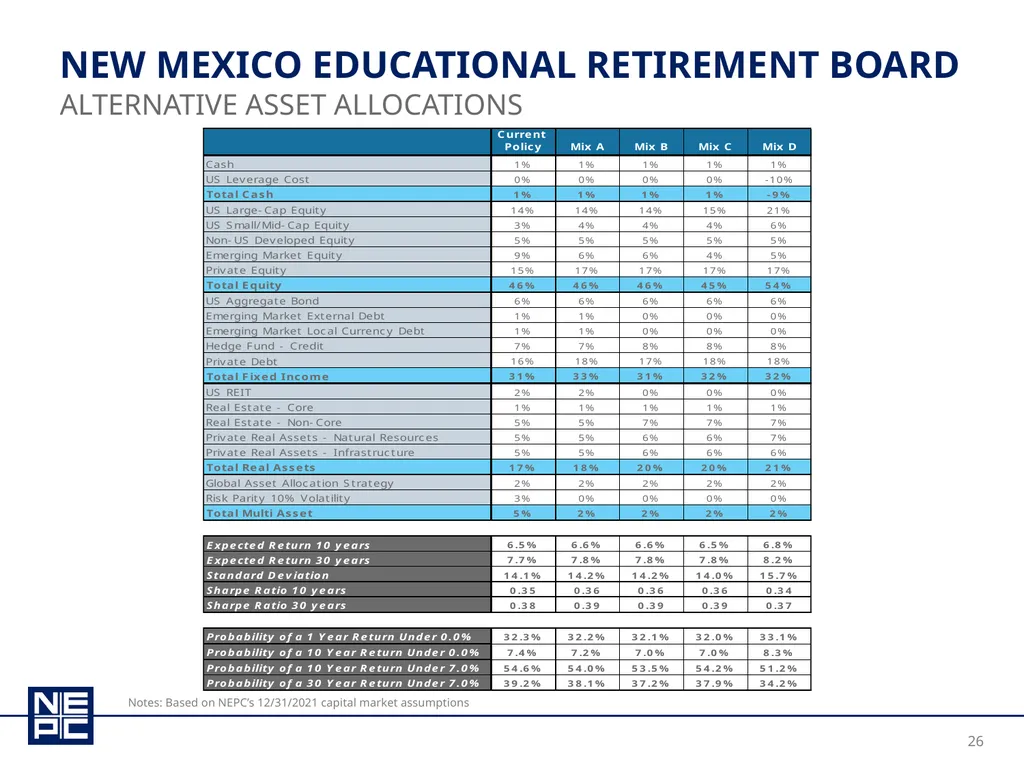
New Mexico educational retirement board Alternative asset allocations Notes: Based on NEPC’s 12/31/2021 capital market assumptions<br>
27
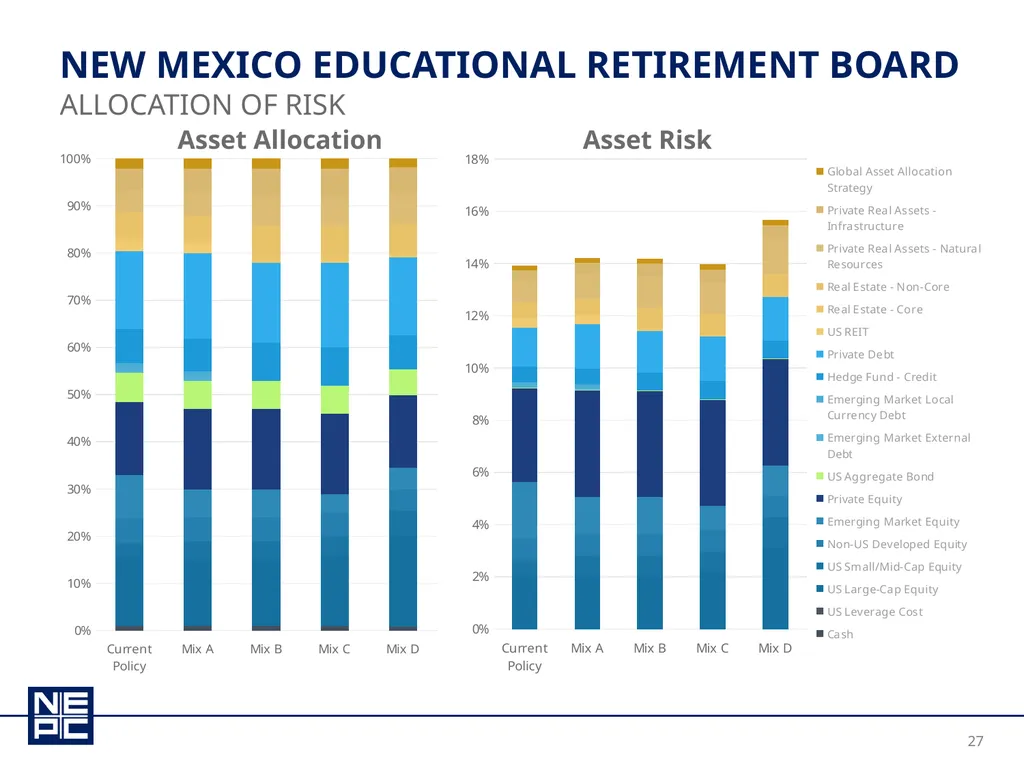
New Mexico educational retirement board Allocation of risk Asset Allocation Asset Risk<br>
28
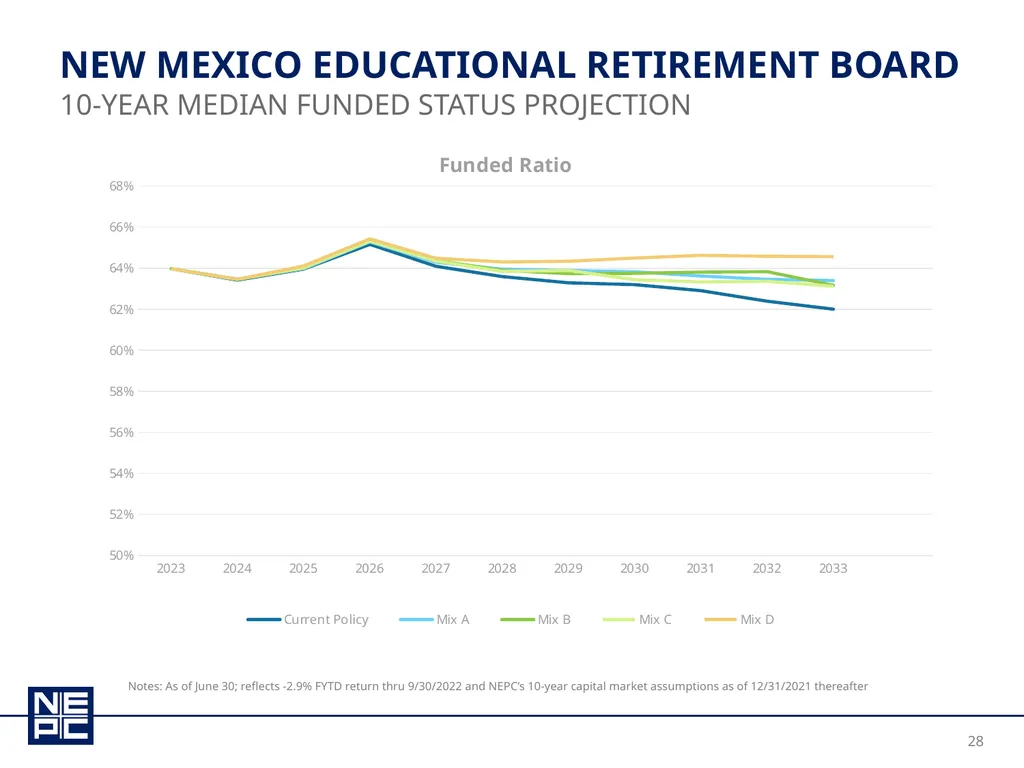
New Mexico educational retirement board 10-year Median funded status projection Notes: As of June 30; reflects -2.9% FYTD return thru 9/30/2022 and NEPC’s 10-year capital market assumptions as of 12/31/2021 thereafter<br>
29
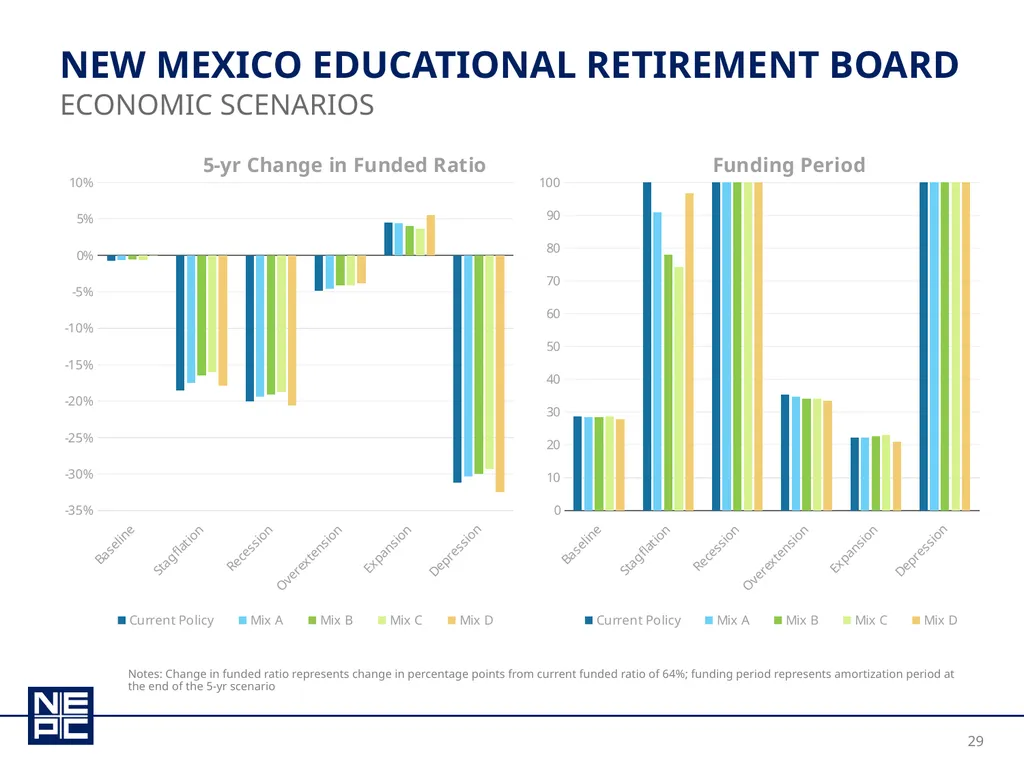
New Mexico educational retirement board Economic scenarios Notes: Change in funded ratio represents change in percentage points from current funded ratio of 64%; funding period represents amortization period at the end of the 5-yr scenario<br>
30
appendix<br>
31
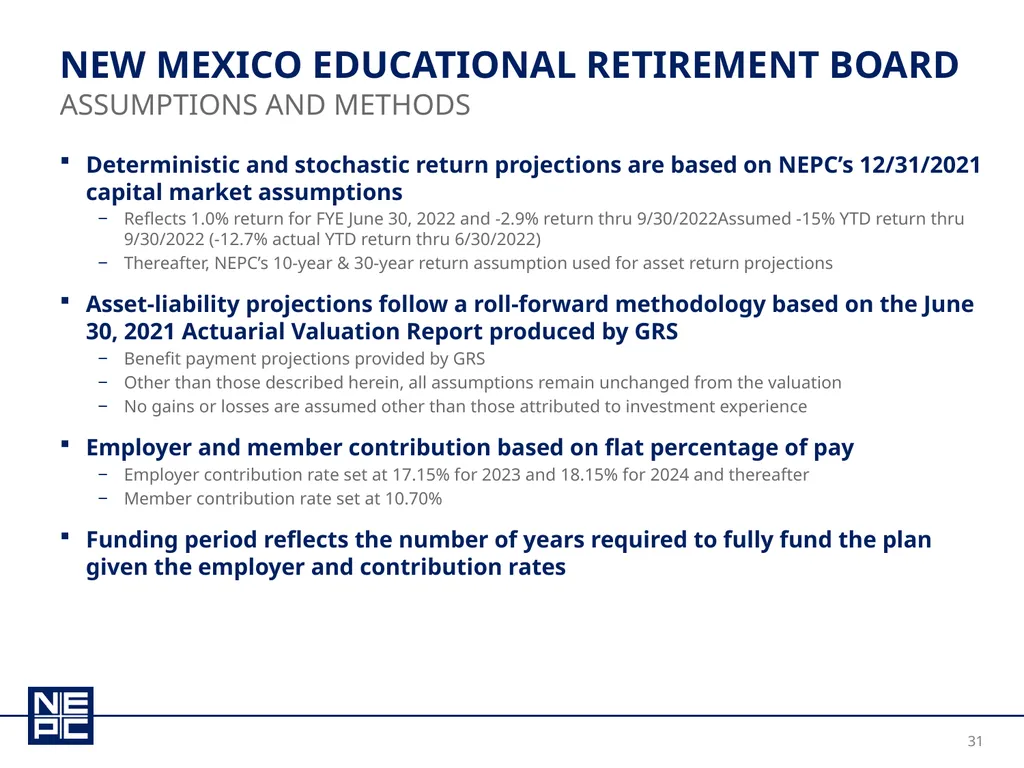
New Mexico educational retirement board Assumptions and methods Deterministic and stochastic return projections are based on NEPC’s 12/31/2021 capital market assumptions
Reflects 1.0% return for FYE June 30, 2022 and -2.9% return thru 9/30/2022Assumed -15% YTD return thru 9/30/2022 (-12.7% actual YTD return thru 6/30/2022)
Thereafter, NEPC’s 10-year & 30-year return assumption used for asset return projections
Asset-liability projections follow a roll-forward methodology based on the June 30, 2021 Actuarial Valuation Report produced by GRS
Benefit payment projections provided by GRS
Other than those described herein, all assumptions remain unchanged from the valuation
No gains or losses are assumed other than those attributed to investment experience
Employer and member contribution based on flat percentage of pay
Employer contribution rate set at 17.15% for 2023 and 18.15% for 2024 and thereafter
Member contribution rate set at 10.70%
Funding period reflects the number of years required to fully fund the plan given the employer and contribution rates<br>
Reflects 1.0% return for FYE June 30, 2022 and -2.9% return thru 9/30/2022Assumed -15% YTD return thru 9/30/2022 (-12.7% actual YTD return thru 6/30/2022)
Thereafter, NEPC’s 10-year & 30-year return assumption used for asset return projections
Asset-liability projections follow a roll-forward methodology based on the June 30, 2021 Actuarial Valuation Report produced by GRS
Benefit payment projections provided by GRS
Other than those described herein, all assumptions remain unchanged from the valuation
No gains or losses are assumed other than those attributed to investment experience
Employer and member contribution based on flat percentage of pay
Employer contribution rate set at 17.15% for 2023 and 18.15% for 2024 and thereafter
Member contribution rate set at 10.70%
Funding period reflects the number of years required to fully fund the plan given the employer and contribution rates<br>
32
12/31/2021 capital market assumptions<br>
33
12/31/2021 capital market assumptions<br>
34
12/31/2021 capital market assumptions<br>
35
12/31/2021 capital market assumptions<br>
36
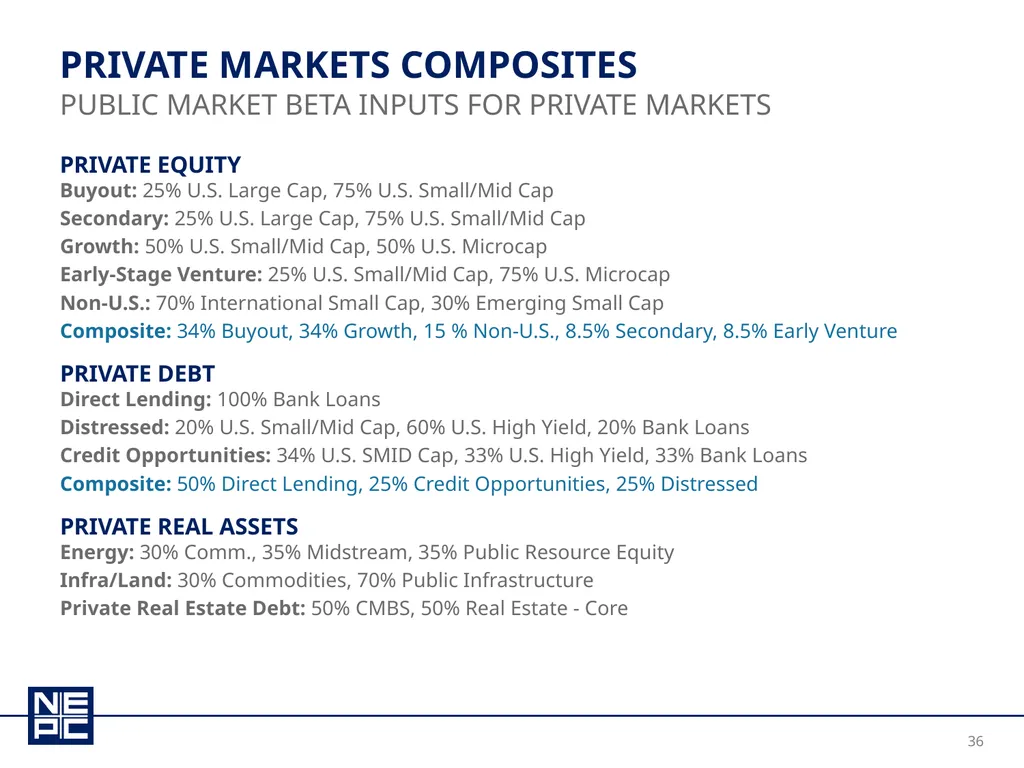
PRIVATE EQUITY
Buyout: 25% U.S. Large Cap, 75% U.S. Small/Mid Cap
Secondary: 25% U.S. Large Cap, 75% U.S. Small/Mid Cap
Growth: 50% U.S. Small/Mid Cap, 50% U.S. Microcap
Early-Stage Venture: 25% U.S. Small/Mid Cap, 75% U.S. Microcap
Non-U.S.: 70% International Small Cap, 30% Emerging Small Cap
Composite: 34% Buyout, 34% Growth, 15 % Non-U.S., 8.5% Secondary, 8.5% Early Venture
PRIVATE DEBT
Direct Lending: 100% Bank Loans
Distressed: 20% U.S. Small/Mid Cap, 60% U.S. High Yield, 20% Bank Loans
Credit Opportunities: 34% U.S. SMID Cap, 33% U.S. High Yield, 33% Bank Loans
Composite: 50% Direct Lending, 25% Credit Opportunities, 25% Distressed
PRIVATE REAL ASSETS
Energy: 30% Comm., 35% Midstream, 35% Public Resource Equity
Infra/Land: 30% Commodities, 70% Public Infrastructure
Private Real Estate Debt: 50% CMBS, 50% Real Estate - Core Private Markets Composites Public market beta inputs for private markets<br>
Buyout: 25% U.S. Large Cap, 75% U.S. Small/Mid Cap
Secondary: 25% U.S. Large Cap, 75% U.S. Small/Mid Cap
Growth: 50% U.S. Small/Mid Cap, 50% U.S. Microcap
Early-Stage Venture: 25% U.S. Small/Mid Cap, 75% U.S. Microcap
Non-U.S.: 70% International Small Cap, 30% Emerging Small Cap
Composite: 34% Buyout, 34% Growth, 15 % Non-U.S., 8.5% Secondary, 8.5% Early Venture
PRIVATE DEBT
Direct Lending: 100% Bank Loans
Distressed: 20% U.S. Small/Mid Cap, 60% U.S. High Yield, 20% Bank Loans
Credit Opportunities: 34% U.S. SMID Cap, 33% U.S. High Yield, 33% Bank Loans
Composite: 50% Direct Lending, 25% Credit Opportunities, 25% Distressed
PRIVATE REAL ASSETS
Energy: 30% Comm., 35% Midstream, 35% Public Resource Equity
Infra/Land: 30% Commodities, 70% Public Infrastructure
Private Real Estate Debt: 50% CMBS, 50% Real Estate - Core Private Markets Composites Public market beta inputs for private markets<br>
37
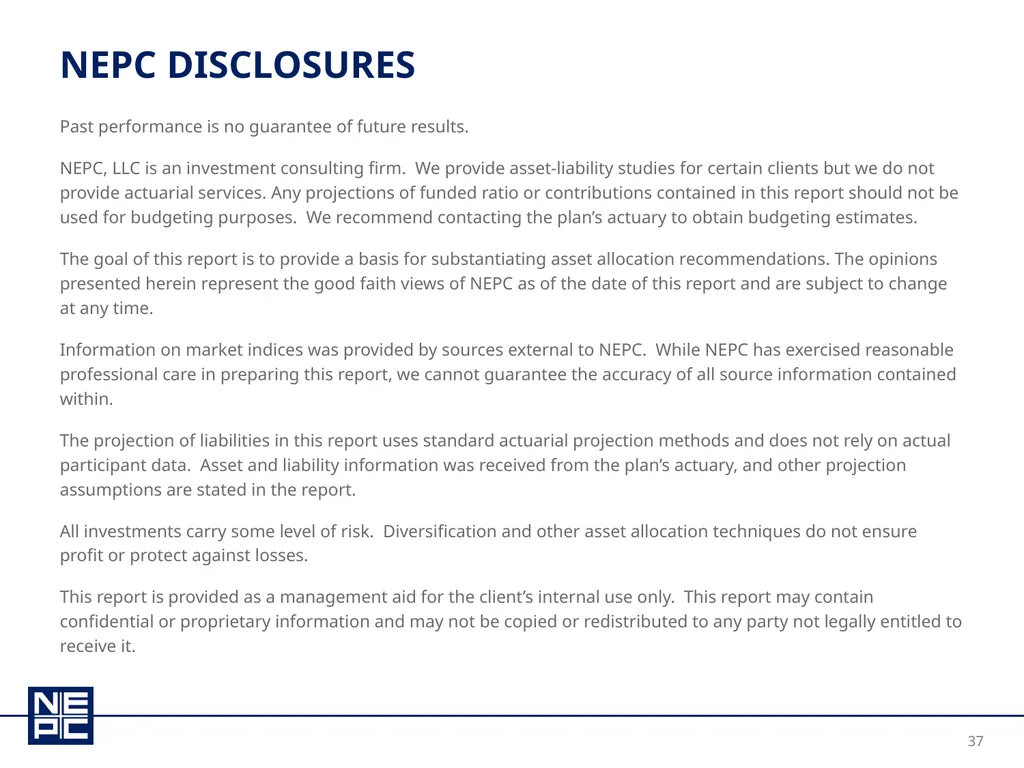
Nepc disclosures Past performance is no guarantee of future results.
NEPC, LLC is an investment consulting firm. We provide asset-liability studies for certain clients but we do not provide actuarial services. Any projections of funded ratio or contributions contained in this report should not be used for budgeting purposes. We recommend contacting the plan’s actuary to obtain budgeting estimates.
The goal of this report is to provide a basis for substantiating asset allocation recommendations. The opinions presented herein represent the good faith views of NEPC as of the date of this report and are subject to change at any time.
Information on market indices was provided by sources external to NEPC. While NEPC has exercised reasonable professional care in preparing this report, we cannot guarantee the accuracy of all source information contained within.
The projection of liabilities in this report uses standard actuarial projection methods and does not rely on actual participant data. Asset and liability information was received from the plan’s actuary, and other projection assumptions are stated in the report.
All investments carry some level of risk. Diversification and other asset allocation techniques do not ensure profit or protect against losses.
This report is provided as a management aid for the client’s internal use only. This report may contain confidential or proprietary information and may not be copied or redistributed to any party not legally entitled to receive it.<br>
NEPC, LLC is an investment consulting firm. We provide asset-liability studies for certain clients but we do not provide actuarial services. Any projections of funded ratio or contributions contained in this report should not be used for budgeting purposes. We recommend contacting the plan’s actuary to obtain budgeting estimates.
The goal of this report is to provide a basis for substantiating asset allocation recommendations. The opinions presented herein represent the good faith views of NEPC as of the date of this report and are subject to change at any time.
Information on market indices was provided by sources external to NEPC. While NEPC has exercised reasonable professional care in preparing this report, we cannot guarantee the accuracy of all source information contained within.
The projection of liabilities in this report uses standard actuarial projection methods and does not rely on actual participant data. Asset and liability information was received from the plan’s actuary, and other projection assumptions are stated in the report.
All investments carry some level of risk. Diversification and other asset allocation techniques do not ensure profit or protect against losses.
This report is provided as a management aid for the client’s internal use only. This report may contain confidential or proprietary information and may not be copied or redistributed to any party not legally entitled to receive it.<br>