
Power System Implications of Subsidy Removal,
A
Published · 32 slides · 0 views

1 / 1



Description
Power System Implications of Subsidy Removal, Regional Electricity Trade and Carbon Constraints in MENA Economies Govinda Timilsina Sr. Research Economist, DECRG, World Bank 1 MENA SEMINAR SERIES HOSTED BY World Bank Middle East and North
Related Topics
Share
Embed code
Download this presentation From Below
"Power System Implications of Subsidy Removal," is the property of its rightful owner. Permission is granted to download and print the materials on this website for personal, non-commercial use only, and to display it on your personal computer provided you do not modify the materials and that you retain all copyright notices contained in the materials. By downloading content from our website, you accept the terms of this agreement.
Presentation Transcript
01
Power System Implications of Subsidy Removal, Regional Electricity Trade and Carbon Constraints in MENA Economies Govinda Timilsina
Sr. Research Economist, DECRG, World Bank 1 MENA SEMINAR SERIES HOSTED BY
World Bank Middle East and North Africa Chief Economist Office
September 17, 2020<br>
Sr. Research Economist, DECRG, World Bank 1 MENA SEMINAR SERIES HOSTED BY
World Bank Middle East and North Africa Chief Economist Office
September 17, 2020<br>
02
2 Acknowledgments Energy GP led study - Pan-Arab Regional Energy Market Initiative (TTL -- Waleed Alsuraih)
Ilka F. D. Curiel, co-author, ‘Power System Implications of Subsidy Removal, Regional Electricity Trade, and Carbon Constraints in MENA Economies, World Bank Policy Research Paper, #9297, World Bank, Washington, DC<br>
Ilka F. D. Curiel, co-author, ‘Power System Implications of Subsidy Removal, Regional Electricity Trade, and Carbon Constraints in MENA Economies, World Bank Policy Research Paper, #9297, World Bank, Washington, DC<br>
03
Outline Introduction, Context and Objective
Methodology
Data and Assumptions
Results
Conclusions
Discussions 3<br>
Methodology
Data and Assumptions
Results
Conclusions
Discussions 3<br>
04
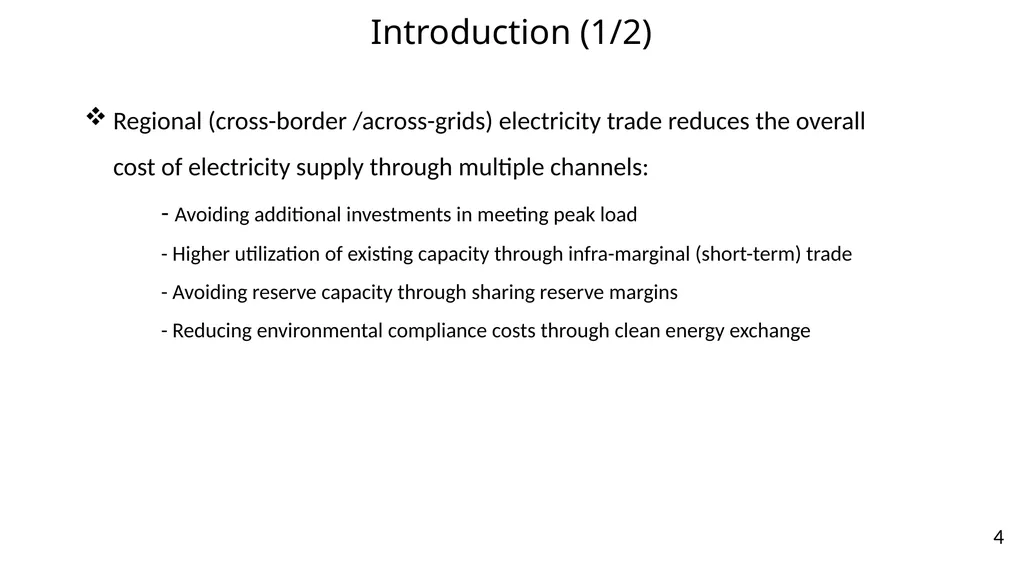
Introduction (1/2) Regional (cross-border /across-grids) electricity trade reduces the overall cost of electricity supply through multiple channels:
- Avoiding additional investments in meeting peak load
- Higher utilization of existing capacity through infra-marginal (short-term) trade
- Avoiding reserve capacity through sharing reserve margins
- Reducing environmental compliance costs through clean energy exchange 4<br>
- Avoiding additional investments in meeting peak load
- Higher utilization of existing capacity through infra-marginal (short-term) trade
- Avoiding reserve capacity through sharing reserve margins
- Reducing environmental compliance costs through clean energy exchange 4<br>
05
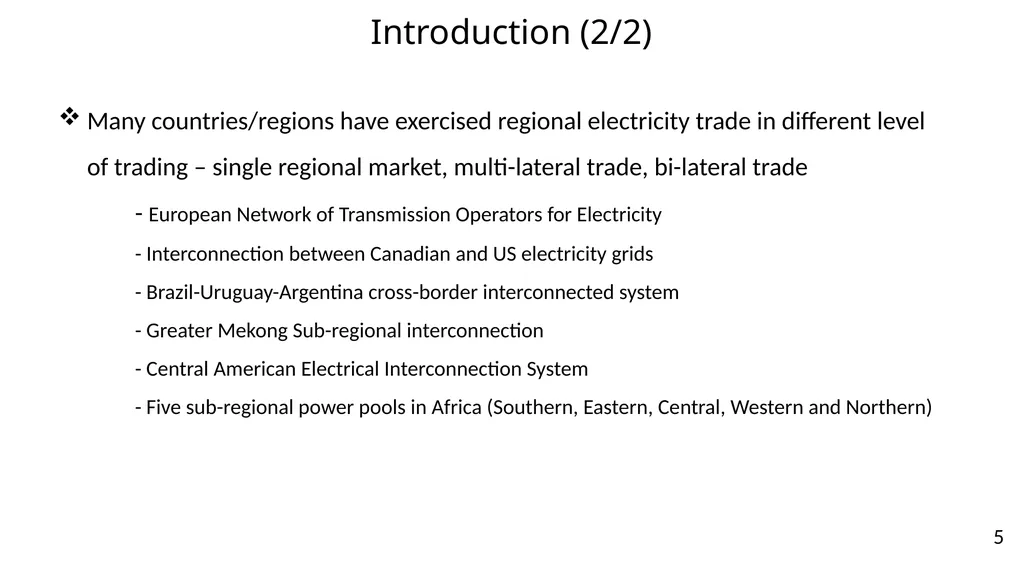
Introduction (2/2) Many countries/regions have exercised regional electricity trade in different level of trading – single regional market, multi-lateral trade, bi-lateral trade
- European Network of Transmission Operators for Electricity
- Interconnection between Canadian and US electricity grids
- Brazil-Uruguay-Argentina cross-border interconnected system
- Greater Mekong Sub-regional interconnection
- Central American Electrical Interconnection System
- Five sub-regional power pools in Africa (Southern, Eastern, Central, Western and Northern) 5<br>
- European Network of Transmission Operators for Electricity
- Interconnection between Canadian and US electricity grids
- Brazil-Uruguay-Argentina cross-border interconnected system
- Greater Mekong Sub-regional interconnection
- Central American Electrical Interconnection System
- Five sub-regional power pools in Africa (Southern, Eastern, Central, Western and Northern) 5<br>
06
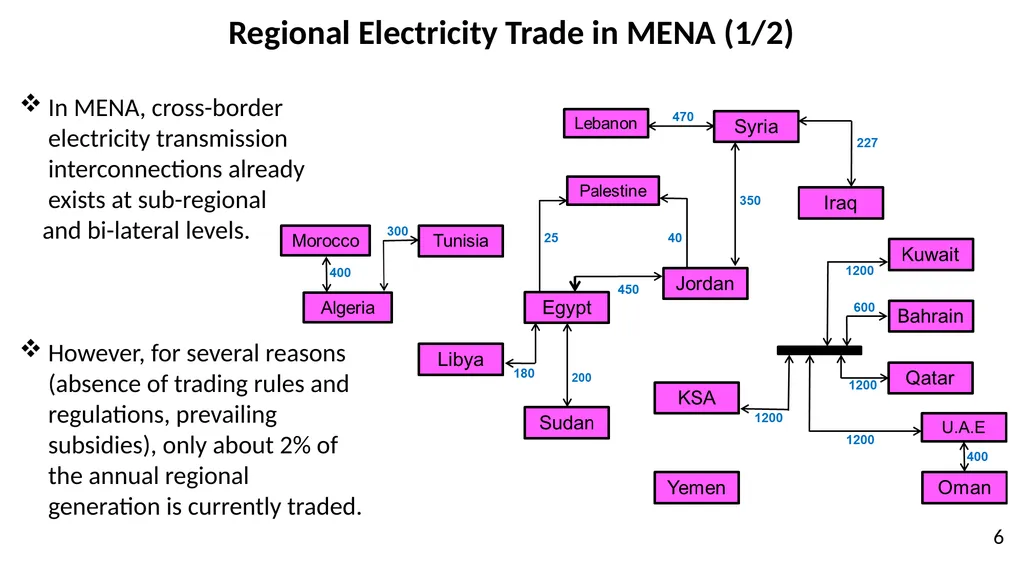
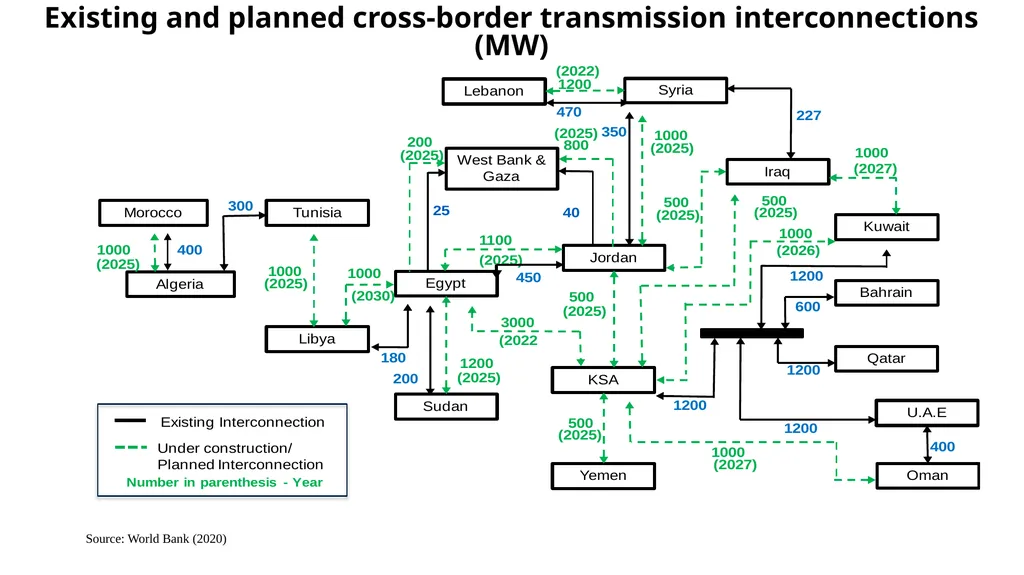
Regional Electricity Trade in MENA (1/2) In MENA, cross-border electricity transmission interconnections already exists at sub-regional
and bi-lateral levels.
However, for several reasons (absence of trading rules and regulations, prevailing subsidies), only about 2% of the annual regional generation is currently traded. 6<br>
and bi-lateral levels.
However, for several reasons (absence of trading rules and regulations, prevailing subsidies), only about 2% of the annual regional generation is currently traded. 6<br>
07
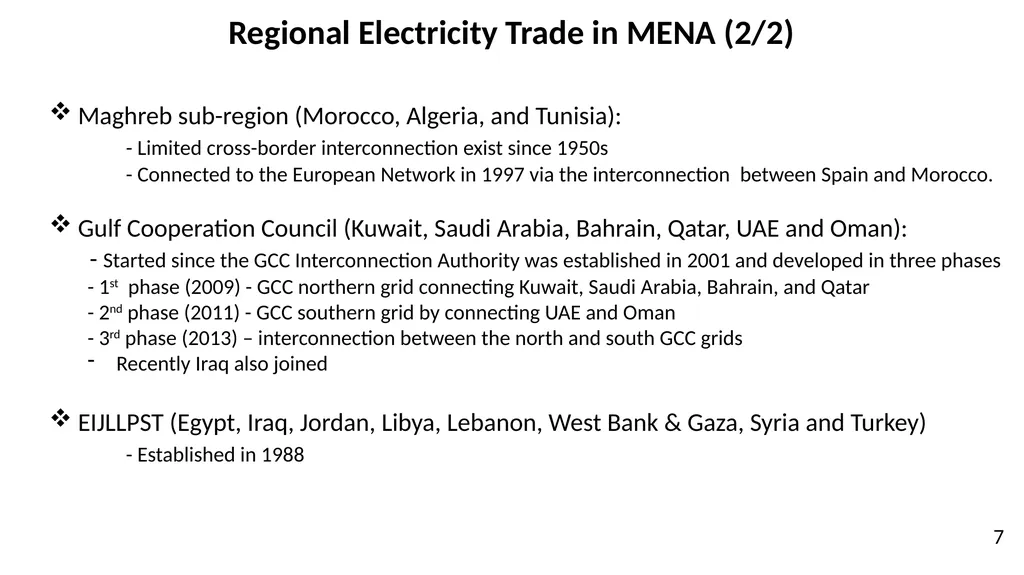
Regional Electricity Trade in MENA (2/2) Maghreb sub-region (Morocco, Algeria, and Tunisia):
- Limited cross-border interconnection exist since 1950s
- Connected to the European Network in 1997 via the interconnection between Spain and Morocco.
Gulf Cooperation Council (Kuwait, Saudi Arabia, Bahrain, Qatar, UAE and Oman):
- Started since the GCC Interconnection Authority was established in 2001 and developed in three phases
- 1st phase (2009) - GCC northern grid connecting Kuwait, Saudi Arabia, Bahrain, and Qatar
- 2nd phase (2011) - GCC southern grid by connecting UAE and Oman
- 3rd phase (2013) – interconnection between the north and south GCC grids
Recently Iraq also joined
EIJLLPST (Egypt, Iraq, Jordan, Libya, Lebanon, West Bank & Gaza, Syria and Turkey)
- Established in 1988 7<br>
- Limited cross-border interconnection exist since 1950s
- Connected to the European Network in 1997 via the interconnection between Spain and Morocco.
Gulf Cooperation Council (Kuwait, Saudi Arabia, Bahrain, Qatar, UAE and Oman):
- Started since the GCC Interconnection Authority was established in 2001 and developed in three phases
- 1st phase (2009) - GCC northern grid connecting Kuwait, Saudi Arabia, Bahrain, and Qatar
- 2nd phase (2011) - GCC southern grid by connecting UAE and Oman
- 3rd phase (2013) – interconnection between the north and south GCC grids
Recently Iraq also joined
EIJLLPST (Egypt, Iraq, Jordan, Libya, Lebanon, West Bank & Gaza, Syria and Turkey)
- Established in 1988 7<br>
08
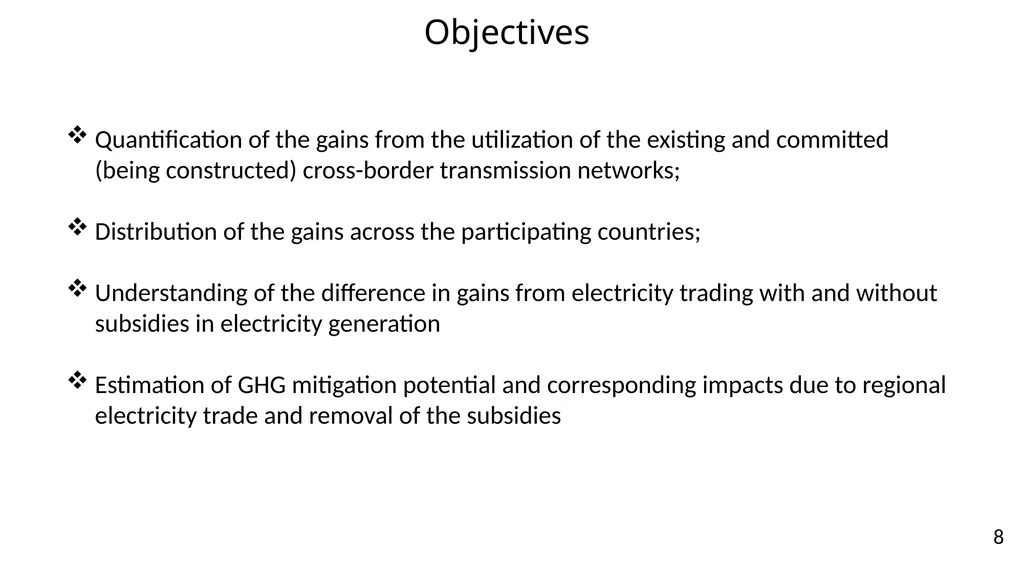
Objectives Quantification of the gains from the utilization of the existing and committed (being constructed) cross-border transmission networks;
Distribution of the gains across the participating countries;
Understanding of the difference in gains from electricity trading with and without subsidies in electricity generation
Estimation of GHG mitigation potential and corresponding impacts due to regional electricity trade and removal of the subsidies 8<br>
Distribution of the gains across the participating countries;
Understanding of the difference in gains from electricity trading with and without subsidies in electricity generation
Estimation of GHG mitigation potential and corresponding impacts due to regional electricity trade and removal of the subsidies 8<br>
09
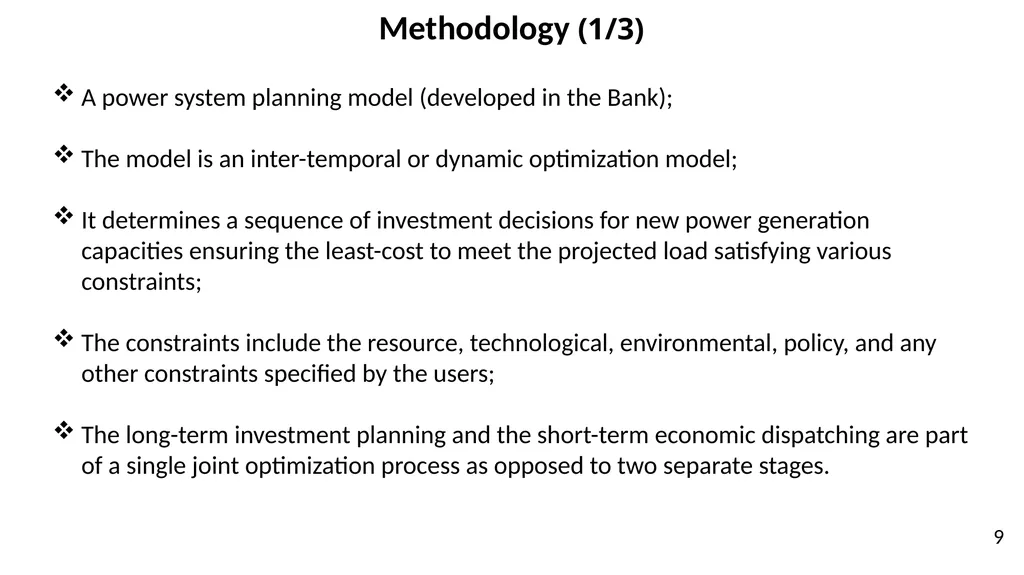
Methodology (1/3) A power system planning model (developed in the Bank);
The model is an inter-temporal or dynamic optimization model;
It determines a sequence of investment decisions for new power generation capacities ensuring the least-cost to meet the projected load satisfying various constraints;
The constraints include the resource, technological, environmental, policy, and any other constraints specified by the users;
The long-term investment planning and the short-term economic dispatching are part of a single joint optimization process as opposed to two separate stages. 9<br>
The model is an inter-temporal or dynamic optimization model;
It determines a sequence of investment decisions for new power generation capacities ensuring the least-cost to meet the projected load satisfying various constraints;
The constraints include the resource, technological, environmental, policy, and any other constraints specified by the users;
The long-term investment planning and the short-term economic dispatching are part of a single joint optimization process as opposed to two separate stages. 9<br>
10
Methodology (2/2) Objective function:
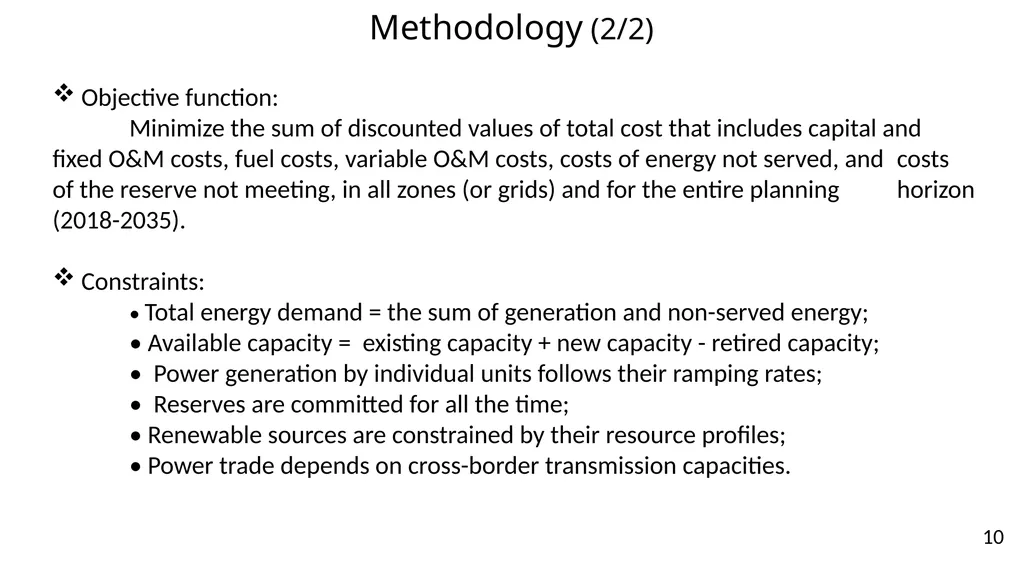
Minimize the sum of discounted values of total cost that includes capital and fixed O&M costs, fuel costs, variable O&M costs, costs of energy not served, and costs of the reserve not meeting, in all zones (or grids) and for the entire planning horizon (2018-2035).
Constraints:
• Total energy demand = the sum of generation and non-served energy;
• Available capacity = existing capacity + new capacity - retired capacity;
• Power generation by individual units follows their ramping rates;
• Reserves are committed for all the time;
• Renewable sources are constrained by their resource profiles;
• Power trade depends on cross-border transmission capacities. 10<br>
Minimize the sum of discounted values of total cost that includes capital and fixed O&M costs, fuel costs, variable O&M costs, costs of energy not served, and costs of the reserve not meeting, in all zones (or grids) and for the entire planning horizon (2018-2035).
Constraints:
• Total energy demand = the sum of generation and non-served energy;
• Available capacity = existing capacity + new capacity - retired capacity;
• Power generation by individual units follows their ramping rates;
• Reserves are committed for all the time;
• Renewable sources are constrained by their resource profiles;
• Power trade depends on cross-border transmission capacities. 10<br>
11
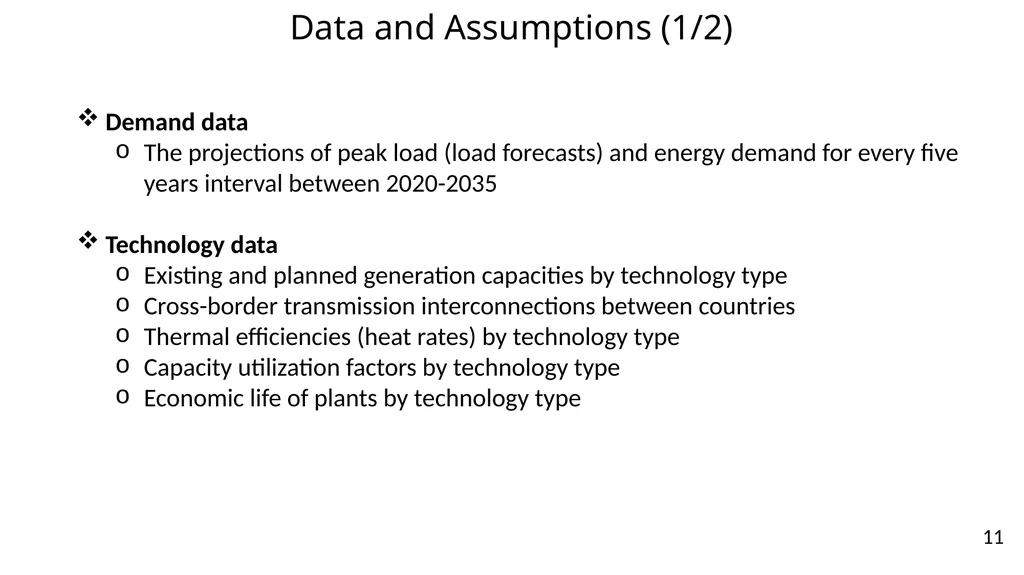
Data and Assumptions (1/2) Demand data
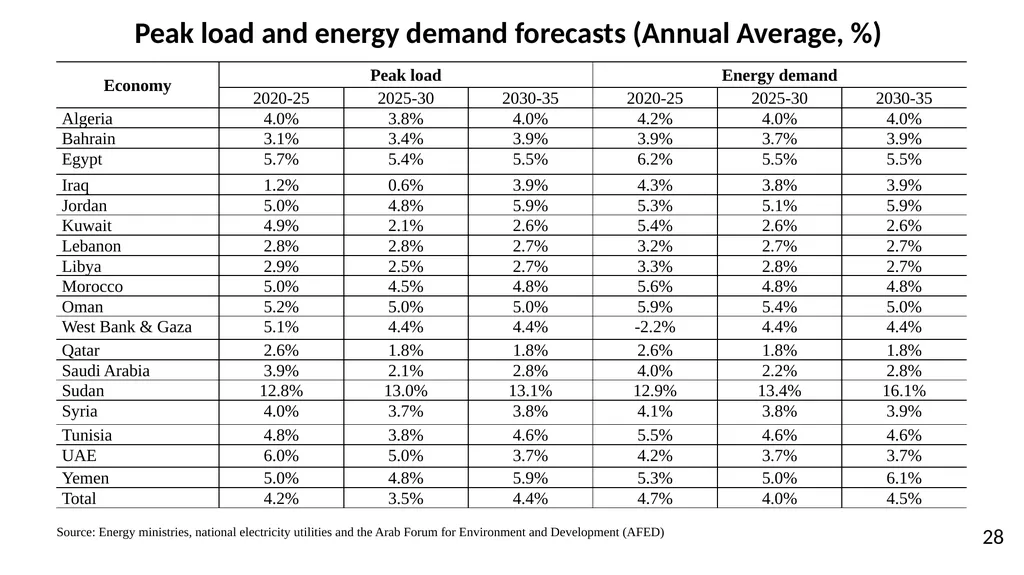
The projections of peak load (load forecasts) and energy demand for every five years interval between 2020-2035
Technology data
Existing and planned generation capacities by technology type
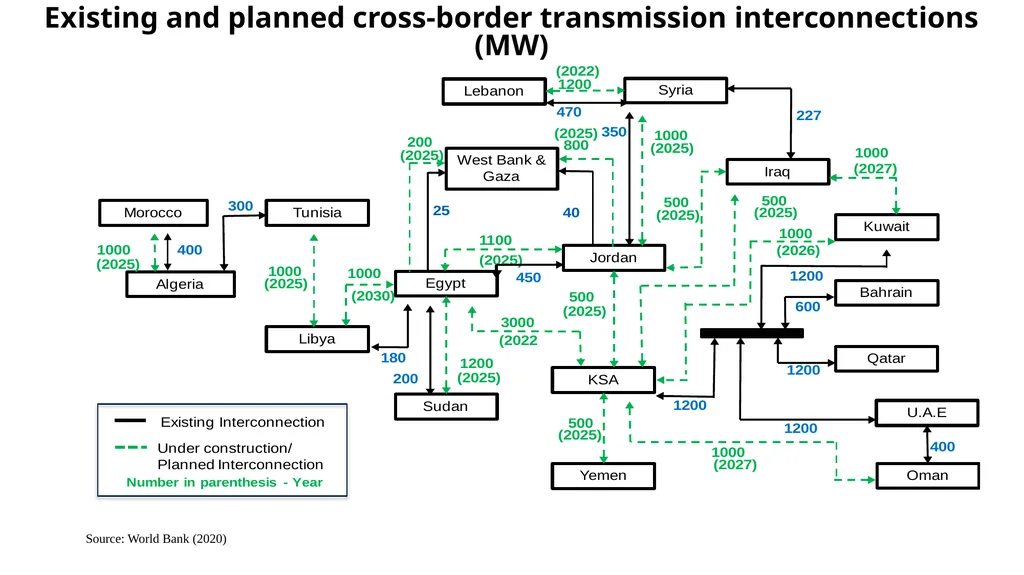
Cross-border transmission interconnections between countries
Thermal efficiencies (heat rates) by technology type
Capacity utilization factors by technology type
Economic life of plants by technology type 11<br>
The projections of peak load (load forecasts) and energy demand for every five years interval between 2020-2035
Technology data
Existing and planned generation capacities by technology type
Cross-border transmission interconnections between countries
Thermal efficiencies (heat rates) by technology type
Capacity utilization factors by technology type
Economic life of plants by technology type 11<br>
12
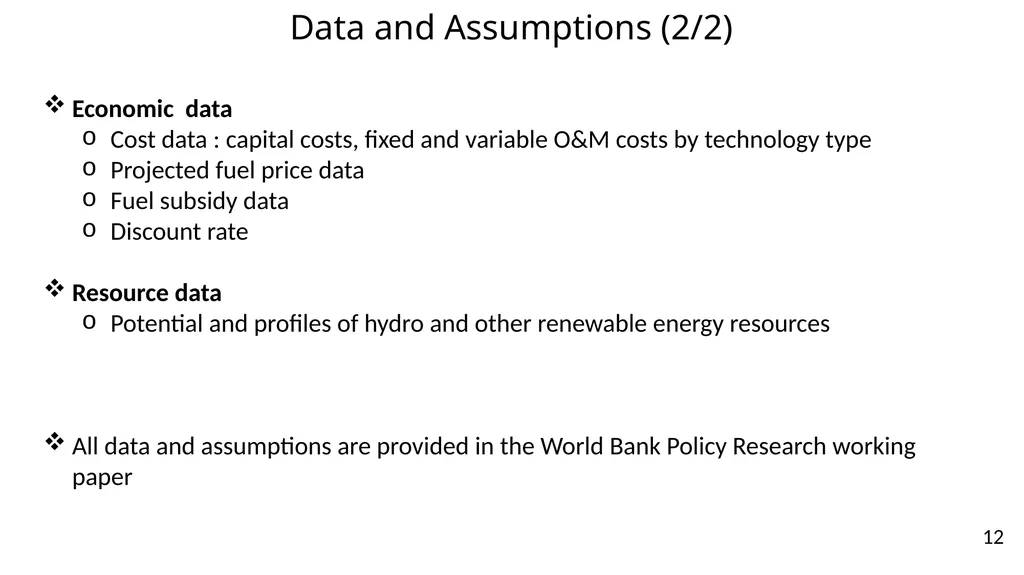
Data and Assumptions (2/2) Economic data
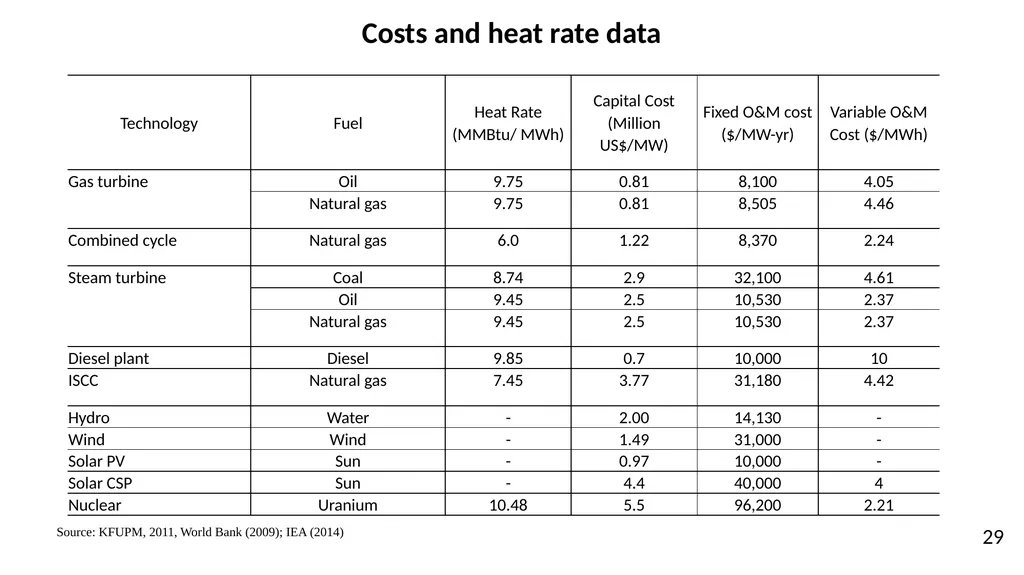
Cost data : capital costs, fixed and variable O&M costs by technology type
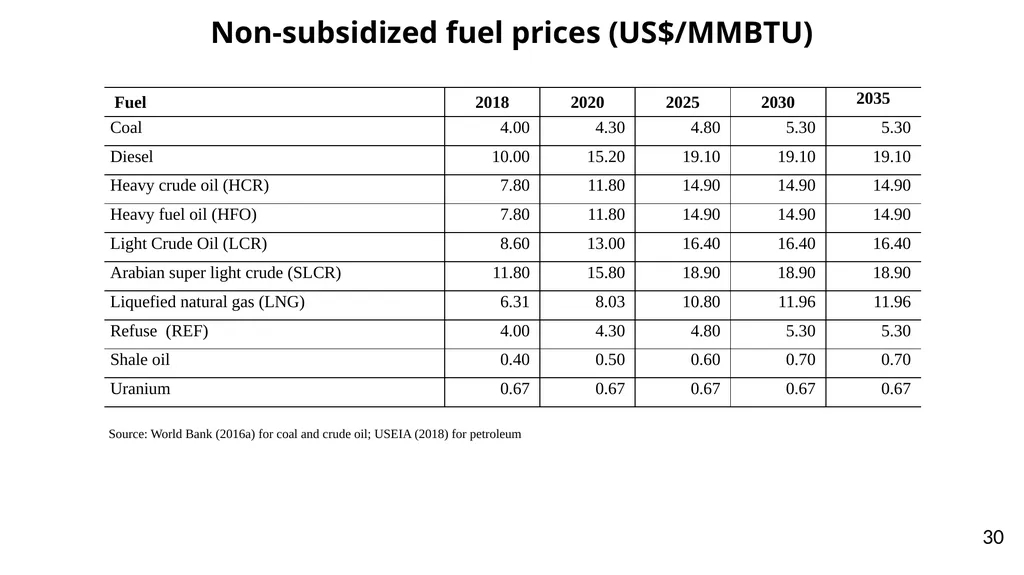
Projected fuel price data
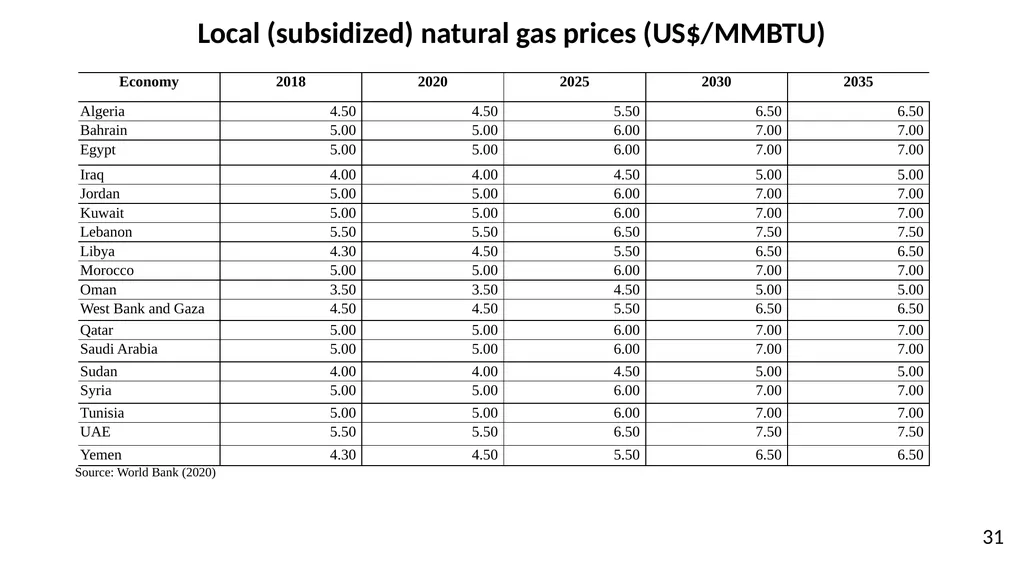
Fuel subsidy data
Discount rate
Resource data
Potential and profiles of hydro and other renewable energy resources
All data and assumptions are provided in the World Bank Policy Research working paper 12<br>
Cost data : capital costs, fixed and variable O&M costs by technology type
Projected fuel price data
Fuel subsidy data
Discount rate
Resource data
Potential and profiles of hydro and other renewable energy resources
All data and assumptions are provided in the World Bank Policy Research working paper 12<br>
13
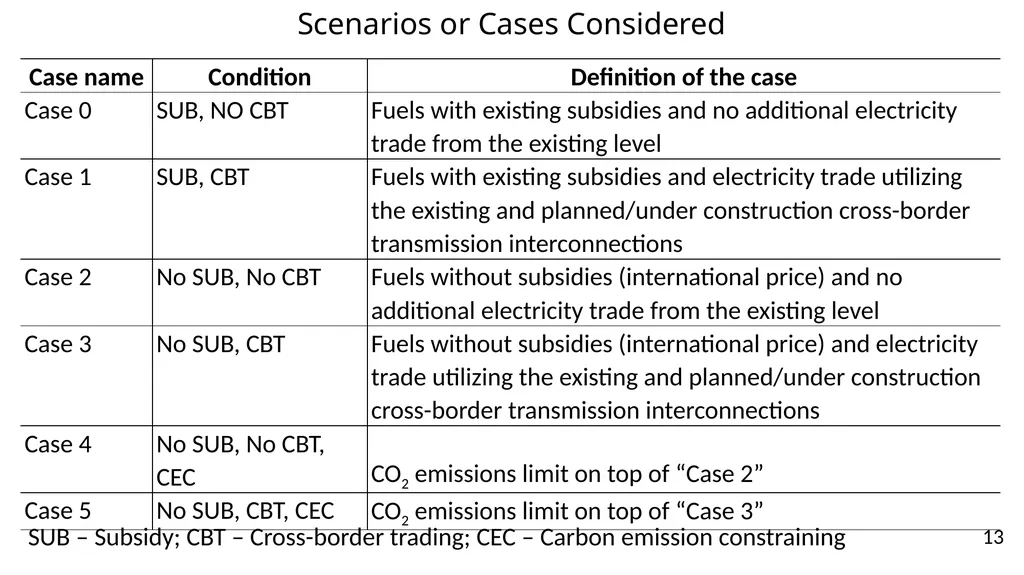
Scenarios or Cases Considered 13 SUB – Subsidy; CBT – Cross-border trading; CEC – Carbon emission constraining<br>
14
Existing and planned cross-border transmission interconnections (MW) Source: World Bank (2020)<br>
15
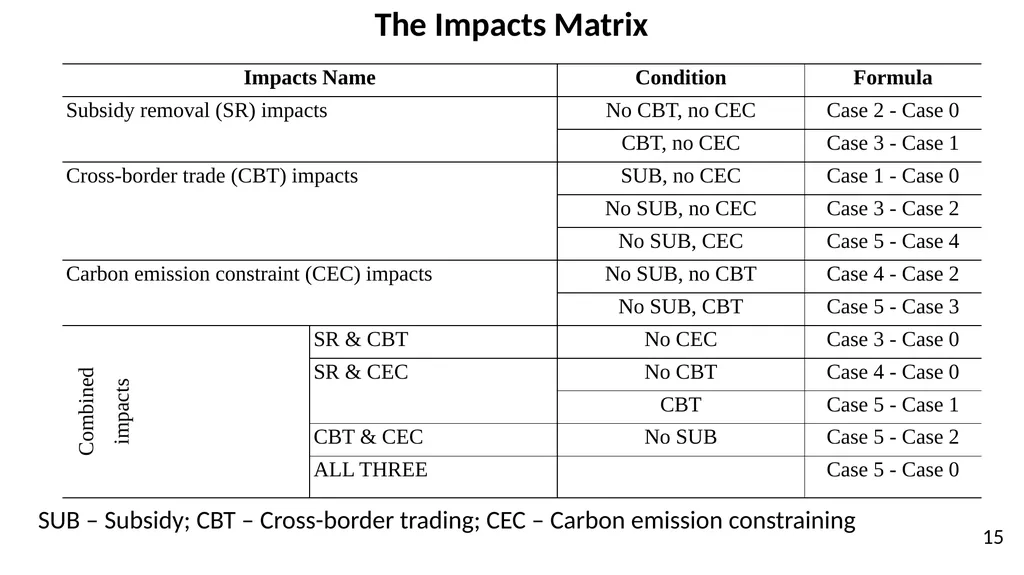
The Impacts Matrix 15 SUB – Subsidy; CBT – Cross-border trading; CEC – Carbon emission constraining<br>
16
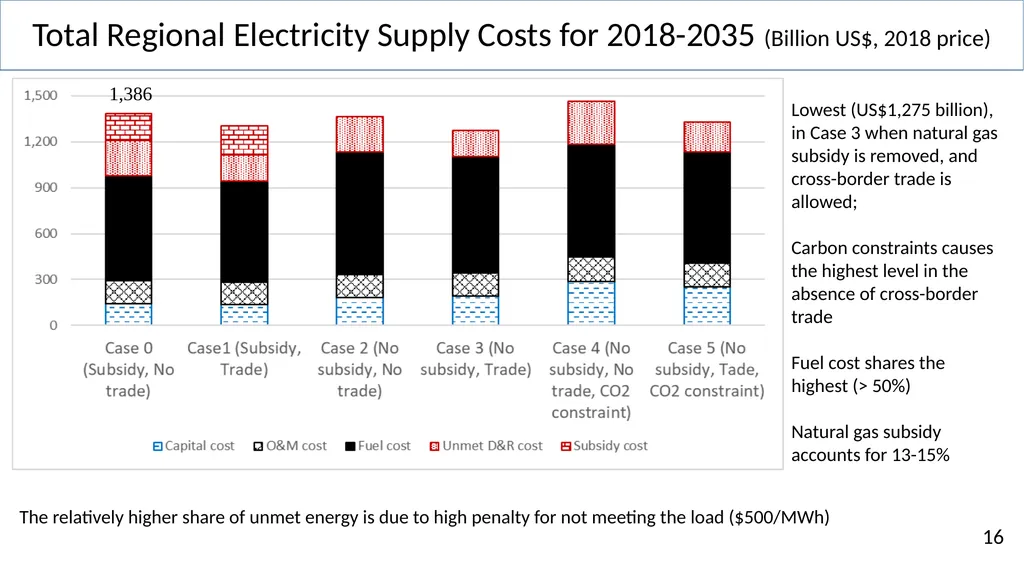
Total Regional Electricity Supply Costs for 2018-2035 (Billion US$, 2018 price) 16 Lowest (US$1,275 billion), in Case 3 when natural gas subsidy is removed, and cross-border trade is allowed;
Carbon constraints causes the highest level in the absence of cross-border trade
Fuel cost shares the highest (> 50%)
Natural gas subsidy accounts for 13-15% 1,386 The relatively higher share of unmet energy is due to high penalty for not meeting the load ($500/MWh)<br>
Carbon constraints causes the highest level in the absence of cross-border trade
Fuel cost shares the highest (> 50%)
Natural gas subsidy accounts for 13-15% 1,386 The relatively higher share of unmet energy is due to high penalty for not meeting the load ($500/MWh)<br>
17
Impacts on Electricity Supply Costs (%) 17 Regional trade benefits the highest (9.2% or US$135 billion cost savings) under carbon constraint case
The cost savings due to subsidy removal and cross-border trade would be US$111.13 billion (i.e., 8% ) in the absence of carbon constraints<br>
The cost savings due to subsidy removal and cross-border trade would be US$111.13 billion (i.e., 8% ) in the absence of carbon constraints<br>
18
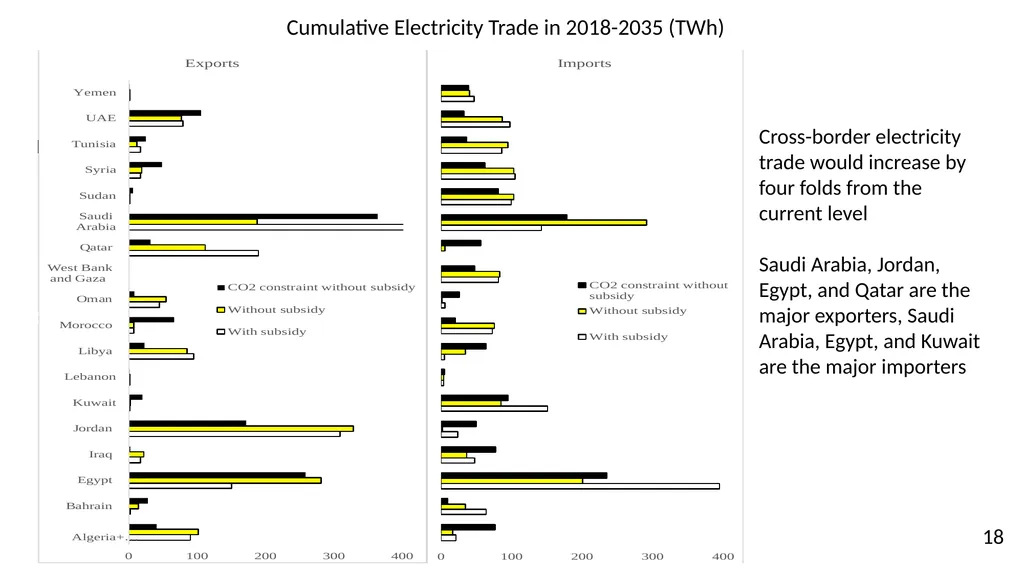
18 Cumulative Electricity Trade in 2018-2035 (TWh) Cross-border electricity trade would increase by four folds from the current level
Saudi Arabia, Jordan, Egypt, and Qatar are the major exporters, Saudi Arabia, Egypt, and Kuwait are the major importers<br>
Saudi Arabia, Jordan, Egypt, and Qatar are the major exporters, Saudi Arabia, Egypt, and Kuwait are the major importers<br>
19
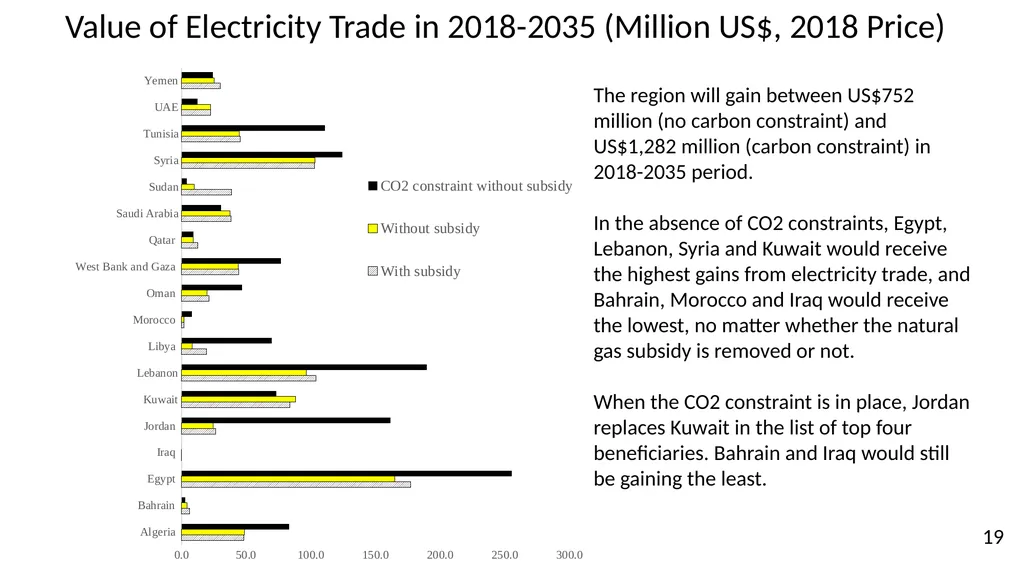
19 Value of Electricity Trade in 2018-2035 (Million US$, 2018 Price) The region will gain between US$752 million (no carbon constraint) and US$1,282 million (carbon constraint) in 2018-2035 period.
In the absence of CO2 constraints, Egypt, Lebanon, Syria and Kuwait would receive the highest gains from electricity trade, and Bahrain, Morocco and Iraq would receive the lowest, no matter whether the natural gas subsidy is removed or not.
When the CO2 constraint is in place, Jordan replaces Kuwait in the list of top four beneficiaries. Bahrain and Iraq would still be gaining the least.<br>
In the absence of CO2 constraints, Egypt, Lebanon, Syria and Kuwait would receive the highest gains from electricity trade, and Bahrain, Morocco and Iraq would receive the lowest, no matter whether the natural gas subsidy is removed or not.
When the CO2 constraint is in place, Jordan replaces Kuwait in the list of top four beneficiaries. Bahrain and Iraq would still be gaining the least.<br>
20
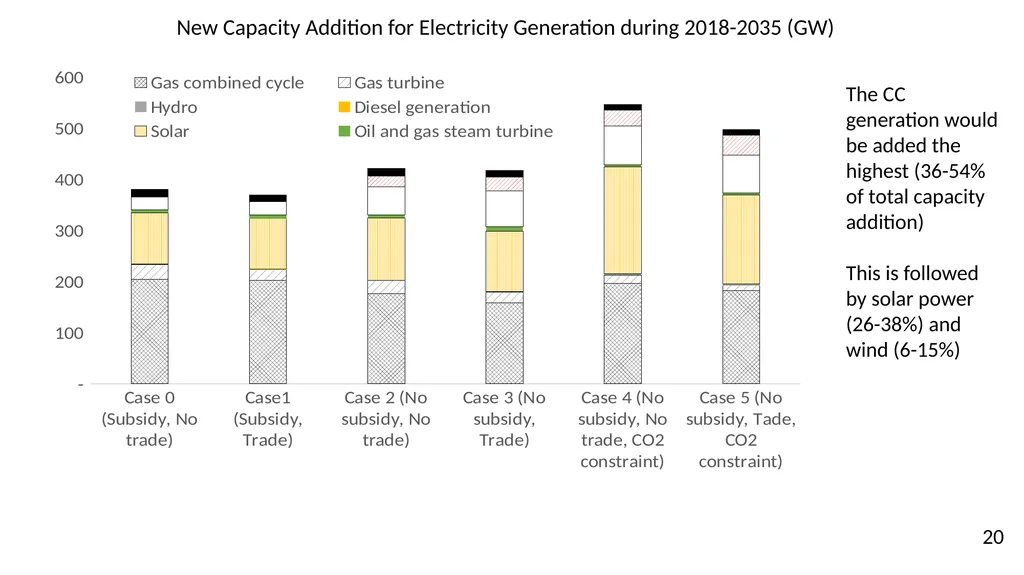
20 New Capacity Addition for Electricity Generation during 2018-2035 (GW) The CC generation would be added the highest (36-54% of total capacity addition)
This is followed by solar power (26-38%) and wind (6-15%)<br>
This is followed by solar power (26-38%) and wind (6-15%)<br>
21
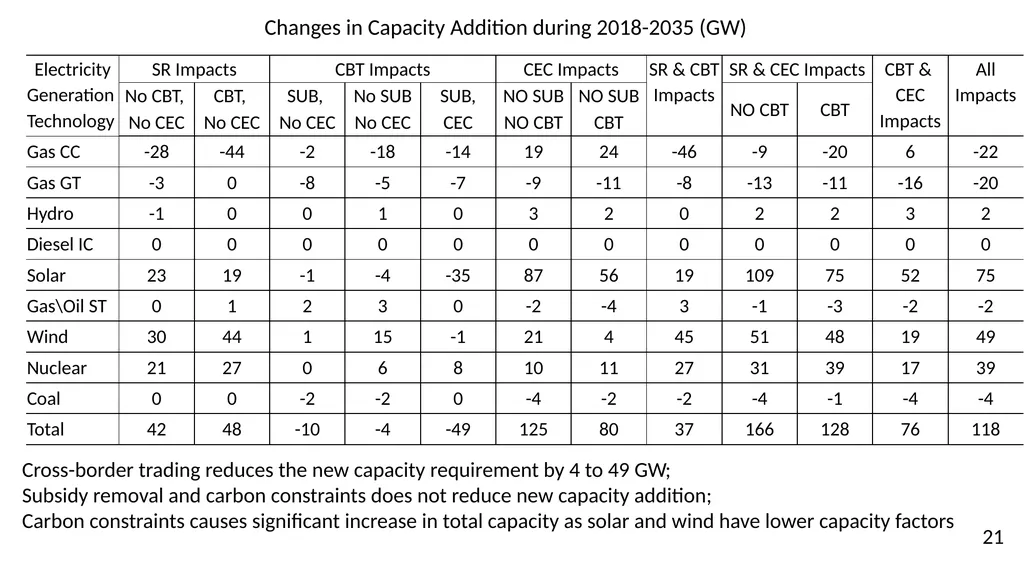
21 Changes in Capacity Addition during 2018-2035 (GW) Cross-border trading reduces the new capacity requirement by 4 to 49 GW;
Subsidy removal and carbon constraints does not reduce new capacity addition;
Carbon constraints causes significant increase in total capacity as solar and wind have lower capacity factors<br>
Subsidy removal and carbon constraints does not reduce new capacity addition;
Carbon constraints causes significant increase in total capacity as solar and wind have lower capacity factors<br>
22
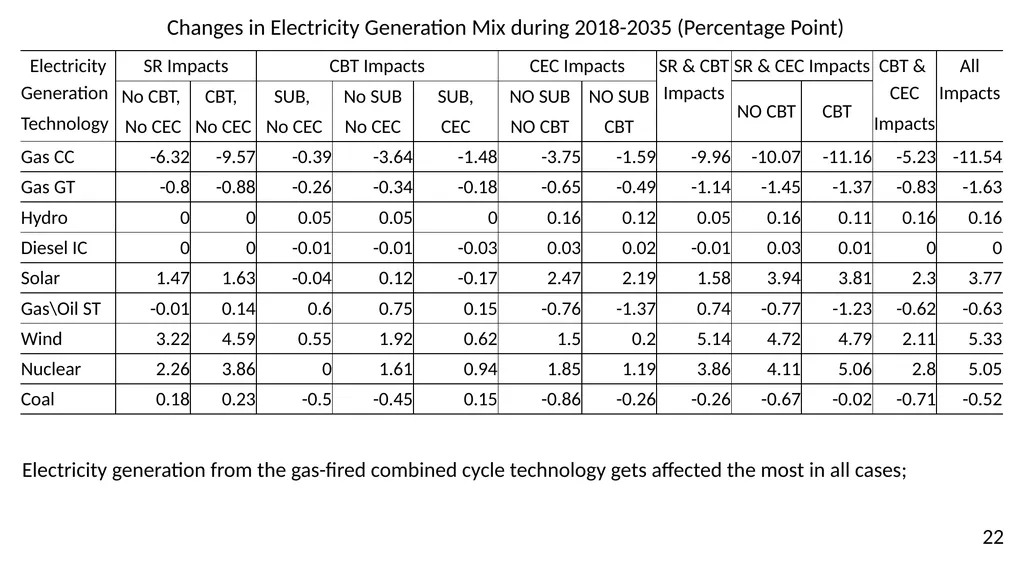
22 Changes in Electricity Generation Mix during 2018-2035 (Percentage Point) Electricity generation from the gas-fired combined cycle technology gets affected the most in all cases;<br>
23
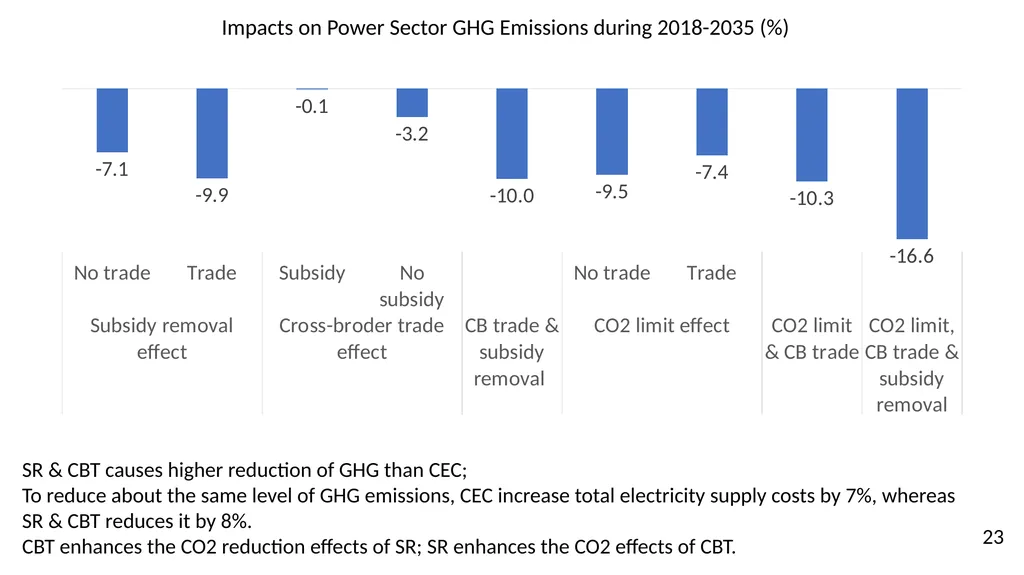
23 Impacts on Power Sector GHG Emissions during 2018-2035 (%) SR & CBT causes higher reduction of GHG than CEC;
To reduce about the same level of GHG emissions, CEC increase total electricity supply costs by 7%, whereas SR & CBT reduces it by 8%.
CBT enhances the CO2 reduction effects of SR; SR enhances the CO2 effects of CBT.<br>
To reduce about the same level of GHG emissions, CEC increase total electricity supply costs by 7%, whereas SR & CBT reduces it by 8%.
CBT enhances the CO2 reduction effects of SR; SR enhances the CO2 effects of CBT.<br>
24
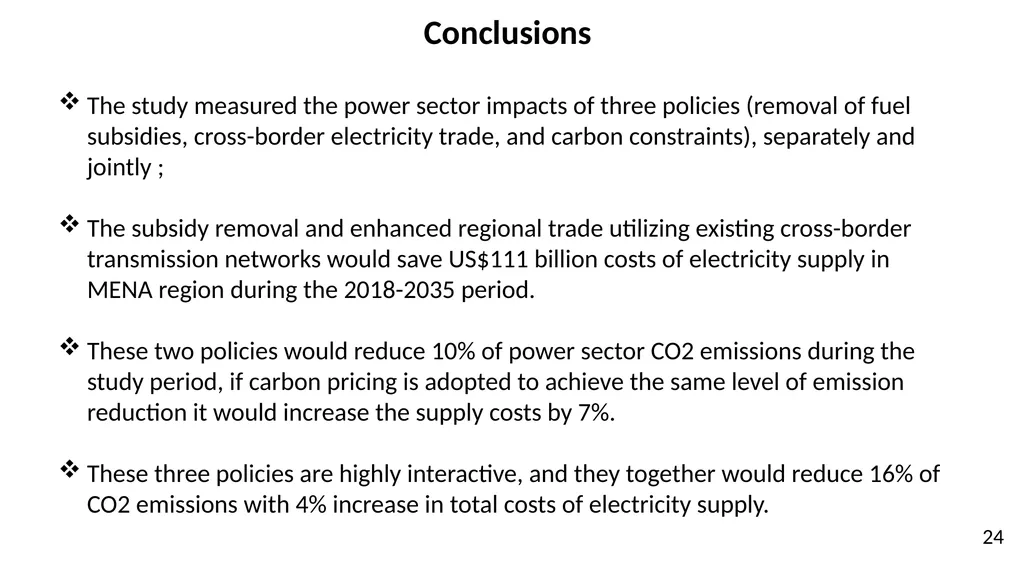
Conclusions The study measured the power sector impacts of three policies (removal of fuel subsidies, cross-border electricity trade, and carbon constraints), separately and jointly ;
The subsidy removal and enhanced regional trade utilizing existing cross-border transmission networks would save US$111 billion costs of electricity supply in MENA region during the 2018-2035 period.
These two policies would reduce 10% of power sector CO2 emissions during the study period, if carbon pricing is adopted to achieve the same level of emission reduction it would increase the supply costs by 7%.
These three policies are highly interactive, and they together would reduce 16% of CO2 emissions with 4% increase in total costs of electricity supply. 24<br>
The subsidy removal and enhanced regional trade utilizing existing cross-border transmission networks would save US$111 billion costs of electricity supply in MENA region during the 2018-2035 period.
These two policies would reduce 10% of power sector CO2 emissions during the study period, if carbon pricing is adopted to achieve the same level of emission reduction it would increase the supply costs by 7%.
These three policies are highly interactive, and they together would reduce 16% of CO2 emissions with 4% increase in total costs of electricity supply. 24<br>
25
Supplemental Slides 25<br>
26
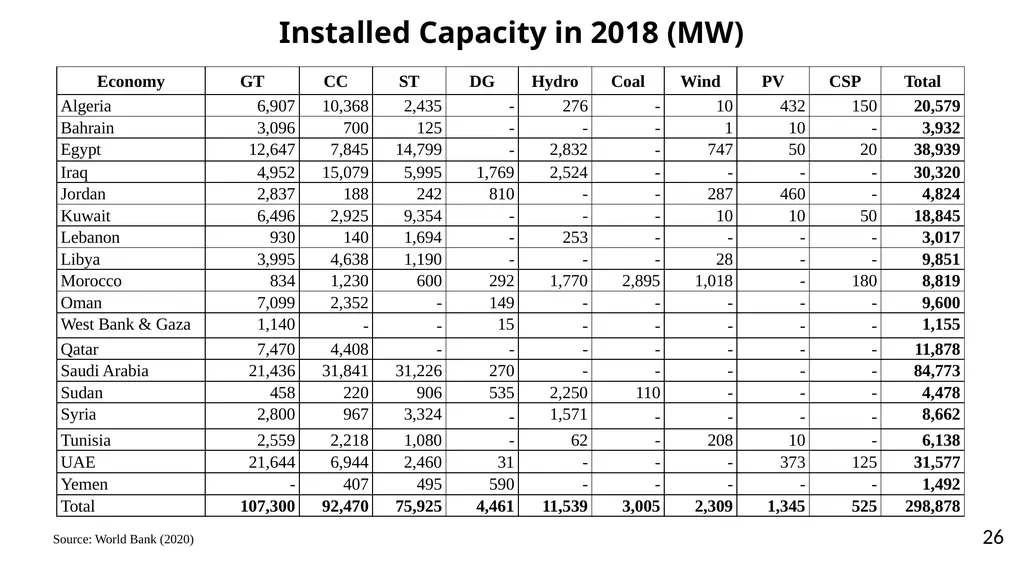
Installed Capacity in 2018 (MW) 26 Source: World Bank (2020)<br>
27
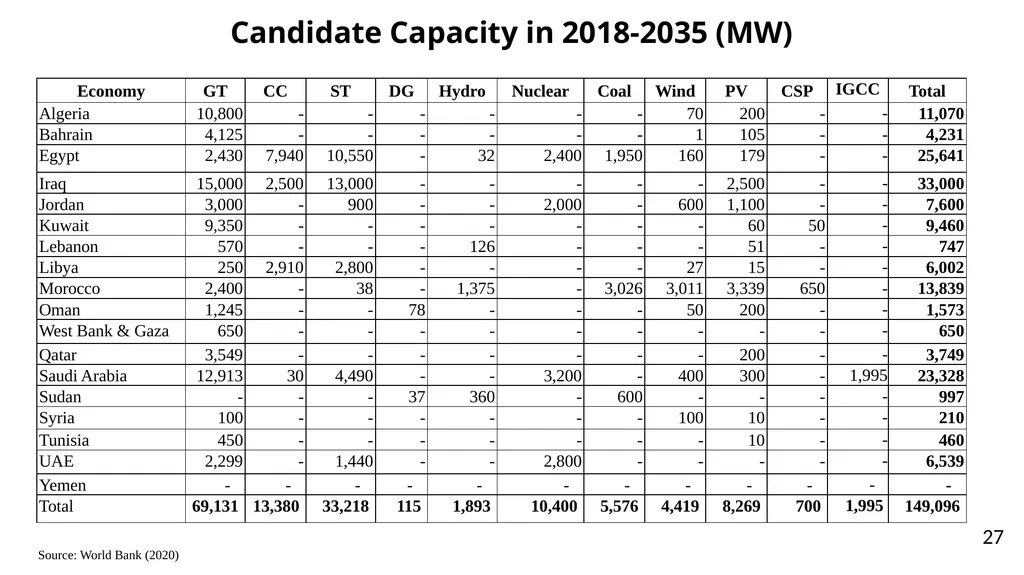
Candidate Capacity in 2018-2035 (MW) 27 Source: World Bank (2020)<br>
28
Peak load and energy demand forecasts (Annual Average, %) 28 Source: Energy ministries, national electricity utilities and the Arab Forum for Environment and Development (AFED)<br>
29
Costs and heat rate data 29 Source: KFUPM, 2011, World Bank (2009); IEA (2014)<br>
30
Non-subsidized fuel prices (US$/MMBTU) 30 Source: World Bank (2016a) for coal and crude oil; USEIA (2018) for petroleum<br>
31
Local (subsidized) natural gas prices (US$/MMBTU) 31 Source: World Bank (2020)<br>
32
Existing and planned cross-border transmission interconnections (MW) Source: World Bank (2020)<br>