
Smart Vulnerability Assessment for OS/VM, GitHub,
TD
Published · 48 slides · 0 views
1 / 1
Description
Smart Vulnerability Assessment for OSVM, GitHub, IoT: An Overview Steven Ullman, Ben Lazarine, Izhar Sajid, Sagar Samtani, and Mark Patton University of Arizona, Indiana University 1 Agenda Introduction and Motivation Previous AI Lab
Related Topics
Share
Embed code
Download this presentation From Below
"Smart Vulnerability Assessment for OS/VM, GitHub," is the property of its rightful owner. Permission is granted to download and print the materials on this website for personal, non-commercial use only, and to display it on your personal computer provided you do not modify the materials and that you retain all copyright notices contained in the materials. By downloading content from our website, you accept the terms of this agreement.
Presentation Transcript
01
Smart Vulnerability Assessment for OS/VM, GitHub, IoT: An Overview Steven Ullman, Ben Lazarine, Izhar Sajid, Sagar Samtani, and Mark Patton
University of Arizona, Indiana University 1<br>
University of Arizona, Indiana University 1<br>
02
Agenda Introduction and Motivation
Previous AI Lab Vulnerability Assessment/IoT Work
Current AI Lab Vulnerability Assessment/IoT Work
Module 1: OS/VM Image Vulnerability Assessment
Module 2: GitHub Vulnerability Assessment
Module 3: IoT Device Vulnerability Assessment
Summary
Future Directions
Question and Answer 2<br>
Previous AI Lab Vulnerability Assessment/IoT Work
Current AI Lab Vulnerability Assessment/IoT Work
Module 1: OS/VM Image Vulnerability Assessment
Module 2: GitHub Vulnerability Assessment
Module 3: IoT Device Vulnerability Assessment
Summary
Future Directions
Question and Answer 2<br>
03
Introduction The internet enables efficient and effective communication between devices worldwide.
Approximately 7 billion IoT devices are connected as of 2018
However, many devices are vulnerable to devastating cyber-attacks.
Assessing the vulnerabilities of all internet connected devices in an automated, scalable manner can help prevent future cyber-attacks.
The vast amounts of various data sources and types show promise in applying AI-based techniques to enhance these assessments. 3<br>
Approximately 7 billion IoT devices are connected as of 2018
However, many devices are vulnerable to devastating cyber-attacks.
Assessing the vulnerabilities of all internet connected devices in an automated, scalable manner can help prevent future cyber-attacks.
The vast amounts of various data sources and types show promise in applying AI-based techniques to enhance these assessments. 3<br>
04
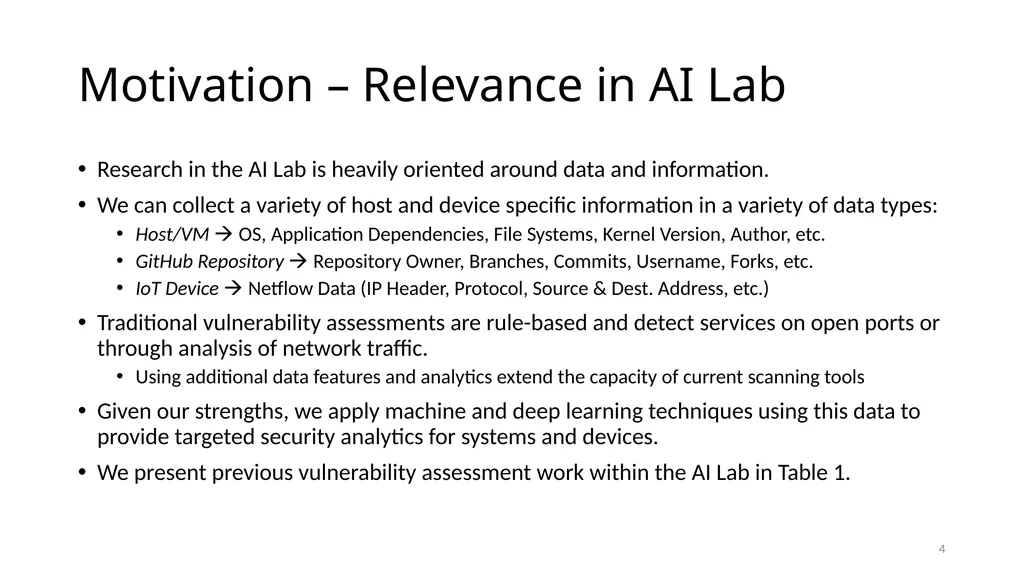
Motivation – Relevance in AI Lab Research in the AI Lab is heavily oriented around data and information.
We can collect a variety of host and device specific information in a variety of data types:
Host/VM OS, Application Dependencies, File Systems, Kernel Version, Author, etc.
GitHub Repository Repository Owner, Branches, Commits, Username, Forks, etc.
IoT Device Netflow Data (IP Header, Protocol, Source & Dest. Address, etc.)
Traditional vulnerability assessments are rule-based and detect services on open ports or through analysis of network traffic.
Using additional data features and analytics extend the capacity of current scanning tools
Given our strengths, we apply machine and deep learning techniques using this data to provide targeted security analytics for systems and devices.
We present previous vulnerability assessment work within the AI Lab in Table 1. 4<br>
We can collect a variety of host and device specific information in a variety of data types:
Host/VM OS, Application Dependencies, File Systems, Kernel Version, Author, etc.
GitHub Repository Repository Owner, Branches, Commits, Username, Forks, etc.
IoT Device Netflow Data (IP Header, Protocol, Source & Dest. Address, etc.)
Traditional vulnerability assessments are rule-based and detect services on open ports or through analysis of network traffic.
Using additional data features and analytics extend the capacity of current scanning tools
Given our strengths, we apply machine and deep learning techniques using this data to provide targeted security analytics for systems and devices.
We present previous vulnerability assessment work within the AI Lab in Table 1. 4<br>
05
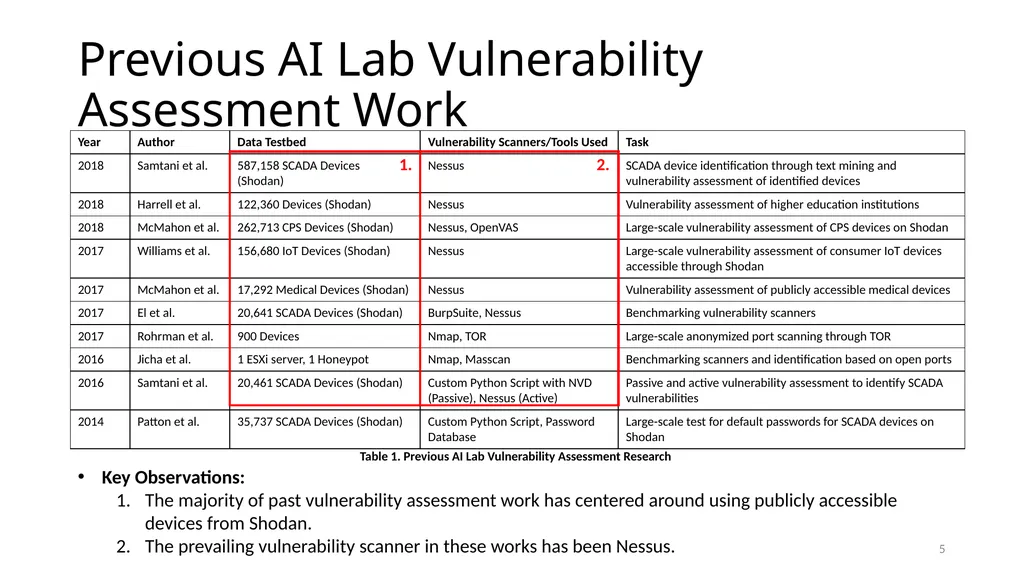
Previous AI Lab Vulnerability Assessment Work Table 1. Previous AI Lab Vulnerability Assessment Research Key Observations:
The majority of past vulnerability assessment work has centered around using publicly accessible devices from Shodan.
The prevailing vulnerability scanner in these works has been Nessus. 1. 2. 5<br>
The majority of past vulnerability assessment work has centered around using publicly accessible devices from Shodan.
The prevailing vulnerability scanner in these works has been Nessus. 1. 2. 5<br>
06
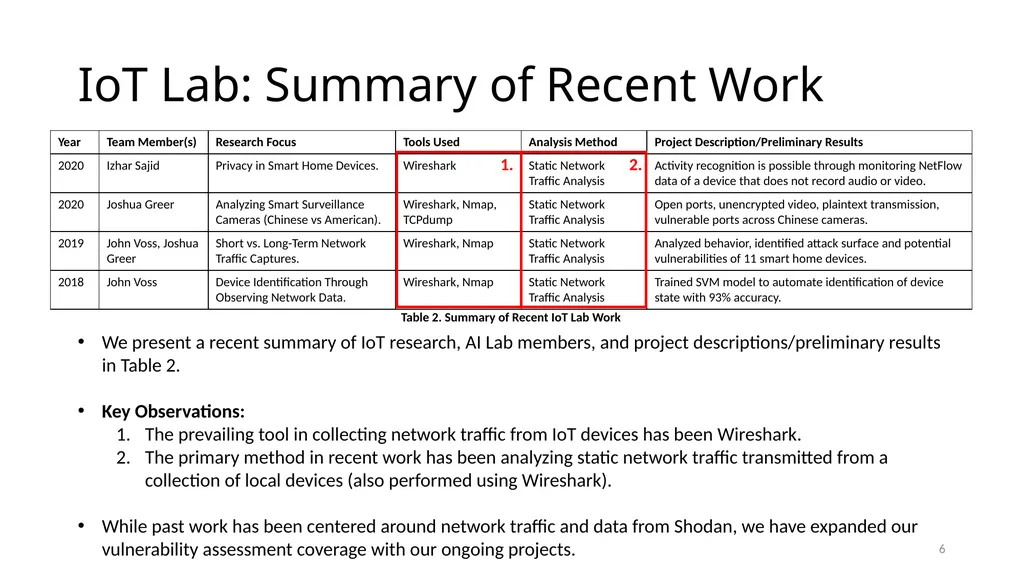
IoT Lab: Summary of Recent Work Table 2. Summary of Recent IoT Lab Work We present a recent summary of IoT research, AI Lab members, and project descriptions/preliminary results in Table 2.
Key Observations:
The prevailing tool in collecting network traffic from IoT devices has been Wireshark.
The primary method in recent work has been analyzing static network traffic transmitted from a collection of local devices (also performed using Wireshark).
While past work has been centered around network traffic and data from Shodan, we have expanded our vulnerability assessment coverage with our ongoing projects. 6 1. 2.<br>
Key Observations:
The prevailing tool in collecting network traffic from IoT devices has been Wireshark.
The primary method in recent work has been analyzing static network traffic transmitted from a collection of local devices (also performed using Wireshark).
While past work has been centered around network traffic and data from Shodan, we have expanded our vulnerability assessment coverage with our ongoing projects. 6 1. 2.<br>
07
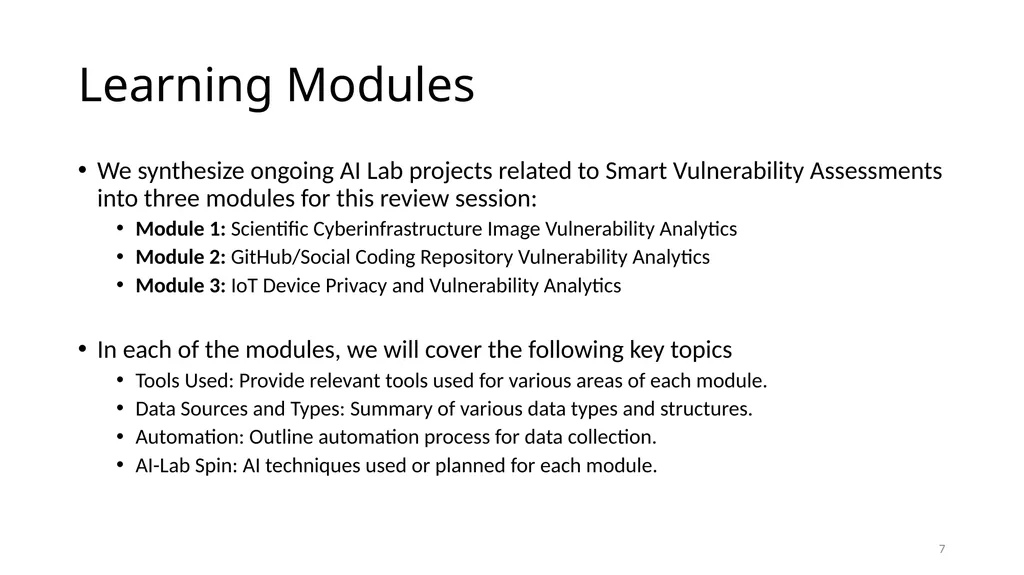
Learning Modules We synthesize ongoing AI Lab projects related to Smart Vulnerability Assessments into three modules for this review session:
Module 1: Scientific Cyberinfrastructure Image Vulnerability Analytics
Module 2: GitHub/Social Coding Repository Vulnerability Analytics
Module 3: IoT Device Privacy and Vulnerability Analytics
In each of the modules, we will cover the following key topics
Tools Used: Provide relevant tools used for various areas of each module.
Data Sources and Types: Summary of various data types and structures.
Automation: Outline automation process for data collection.
AI-Lab Spin: AI techniques used or planned for each module. 7<br>
Module 1: Scientific Cyberinfrastructure Image Vulnerability Analytics
Module 2: GitHub/Social Coding Repository Vulnerability Analytics
Module 3: IoT Device Privacy and Vulnerability Analytics
In each of the modules, we will cover the following key topics
Tools Used: Provide relevant tools used for various areas of each module.
Data Sources and Types: Summary of various data types and structures.
Automation: Outline automation process for data collection.
AI-Lab Spin: AI techniques used or planned for each module. 7<br>
08
Module 1: OS/VM Image Vulnerability Assessment By Steven Ullman 8<br>
09
OS/VM Image: Agenda and Learning Goals We introduce scientific cyberinfrastructure platforms and the general user-workflow.
CyVerse Atmosphere, custom VM image templates
Learning outcome: Students will understand the environment and landscape for conducting scientific research.
We outline the data collection methodology and various system-related information and data that is available.
Learning outcome: Students see a template for a systematic collection process and selection of identifiable and host-relevant information.
We provide a systematic process for automating data collection.
Learning outcome: Students will understand the procedure for developing an automated data collection process. 9<br>
CyVerse Atmosphere, custom VM image templates
Learning outcome: Students will understand the environment and landscape for conducting scientific research.
We outline the data collection methodology and various system-related information and data that is available.
Learning outcome: Students see a template for a systematic collection process and selection of identifiable and host-relevant information.
We provide a systematic process for automating data collection.
Learning outcome: Students will understand the procedure for developing an automated data collection process. 9<br>
10
Introduction and Motivation Scientific cyberinfrastructure enables users to launch virtual machines (i.e., images) to execute various scientific processes (e.g., black hole imaging).
Users often install open source (e.g., GitHub) apps and manipulate file systems (e.g., write) to help support their desired analytics.
Often introduces vulnerabilities undetectable by conventional scanners (e.g., Nessus).
Exploiting these vulnerabilities can potentially disrupt high-impact scientific workflows. Therefore, this research aims to identify:
Apps, their relationships (i.e., dependencies), and vulnerabilities within images
File system structure changes within images
How changes to the apps, vulnerabilities, and file systems vary across images 10<br>
Users often install open source (e.g., GitHub) apps and manipulate file systems (e.g., write) to help support their desired analytics.
Often introduces vulnerabilities undetectable by conventional scanners (e.g., Nessus).
Exploiting these vulnerabilities can potentially disrupt high-impact scientific workflows. Therefore, this research aims to identify:
Apps, their relationships (i.e., dependencies), and vulnerabilities within images
File system structure changes within images
How changes to the apps, vulnerabilities, and file systems vary across images 10<br>
11
Public, user-developed images are hosted as templates for other users to launch for computational analysis.
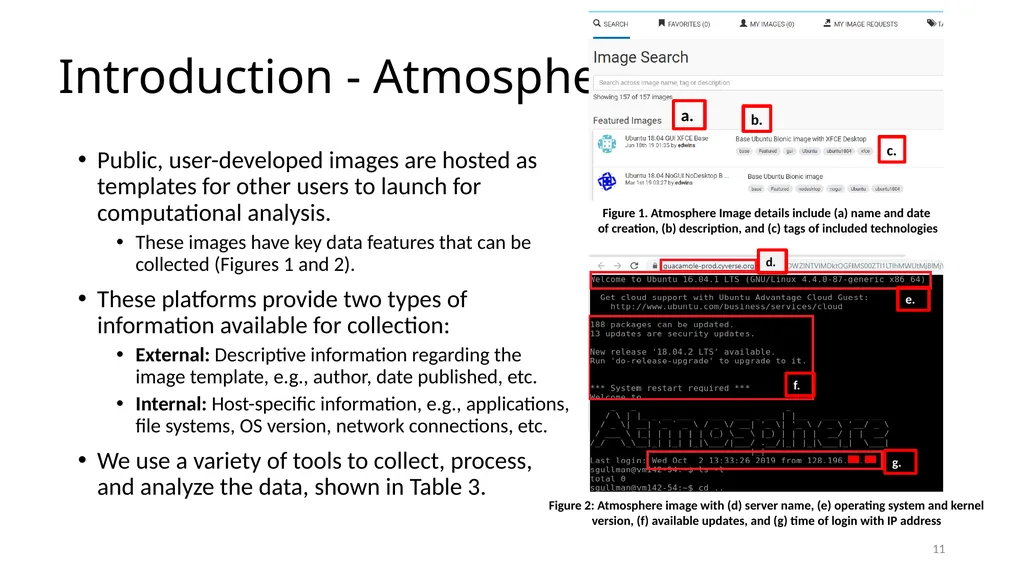
These images have key data features that can be collected (Figures 1 and 2).
These platforms provide two types of information available for collection:
External: Descriptive information regarding the image template, e.g., author, date published, etc.
Internal: Host-specific information, e.g., applications, file systems, OS version, network connections, etc.
We use a variety of tools to collect, process, and analyze the data, shown in Table 3. Introduction - Atmosphere 11 d. e. f. Figure 2: Atmosphere image with (d) server name, (e) operating system and kernel version, (f) available updates, and (g) time of login with IP address g. a. b. c. Figure 1. Atmosphere Image details include (a) name and date
of creation, (b) description, and (c) tags of included technologies<br>
These images have key data features that can be collected (Figures 1 and 2).
These platforms provide two types of information available for collection:
External: Descriptive information regarding the image template, e.g., author, date published, etc.
Internal: Host-specific information, e.g., applications, file systems, OS version, network connections, etc.
We use a variety of tools to collect, process, and analyze the data, shown in Table 3. Introduction - Atmosphere 11 d. e. f. Figure 2: Atmosphere image with (d) server name, (e) operating system and kernel version, (f) available updates, and (g) time of login with IP address g. a. b. c. Figure 1. Atmosphere Image details include (a) name and date
of creation, (b) description, and (c) tags of included technologies<br>
12
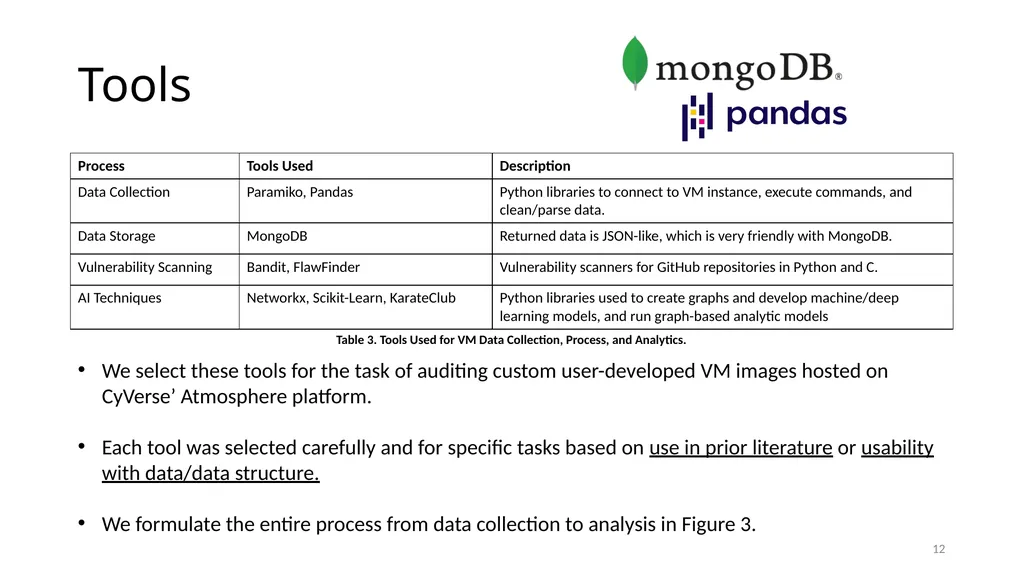
Tools 12 Table 3. Tools Used for VM Data Collection, Process, and Analytics. We select these tools for the task of auditing custom user-developed VM images hosted on CyVerse’ Atmosphere platform.
Each tool was selected carefully and for specific tasks based on use in prior literature or usability with data/data structure.
We formulate the entire process from data collection to analysis in Figure 3.<br>
Each tool was selected carefully and for specific tasks based on use in prior literature or usability with data/data structure.
We formulate the entire process from data collection to analysis in Figure 3.<br>
13
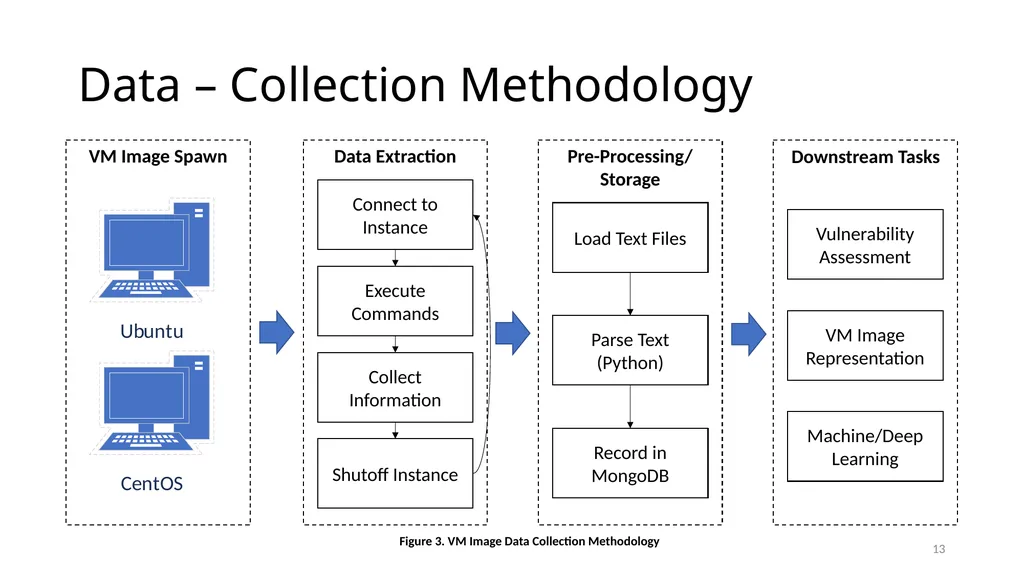
Data – Collection Methodology VM Image Spawn Data Extraction Pre-Processing/ Storage Downstream Tasks Connect to Instance Execute Commands Collect Information Shutoff Instance Figure 3. VM Image Data Collection Methodology Load Text Files Parse Text (Python) Record in MongoDB Vulnerability Assessment VM Image Representation Machine/Deep Learning 13<br>
14
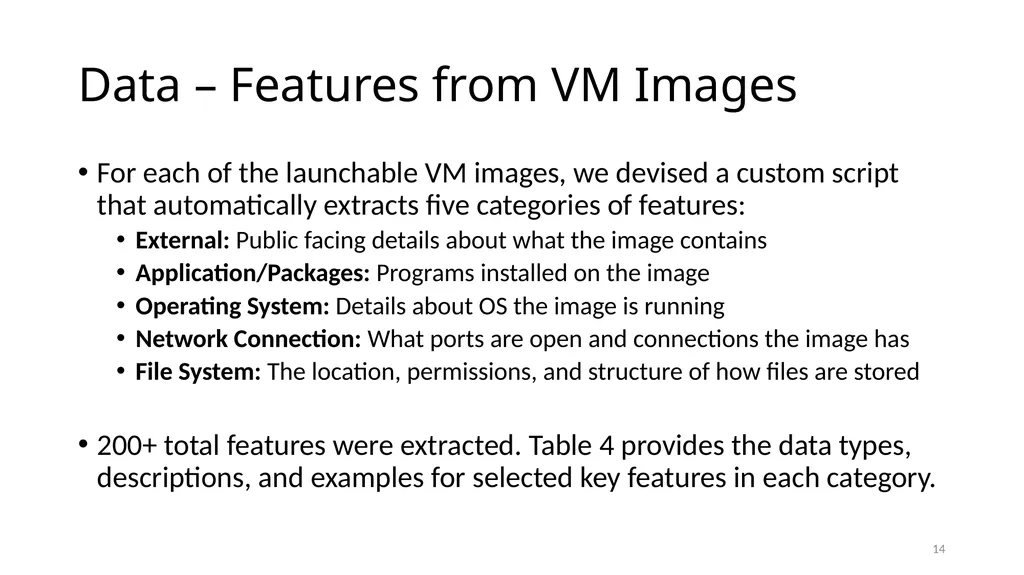
Data – Features from VM Images For each of the launchable VM images, we devised a custom script that automatically extracts five categories of features:
External: Public facing details about what the image contains
Application/Packages: Programs installed on the image
Operating System: Details about OS the image is running
Network Connection: What ports are open and connections the image has
File System: The location, permissions, and structure of how files are stored
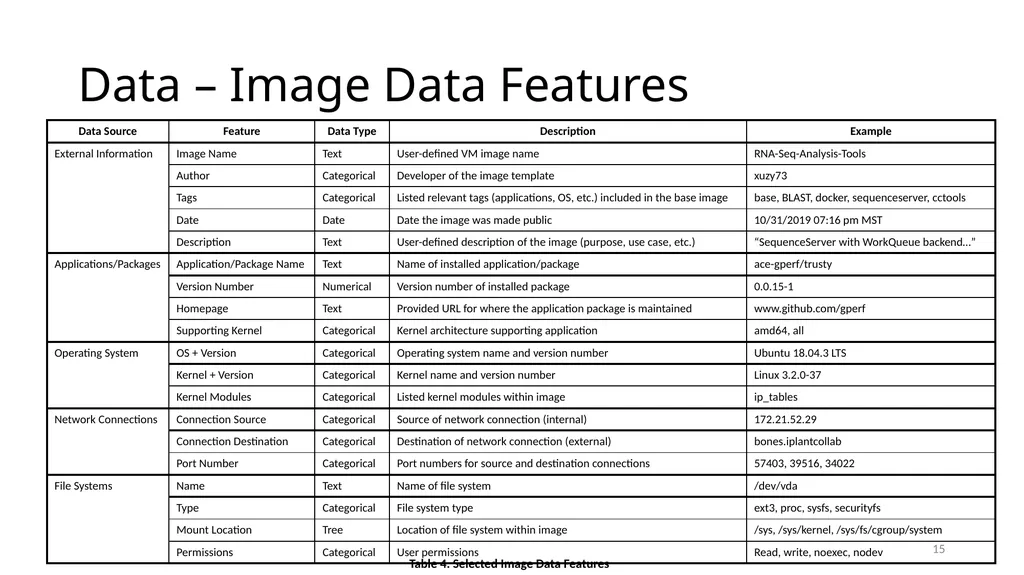
200+ total features were extracted. Table 4 provides the data types, descriptions, and examples for selected key features in each category. 14<br>
External: Public facing details about what the image contains
Application/Packages: Programs installed on the image
Operating System: Details about OS the image is running
Network Connection: What ports are open and connections the image has
File System: The location, permissions, and structure of how files are stored
200+ total features were extracted. Table 4 provides the data types, descriptions, and examples for selected key features in each category. 14<br>
15
Data – Image Data Features 15 Table 4. Selected Image Data Features<br>
16
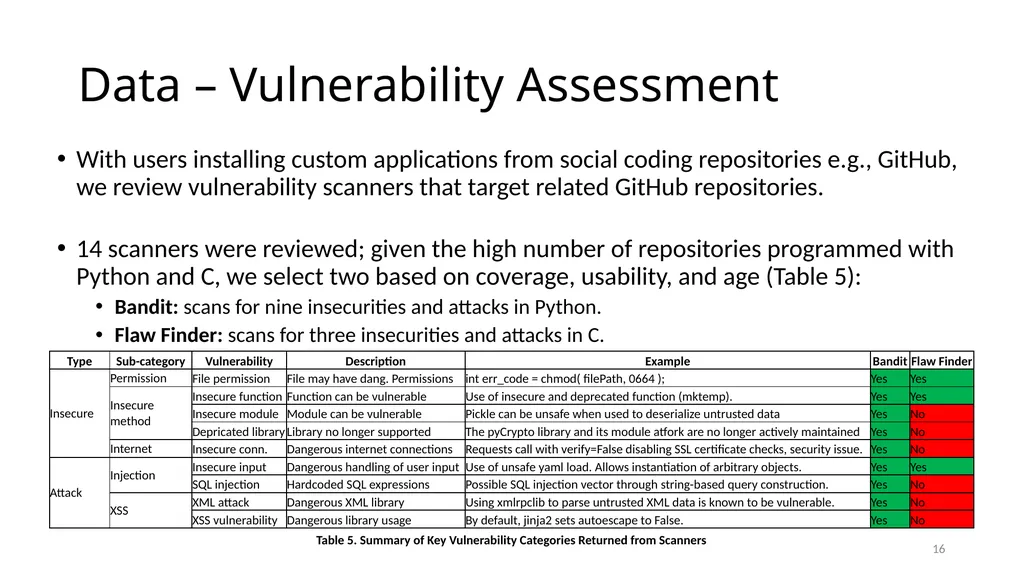
Data – Vulnerability Assessment With users installing custom applications from social coding repositories e.g., GitHub, we review vulnerability scanners that target related GitHub repositories.
14 scanners were reviewed; given the high number of repositories programmed with Python and C, we select two based on coverage, usability, and age (Table 5):
Bandit: scans for nine insecurities and attacks in Python.
Flaw Finder: scans for three insecurities and attacks in C. 16 Table 5. Summary of Key Vulnerability Categories Returned from Scanners<br>
14 scanners were reviewed; given the high number of repositories programmed with Python and C, we select two based on coverage, usability, and age (Table 5):
Bandit: scans for nine insecurities and attacks in Python.
Flaw Finder: scans for three insecurities and attacks in C. 16 Table 5. Summary of Key Vulnerability Categories Returned from Scanners<br>
17
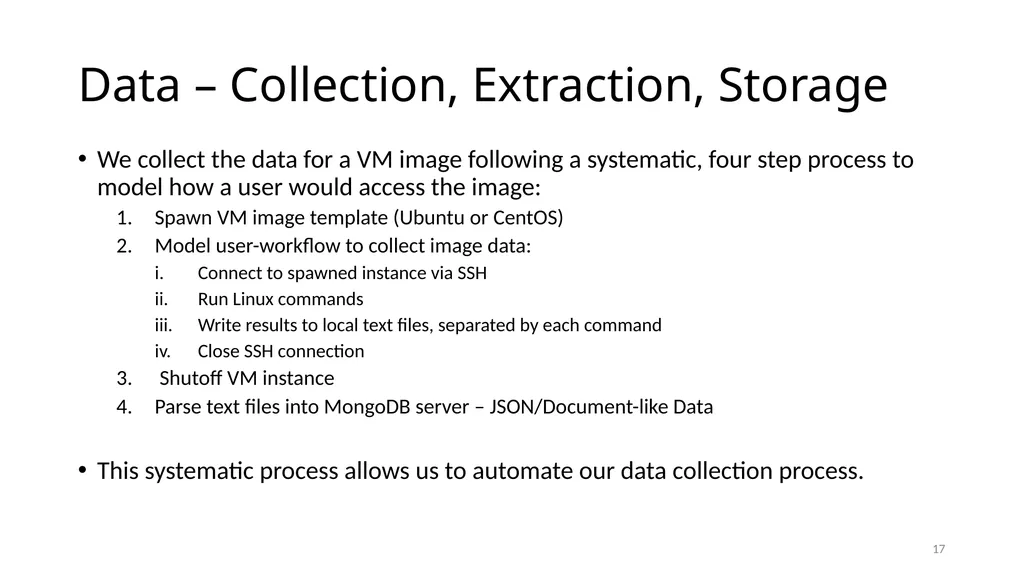
Data – Collection, Extraction, Storage We collect the data for a VM image following a systematic, four step process to model how a user would access the image:
Spawn VM image template (Ubuntu or CentOS)
Model user-workflow to collect image data:
Connect to spawned instance via SSH
Run Linux commands
Write results to local text files, separated by each command
Close SSH connection
Shutoff VM instance
Parse text files into MongoDB server – JSON/Document-like Data
This systematic process allows us to automate our data collection process. 17<br>
Spawn VM image template (Ubuntu or CentOS)
Model user-workflow to collect image data:
Connect to spawned instance via SSH
Run Linux commands
Write results to local text files, separated by each command
Close SSH connection
Shutoff VM instance
Parse text files into MongoDB server – JSON/Document-like Data
This systematic process allows us to automate our data collection process. 17<br>
18
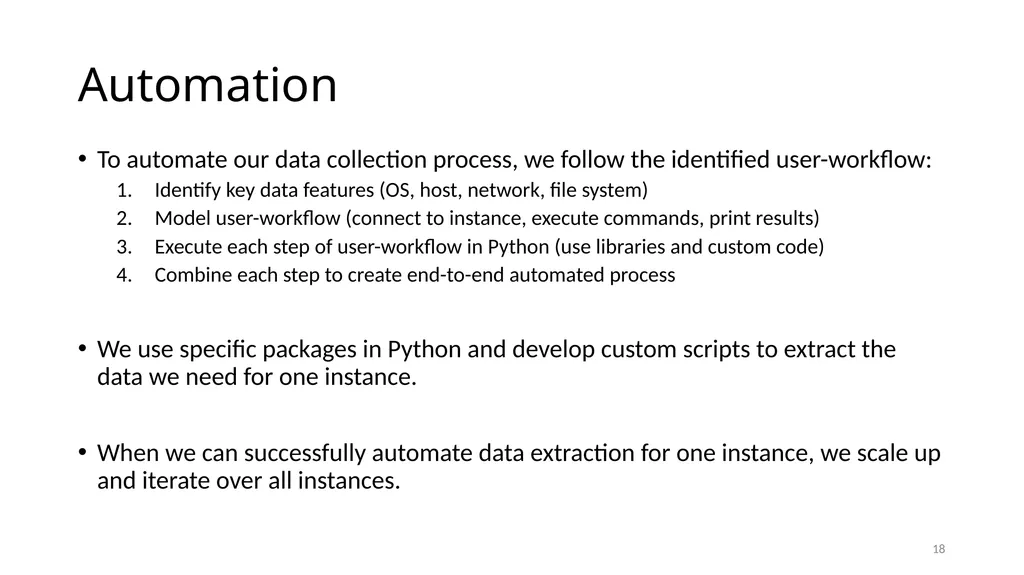
Automation To automate our data collection process, we follow the identified user-workflow:
Identify key data features (OS, host, network, file system)
Model user-workflow (connect to instance, execute commands, print results)
Execute each step of user-workflow in Python (use libraries and custom code)
Combine each step to create end-to-end automated process
We use specific packages in Python and develop custom scripts to extract the data we need for one instance.
When we can successfully automate data extraction for one instance, we scale up and iterate over all instances. 18<br>
Identify key data features (OS, host, network, file system)
Model user-workflow (connect to instance, execute commands, print results)
Execute each step of user-workflow in Python (use libraries and custom code)
Combine each step to create end-to-end automated process
We use specific packages in Python and develop custom scripts to extract the data we need for one instance.
When we can successfully automate data extraction for one instance, we scale up and iterate over all instances. 18<br>
19
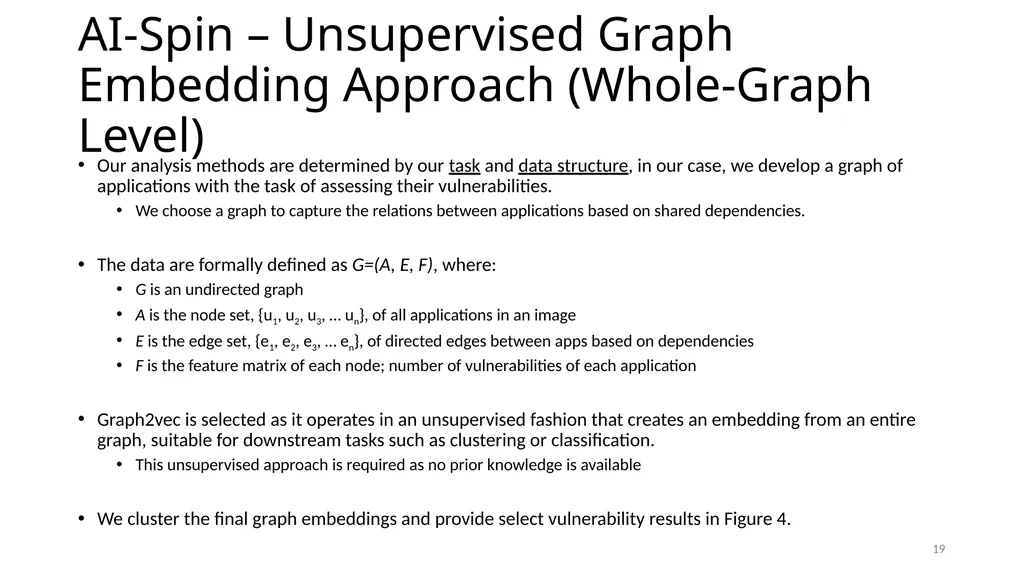
AI-Spin – Unsupervised Graph Embedding Approach (Whole-Graph Level) Our analysis methods are determined by our task and data structure, in our case, we develop a graph of applications with the task of assessing their vulnerabilities.
We choose a graph to capture the relations between applications based on shared dependencies.
The data are formally defined as G=(A, E, F), where:
G is an undirected graph
A is the node set, {u1, u2, u3, … un}, of all applications in an image
E is the edge set, {e1, e2, e3, … en}, of directed edges between apps based on dependencies
F is the feature matrix of each node; number of vulnerabilities of each application
Graph2vec is selected as it operates in an unsupervised fashion that creates an embedding from an entire graph, suitable for downstream tasks such as clustering or classification.
This unsupervised approach is required as no prior knowledge is available
We cluster the final graph embeddings and provide select vulnerability results in Figure 4. 19<br>
We choose a graph to capture the relations between applications based on shared dependencies.
The data are formally defined as G=(A, E, F), where:
G is an undirected graph
A is the node set, {u1, u2, u3, … un}, of all applications in an image
E is the edge set, {e1, e2, e3, … en}, of directed edges between apps based on dependencies
F is the feature matrix of each node; number of vulnerabilities of each application
Graph2vec is selected as it operates in an unsupervised fashion that creates an embedding from an entire graph, suitable for downstream tasks such as clustering or classification.
This unsupervised approach is required as no prior knowledge is available
We cluster the final graph embeddings and provide select vulnerability results in Figure 4. 19<br>
20
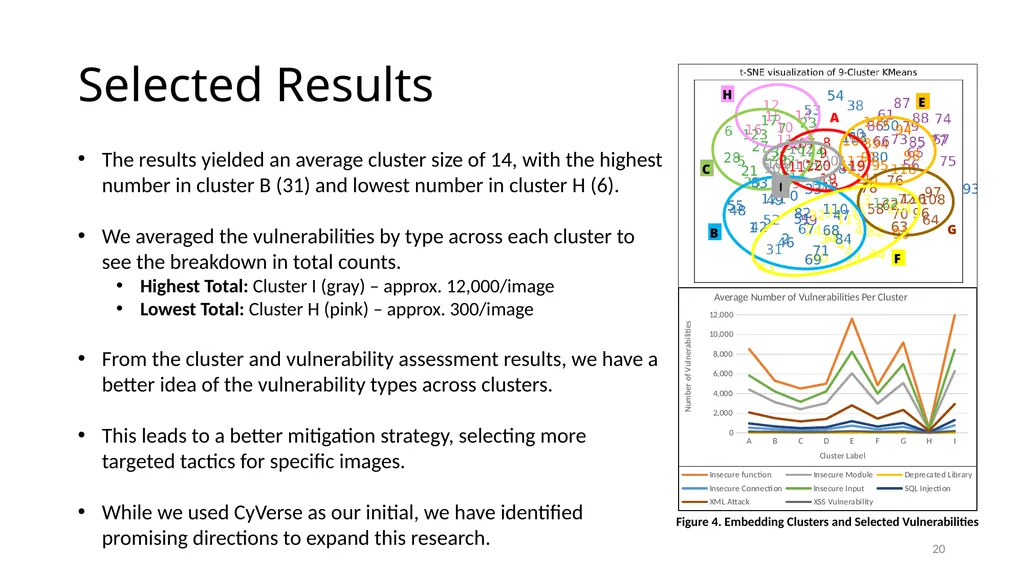
Selected Results 20 The results yielded an average cluster size of 14, with the highest number in cluster B (31) and lowest number in cluster H (6).
We averaged the vulnerabilities by type across each cluster to see the breakdown in total counts.
Highest Total: Cluster I (gray) – approx. 12,000/image
Lowest Total: Cluster H (pink) – approx. 300/image
From the cluster and vulnerability assessment results, we have a better idea of the vulnerability types across clusters.
This leads to a better mitigation strategy, selecting more targeted tactics for specific images.
While we used CyVerse as our initial, we have identified promising directions to expand this research. Figure 4. Embedding Clusters and Selected Vulnerabilities I<br>
We averaged the vulnerabilities by type across each cluster to see the breakdown in total counts.
Highest Total: Cluster I (gray) – approx. 12,000/image
Lowest Total: Cluster H (pink) – approx. 300/image
From the cluster and vulnerability assessment results, we have a better idea of the vulnerability types across clusters.
This leads to a better mitigation strategy, selecting more targeted tactics for specific images.
While we used CyVerse as our initial, we have identified promising directions to expand this research. Figure 4. Embedding Clusters and Selected Vulnerabilities I<br>
21
Future Directions Based on our current work and discussion with our partners, we have identified two promising directions for the future of this work.
Extension to multiple scientific cyberinfrastructure environments.
Jetstream: Indiana University
8,000 users (2,500 active); supports biology, physics, machine learning, and other sciences; funded through 2025 from NSF
**Data collection in process
TACC (Texas Advanced Computing Center): University of Texas
3,000+ projects; supports biosciences, university students, HPC; supports Chameleon Cloud
Chameleon Cloud: University of Chicago
3,000+ users, 500+ projects; supports computer science, AI, ML, SDN; hosted by TACC
Expand to application container technologies.
While VM-based platforms provide significant resources and continued use, application containers have seen widespread adoption for virtualization and scaling of operations. 21<br>
Extension to multiple scientific cyberinfrastructure environments.
Jetstream: Indiana University
8,000 users (2,500 active); supports biology, physics, machine learning, and other sciences; funded through 2025 from NSF
**Data collection in process
TACC (Texas Advanced Computing Center): University of Texas
3,000+ projects; supports biosciences, university students, HPC; supports Chameleon Cloud
Chameleon Cloud: University of Chicago
3,000+ users, 500+ projects; supports computer science, AI, ML, SDN; hosted by TACC
Expand to application container technologies.
While VM-based platforms provide significant resources and continued use, application containers have seen widespread adoption for virtualization and scaling of operations. 21<br>
22
Module 2: GitHub Vulnerability Assessment By Ben Lazarine 22<br>
23
GitHub Vulnerability Assessment: Agenda & Learning Goals We introduce the GitHub platform.
Learning goal: You will know what data is available on GitHub.
We present our AI approach to analyzing GitHub data.
Learning goal: You will learn how to identify what analytical methods different types of data are conducive to.
We demo GitHub data collection.
Learning goal: You will learn how to interface with an API and parse API responses. 23<br>
Learning goal: You will know what data is available on GitHub.
We present our AI approach to analyzing GitHub data.
Learning goal: You will learn how to identify what analytical methods different types of data are conducive to.
We demo GitHub data collection.
Learning goal: You will learn how to interface with an API and parse API responses. 23<br>
24
Introduction GitHub is a social coding repository that is used by a growing number of software developers to share and collaborate on code (Fan, 2019).
36 million users; 100 million repositories; 49 million projects (GitHub, 2019).
While GitHub offers publicly available code to accelerate software development, it also poses potential security risks (Ye, 2019).
CyVerse hosts 84 GitHub repositories with code and documentation of their core infrastructure (e.g., Atmophere, Discovery).
They are unclear on how users are using these repositories, and what vulnerabilities these repositories include.
We outline the tools used in the research for data collection and storage, vulnerability assessment, and analysis in Table 6. 24<br>
36 million users; 100 million repositories; 49 million projects (GitHub, 2019).
While GitHub offers publicly available code to accelerate software development, it also poses potential security risks (Ye, 2019).
CyVerse hosts 84 GitHub repositories with code and documentation of their core infrastructure (e.g., Atmophere, Discovery).
They are unclear on how users are using these repositories, and what vulnerabilities these repositories include.
We outline the tools used in the research for data collection and storage, vulnerability assessment, and analysis in Table 6. 24<br>
25
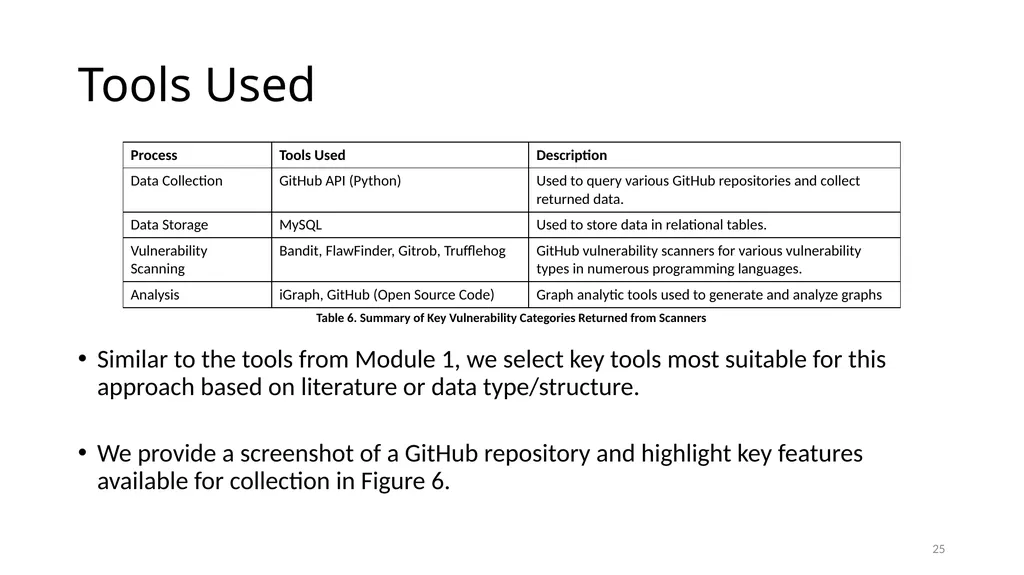
Tools Used Similar to the tools from Module 1, we select key tools most suitable for this approach based on literature or data type/structure.
We provide a screenshot of a GitHub repository and highlight key features available for collection in Figure 6. 25 Table 6. Summary of Key Vulnerability Categories Returned from Scanners<br>
We provide a screenshot of a GitHub repository and highlight key features available for collection in Figure 6. 25 Table 6. Summary of Key Vulnerability Categories Returned from Scanners<br>
26
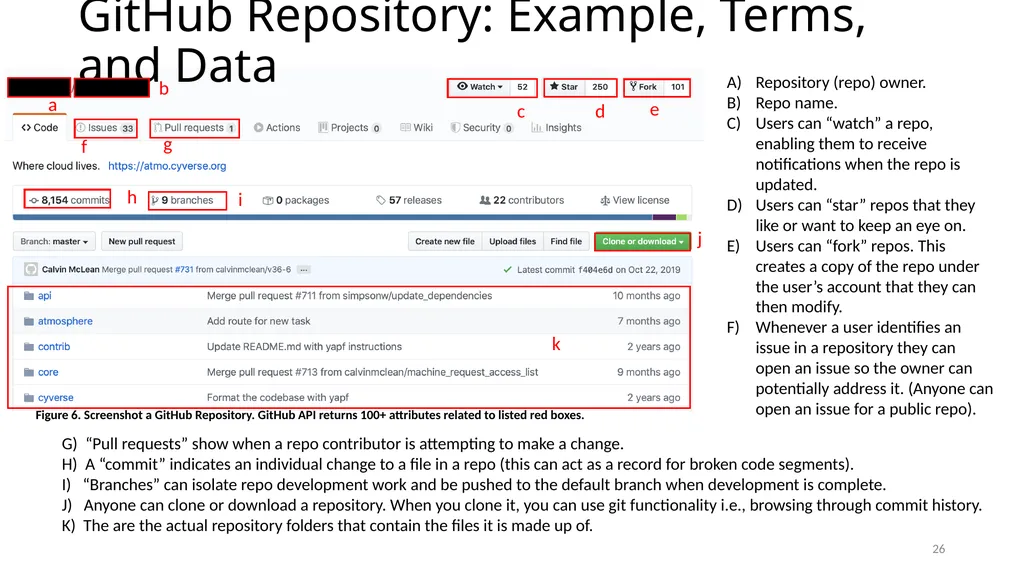
GitHub Repository: Example, Terms, and Data 26 Repository (repo) owner.
Repo name.
Users can “watch” a repo, enabling them to receive notifications when the repo is updated.
Users can “star” repos that they like or want to keep an eye on.
Users can “fork” repos. This creates a copy of the repo under the user’s account that they can then modify.
Whenever a user identifies an issue in a repository they can open an issue so the owner can potentially address it. (Anyone can open an issue for a public repo). a b c d e f g h i j k G) “Pull requests” show when a repo contributor is attempting to make a change.
H) A “commit” indicates an individual change to a file in a repo (this can act as a record for broken code segments).
I) “Branches” can isolate repo development work and be pushed to the default branch when development is complete.
J) Anyone can clone or download a repository. When you clone it, you can use git functionality i.e., browsing through commit history.
K) The are the actual repository folders that contain the files it is made up of. Figure 6. Screenshot a GitHub Repository. GitHub API returns 100+ attributes related to listed red boxes.<br>
Repo name.
Users can “watch” a repo, enabling them to receive notifications when the repo is updated.
Users can “star” repos that they like or want to keep an eye on.
Users can “fork” repos. This creates a copy of the repo under the user’s account that they can then modify.
Whenever a user identifies an issue in a repository they can open an issue so the owner can potentially address it. (Anyone can open an issue for a public repo). a b c d e f g h i j k G) “Pull requests” show when a repo contributor is attempting to make a change.
H) A “commit” indicates an individual change to a file in a repo (this can act as a record for broken code segments).
I) “Branches” can isolate repo development work and be pushed to the default branch when development is complete.
J) Anyone can clone or download a repository. When you clone it, you can use git functionality i.e., browsing through commit history.
K) The are the actual repository folders that contain the files it is made up of. Figure 6. Screenshot a GitHub Repository. GitHub API returns 100+ attributes related to listed red boxes.<br>
27
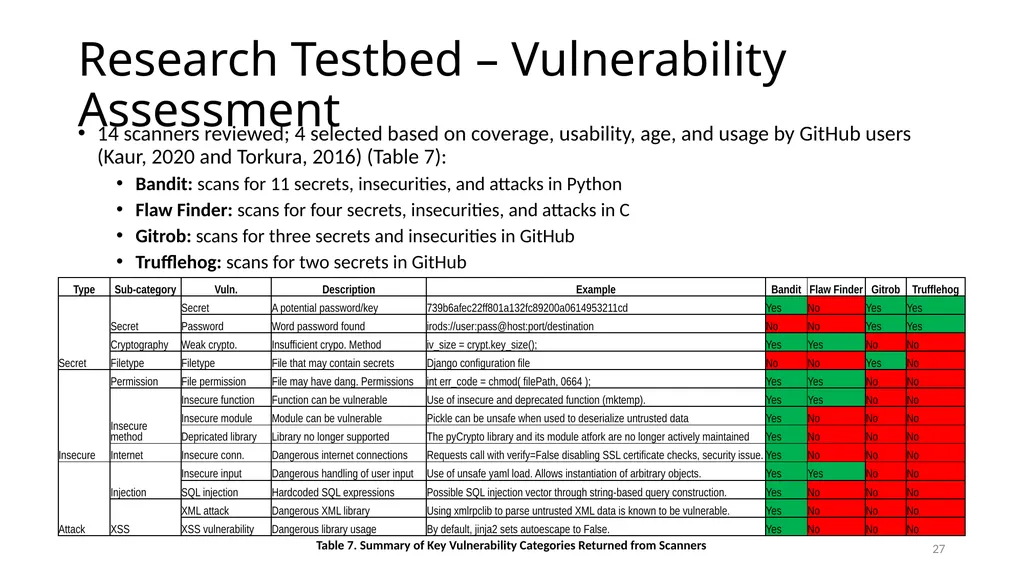
Research Testbed – Vulnerability Assessment 14 scanners reviewed; 4 selected based on coverage, usability, age, and usage by GitHub users (Kaur, 2020 and Torkura, 2016) (Table 7):
Bandit: scans for 11 secrets, insecurities, and attacks in Python
Flaw Finder: scans for four secrets, insecurities, and attacks in C
Gitrob: scans for three secrets and insecurities in GitHub
Trufflehog: scans for two secrets in GitHub Table 7. Summary of Key Vulnerability Categories Returned from Scanners 27<br>
Bandit: scans for 11 secrets, insecurities, and attacks in Python
Flaw Finder: scans for four secrets, insecurities, and attacks in C
Gitrob: scans for three secrets and insecurities in GitHub
Trufflehog: scans for two secrets in GitHub Table 7. Summary of Key Vulnerability Categories Returned from Scanners 27<br>
28
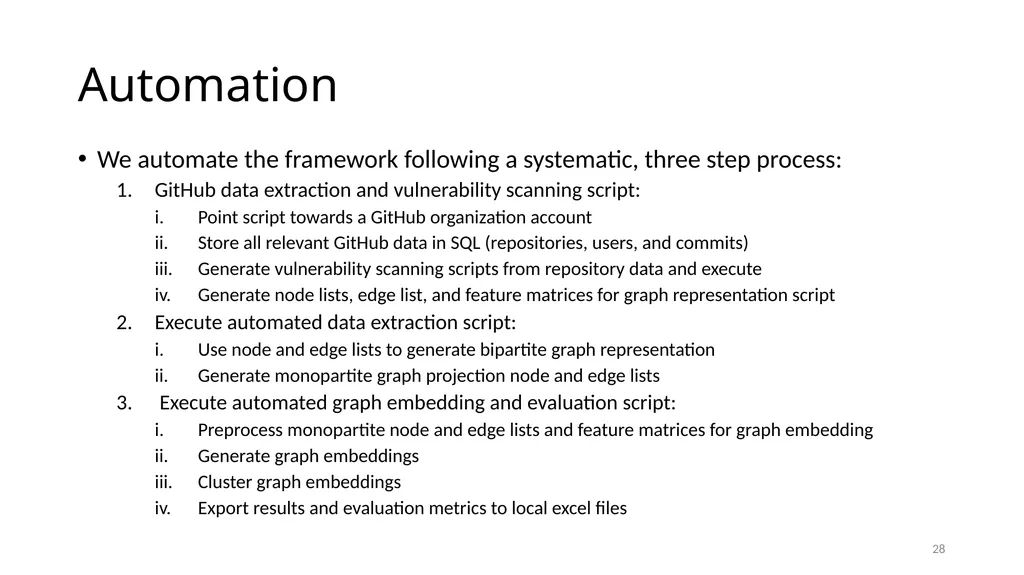
Automation We automate the framework following a systematic, three step process:
GitHub data extraction and vulnerability scanning script:
Point script towards a GitHub organization account
Store all relevant GitHub data in SQL (repositories, users, and commits)
Generate vulnerability scanning scripts from repository data and execute
Generate node lists, edge list, and feature matrices for graph representation script
Execute automated data extraction script:
Use node and edge lists to generate bipartite graph representation
Generate monopartite graph projection node and edge lists
Execute automated graph embedding and evaluation script:
Preprocess monopartite node and edge lists and feature matrices for graph embedding
Generate graph embeddings
Cluster graph embeddings
Export results and evaluation metrics to local excel files 28<br>
GitHub data extraction and vulnerability scanning script:
Point script towards a GitHub organization account
Store all relevant GitHub data in SQL (repositories, users, and commits)
Generate vulnerability scanning scripts from repository data and execute
Generate node lists, edge list, and feature matrices for graph representation script
Execute automated data extraction script:
Use node and edge lists to generate bipartite graph representation
Generate monopartite graph projection node and edge lists
Execute automated graph embedding and evaluation script:
Preprocess monopartite node and edge lists and feature matrices for graph embedding
Generate graph embeddings
Cluster graph embeddings
Export results and evaluation metrics to local excel files 28<br>
29
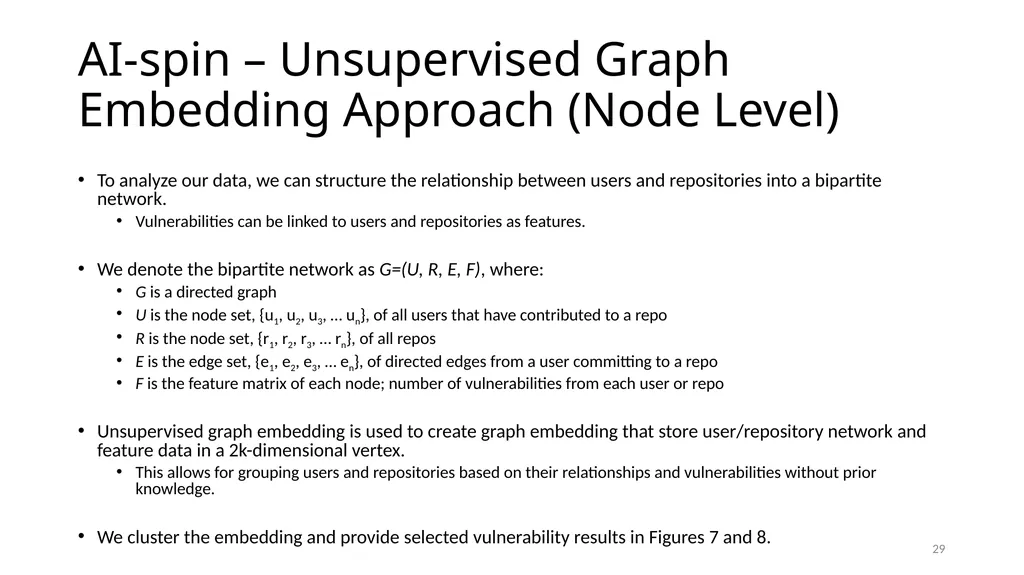
AI-spin – Unsupervised Graph Embedding Approach (Node Level) To analyze our data, we can structure the relationship between users and repositories into a bipartite network.
Vulnerabilities can be linked to users and repositories as features.
We denote the bipartite network as G=(U, R, E, F), where:
G is a directed graph
U is the node set, {u1, u2, u3, … un}, of all users that have contributed to a repo
R is the node set, {r1, r2, r3, … rn}, of all repos
E is the edge set, {e1, e2, e3, … en}, of directed edges from a user committing to a repo
F is the feature matrix of each node; number of vulnerabilities from each user or repo
Unsupervised graph embedding is used to create graph embedding that store user/repository network and feature data in a 2k-dimensional vertex.
This allows for grouping users and repositories based on their relationships and vulnerabilities without prior knowledge.
We cluster the embedding and provide selected vulnerability results in Figures 7 and 8. 29<br>
Vulnerabilities can be linked to users and repositories as features.
We denote the bipartite network as G=(U, R, E, F), where:
G is a directed graph
U is the node set, {u1, u2, u3, … un}, of all users that have contributed to a repo
R is the node set, {r1, r2, r3, … rn}, of all repos
E is the edge set, {e1, e2, e3, … en}, of directed edges from a user committing to a repo
F is the feature matrix of each node; number of vulnerabilities from each user or repo
Unsupervised graph embedding is used to create graph embedding that store user/repository network and feature data in a 2k-dimensional vertex.
This allows for grouping users and repositories based on their relationships and vulnerabilities without prior knowledge.
We cluster the embedding and provide selected vulnerability results in Figures 7 and 8. 29<br>
30
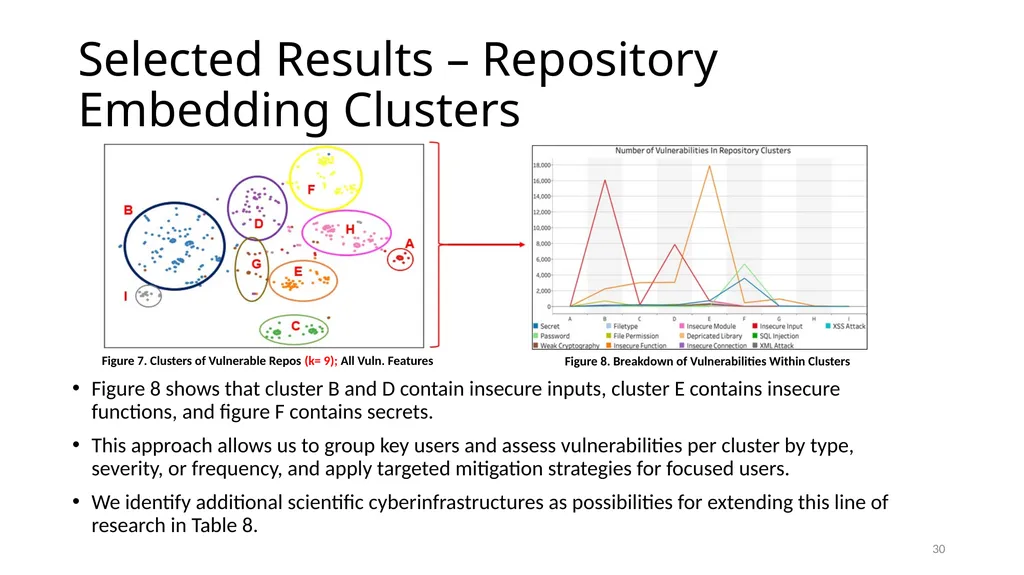
Selected Results – Repository Embedding Clusters Figure 8 shows that cluster B and D contain insecure inputs, cluster E contains insecure functions, and figure F contains secrets.
This approach allows us to group key users and assess vulnerabilities per cluster by type, severity, or frequency, and apply targeted mitigation strategies for focused users.
We identify additional scientific cyberinfrastructures as possibilities for extending this line of research in Table 8. Figure 7. Clusters of Vulnerable Repos (k= 9); All Vuln. Features 30 Figure 8. Breakdown of Vulnerabilities Within Clusters<br>
This approach allows us to group key users and assess vulnerabilities per cluster by type, severity, or frequency, and apply targeted mitigation strategies for focused users.
We identify additional scientific cyberinfrastructures as possibilities for extending this line of research in Table 8. Figure 7. Clusters of Vulnerable Repos (k= 9); All Vuln. Features 30 Figure 8. Breakdown of Vulnerabilities Within Clusters<br>
31
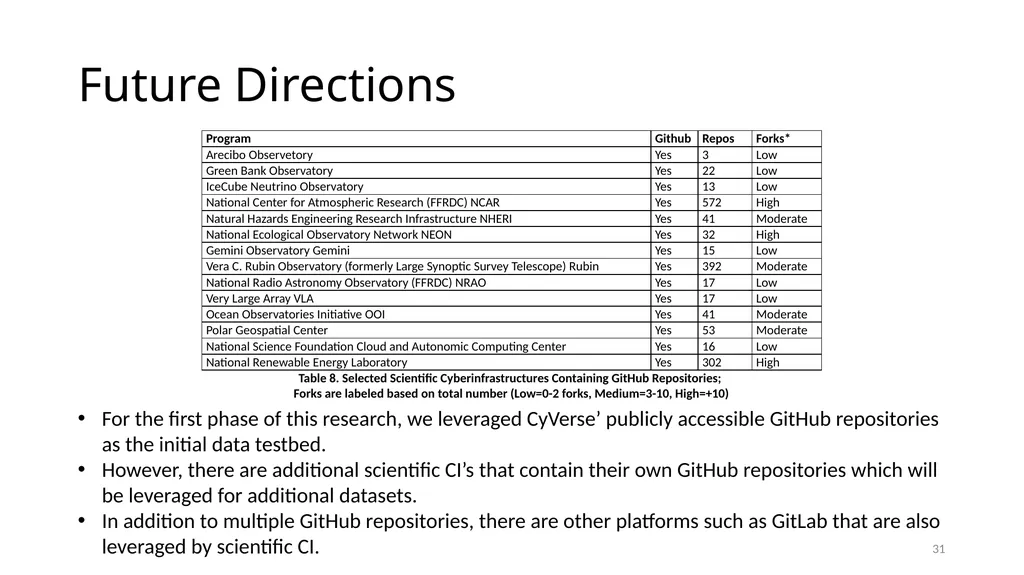
Future Directions 31 Table 8. Selected Scientific Cyberinfrastructures Containing GitHub Repositories;
Forks are labeled based on total number (Low=0-2 forks, Medium=3-10, High=+10) For the first phase of this research, we leveraged CyVerse’ publicly accessible GitHub repositories as the initial data testbed.
However, there are additional scientific CI’s that contain their own GitHub repositories which will be leveraged for additional datasets.
In addition to multiple GitHub repositories, there are other platforms such as GitLab that are also leveraged by scientific CI.<br>
Forks are labeled based on total number (Low=0-2 forks, Medium=3-10, High=+10) For the first phase of this research, we leveraged CyVerse’ publicly accessible GitHub repositories as the initial data testbed.
However, there are additional scientific CI’s that contain their own GitHub repositories which will be leveraged for additional datasets.
In addition to multiple GitHub repositories, there are other platforms such as GitLab that are also leveraged by scientific CI.<br>
32
Module 3: Internet of Things (IoT) By Izhar Sajid 32<br>
33
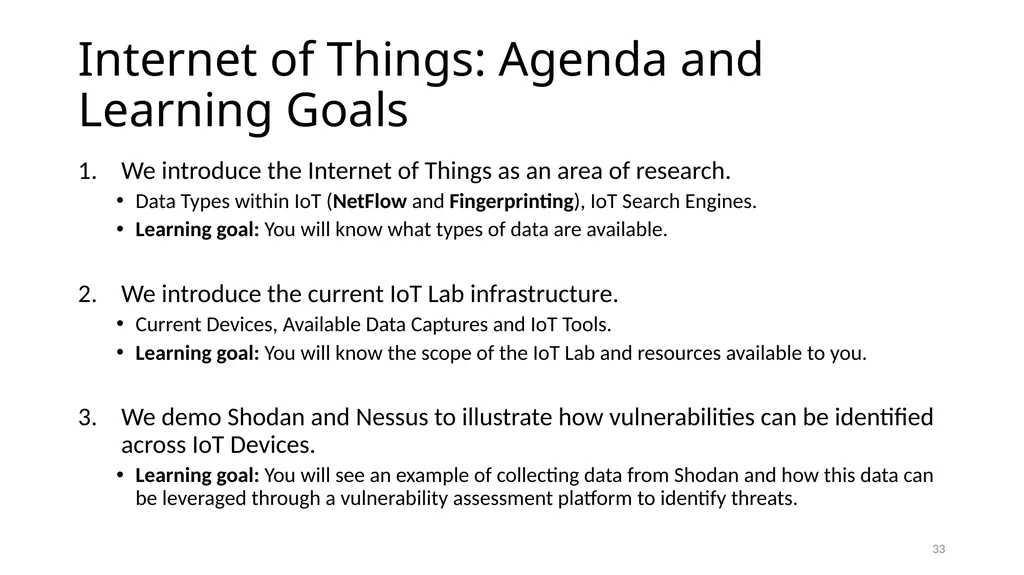
Internet of Things: Agenda and Learning Goals We introduce the Internet of Things as an area of research.
Data Types within IoT (NetFlow and Fingerprinting), IoT Search Engines.
Learning goal: You will know what types of data are available.
We introduce the current IoT Lab infrastructure.
Current Devices, Available Data Captures and IoT Tools.
Learning goal: You will know the scope of the IoT Lab and resources available to you.
We demo Shodan and Nessus to illustrate how vulnerabilities can be identified across IoT Devices.
Learning goal: You will see an example of collecting data from Shodan and how this data can be leveraged through a vulnerability assessment platform to identify threats. 33<br>
Data Types within IoT (NetFlow and Fingerprinting), IoT Search Engines.
Learning goal: You will know what types of data are available.
We introduce the current IoT Lab infrastructure.
Current Devices, Available Data Captures and IoT Tools.
Learning goal: You will know the scope of the IoT Lab and resources available to you.
We demo Shodan and Nessus to illustrate how vulnerabilities can be identified across IoT Devices.
Learning goal: You will see an example of collecting data from Shodan and how this data can be leveraged through a vulnerability assessment platform to identify threats. 33<br>
34
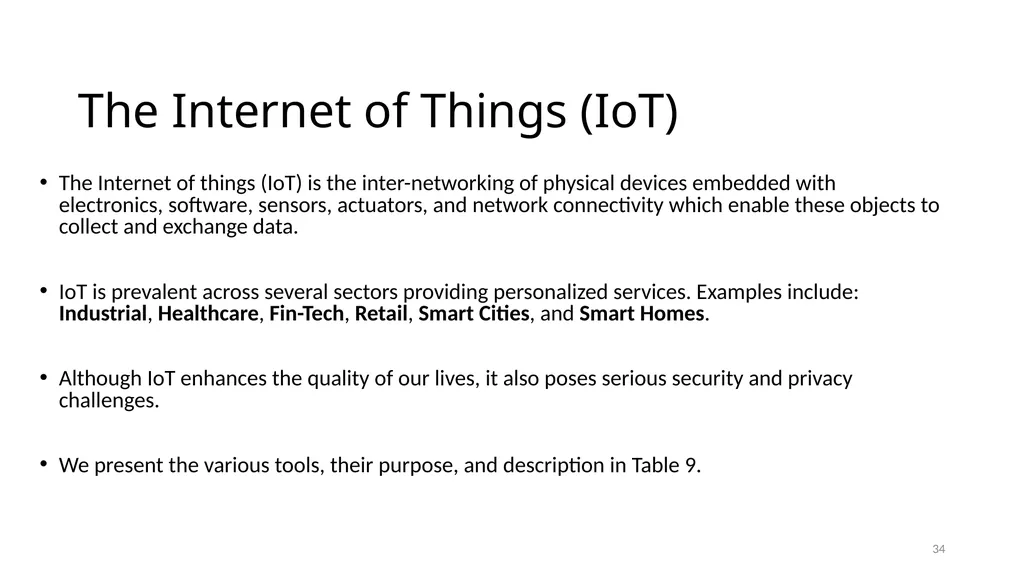
The Internet of Things (IoT) The Internet of things (IoT) is the inter-networking of physical devices embedded with electronics, software, sensors, actuators, and network connectivity which enable these objects to collect and exchange data.
IoT is prevalent across several sectors providing personalized services. Examples include: Industrial, Healthcare, Fin-Tech, Retail, Smart Cities, and Smart Homes.
Although IoT enhances the quality of our lives, it also poses serious security and privacy challenges.
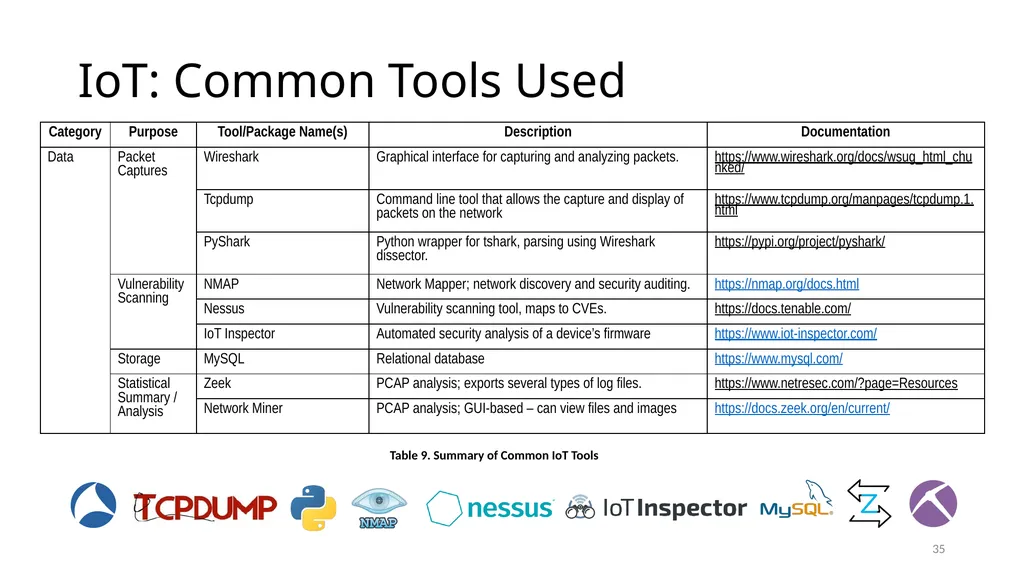
We present the various tools, their purpose, and description in Table 9. 34<br>
IoT is prevalent across several sectors providing personalized services. Examples include: Industrial, Healthcare, Fin-Tech, Retail, Smart Cities, and Smart Homes.
Although IoT enhances the quality of our lives, it also poses serious security and privacy challenges.
We present the various tools, their purpose, and description in Table 9. 34<br>
35
IoT: Common Tools Used Table 9. Summary of Common IoT Tools 35<br>
36
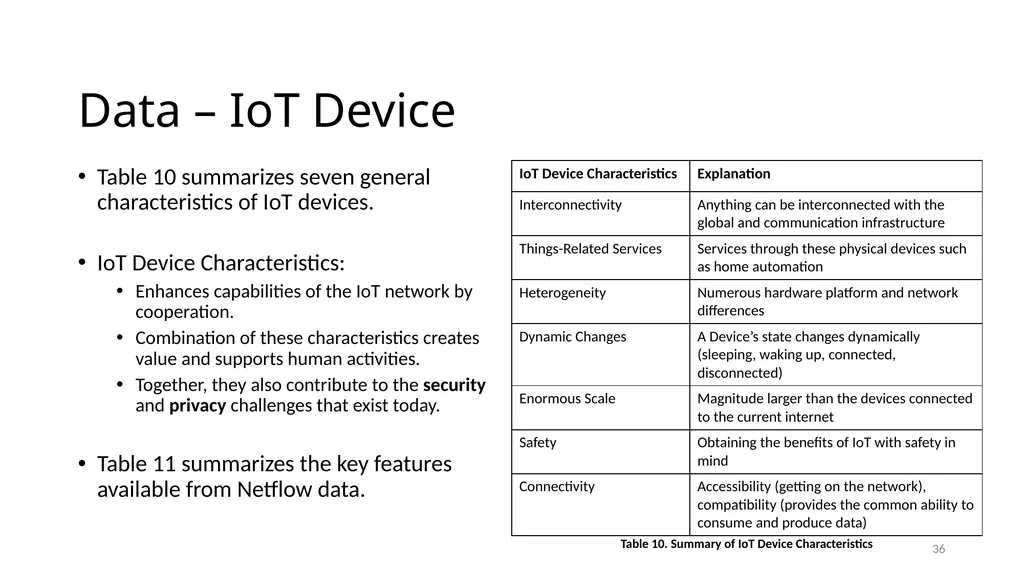
Data – IoT Device Table 10 summarizes seven general characteristics of IoT devices.
IoT Device Characteristics:
Enhances capabilities of the IoT network by cooperation.
Combination of these characteristics creates value and supports human activities.
Together, they also contribute to the security and privacy challenges that exist today.
Table 11 summarizes the key features available from Netflow data. Table 10. Summary of IoT Device Characteristics 36<br>
IoT Device Characteristics:
Enhances capabilities of the IoT network by cooperation.
Combination of these characteristics creates value and supports human activities.
Together, they also contribute to the security and privacy challenges that exist today.
Table 11 summarizes the key features available from Netflow data. Table 10. Summary of IoT Device Characteristics 36<br>
37
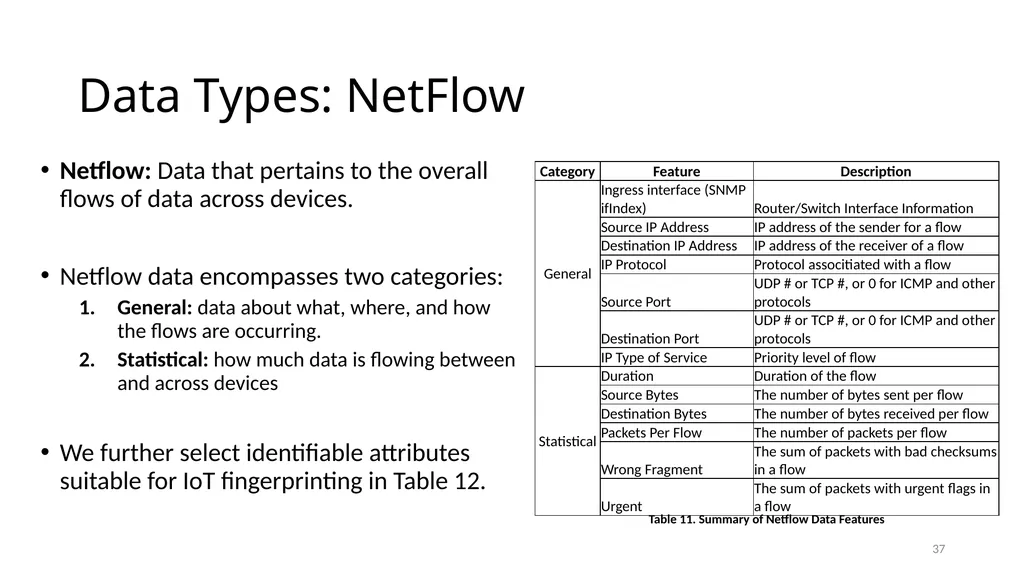
Data Types: NetFlow Netflow: Data that pertains to the overall flows of data across devices.
Netflow data encompasses two categories:
General: data about what, where, and how the flows are occurring.
Statistical: how much data is flowing between and across devices
We further select identifiable attributes suitable for IoT fingerprinting in Table 12. Table 11. Summary of Netflow Data Features 37<br>
Netflow data encompasses two categories:
General: data about what, where, and how the flows are occurring.
Statistical: how much data is flowing between and across devices
We further select identifiable attributes suitable for IoT fingerprinting in Table 12. Table 11. Summary of Netflow Data Features 37<br>
38
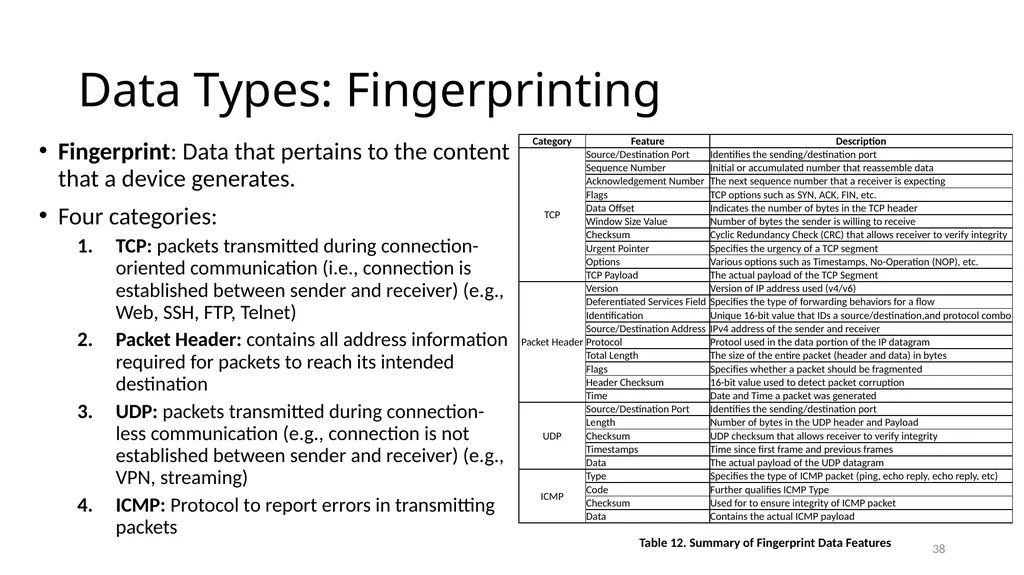
Data Types: Fingerprinting Fingerprint: Data that pertains to the content that a device generates.
Four categories:
TCP: packets transmitted during connection-oriented communication (i.e., connection is established between sender and receiver) (e.g., Web, SSH, FTP, Telnet)
Packet Header: contains all address information required for packets to reach its intended destination
UDP: packets transmitted during connection- less communication (e.g., connection is not established between sender and receiver) (e.g., VPN, streaming)
ICMP: Protocol to report errors in transmitting packets Table 12. Summary of Fingerprint Data Features 38<br>
Four categories:
TCP: packets transmitted during connection-oriented communication (i.e., connection is established between sender and receiver) (e.g., Web, SSH, FTP, Telnet)
Packet Header: contains all address information required for packets to reach its intended destination
UDP: packets transmitted during connection- less communication (e.g., connection is not established between sender and receiver) (e.g., VPN, streaming)
ICMP: Protocol to report errors in transmitting packets Table 12. Summary of Fingerprint Data Features 38<br>
39
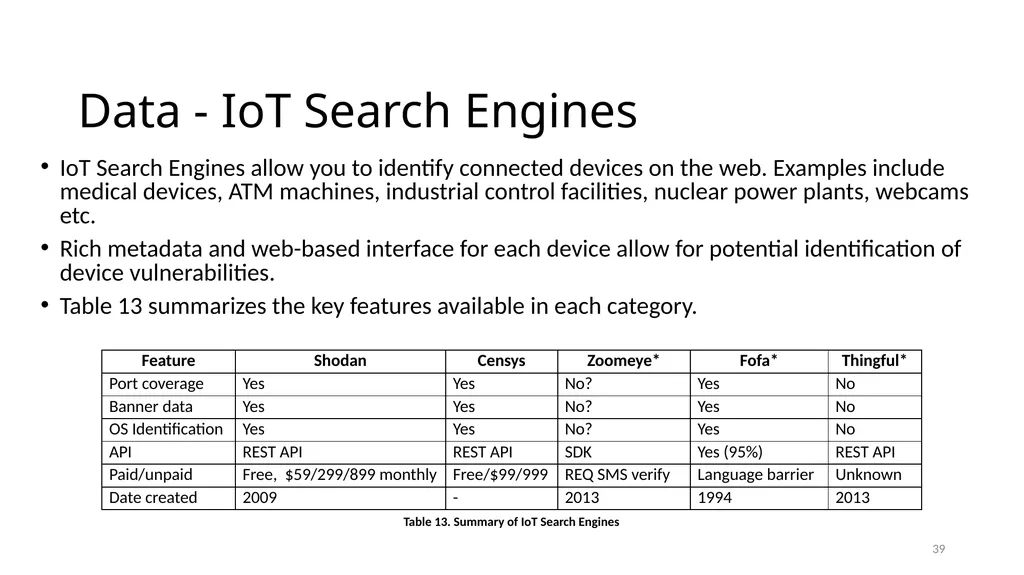
Table 13. Summary of IoT Search Engines Data - IoT Search Engines IoT Search Engines allow you to identify connected devices on the web. Examples include medical devices, ATM machines, industrial control facilities, nuclear power plants, webcams etc.
Rich metadata and web-based interface for each device allow for potential identification of device vulnerabilities.
Table 13 summarizes the key features available in each category. 39<br>
Rich metadata and web-based interface for each device allow for potential identification of device vulnerabilities.
Table 13 summarizes the key features available in each category. 39<br>
40
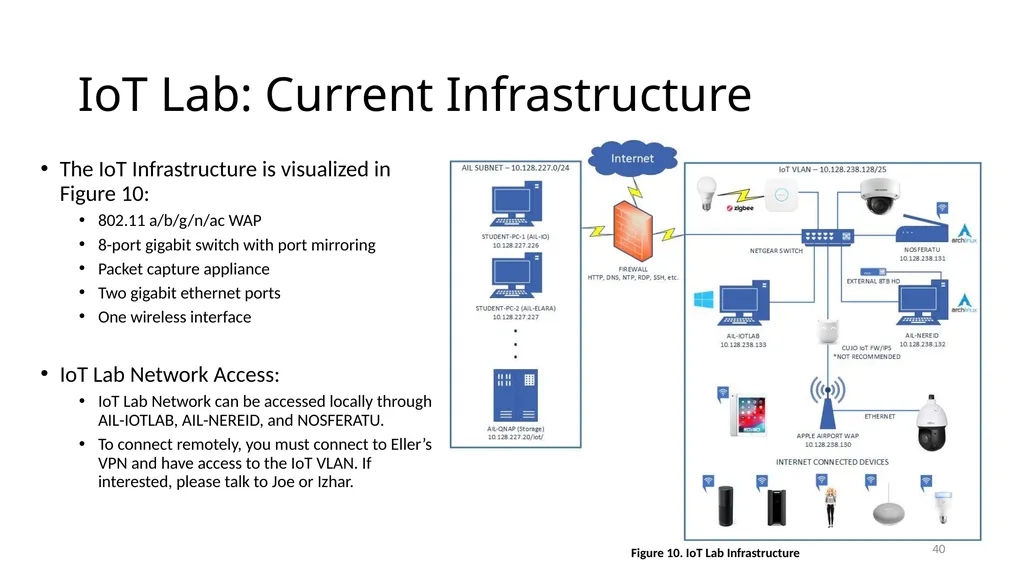
IoT Lab: Current Infrastructure The IoT Infrastructure is visualized in Figure 10:
802.11 a/b/g/n/ac WAP
8-port gigabit switch with port mirroring
Packet capture appliance
Two gigabit ethernet ports
One wireless interface
IoT Lab Network Access:
IoT Lab Network can be accessed locally through AIL-IOTLAB, AIL-NEREID, and NOSFERATU.
To connect remotely, you must connect to Eller’s VPN and have access to the IoT VLAN. If interested, please talk to Joe or Izhar. Figure 10. IoT Lab Infrastructure 40<br>
802.11 a/b/g/n/ac WAP
8-port gigabit switch with port mirroring
Packet capture appliance
Two gigabit ethernet ports
One wireless interface
IoT Lab Network Access:
IoT Lab Network can be accessed locally through AIL-IOTLAB, AIL-NEREID, and NOSFERATU.
To connect remotely, you must connect to Eller’s VPN and have access to the IoT VLAN. If interested, please talk to Joe or Izhar. Figure 10. IoT Lab Infrastructure 40<br>
41
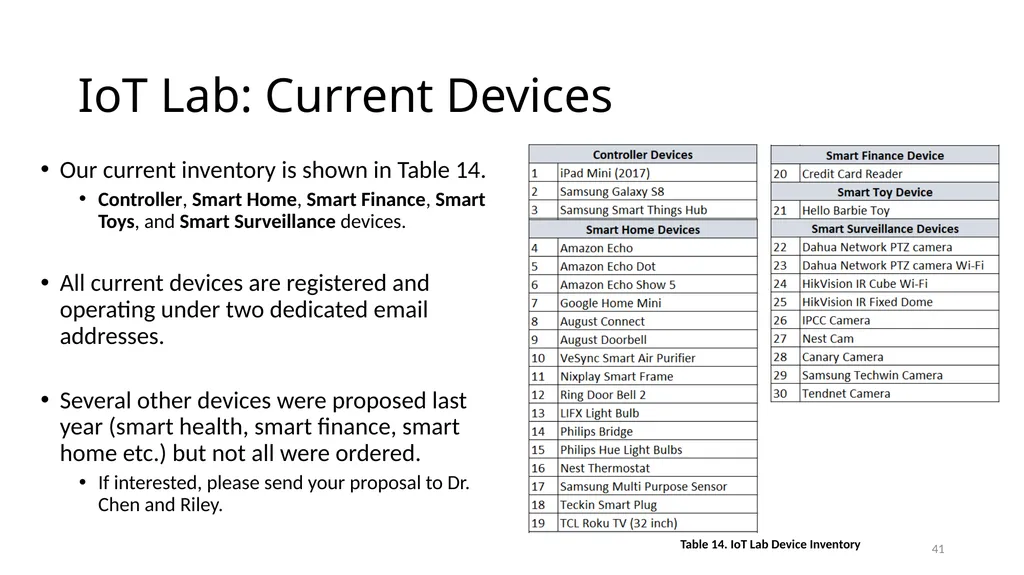
IoT Lab: Current Devices Our current inventory is shown in Table 14.
Controller, Smart Home, Smart Finance, Smart Toys, and Smart Surveillance devices.
All current devices are registered and operating under two dedicated email addresses.
Several other devices were proposed last year (smart health, smart finance, smart home etc.) but not all were ordered.
If interested, please send your proposal to Dr. Chen and Riley. Table 14. IoT Lab Device Inventory 41<br>
Controller, Smart Home, Smart Finance, Smart Toys, and Smart Surveillance devices.
All current devices are registered and operating under two dedicated email addresses.
Several other devices were proposed last year (smart health, smart finance, smart home etc.) but not all were ordered.
If interested, please send your proposal to Dr. Chen and Riley. Table 14. IoT Lab Device Inventory 41<br>
42
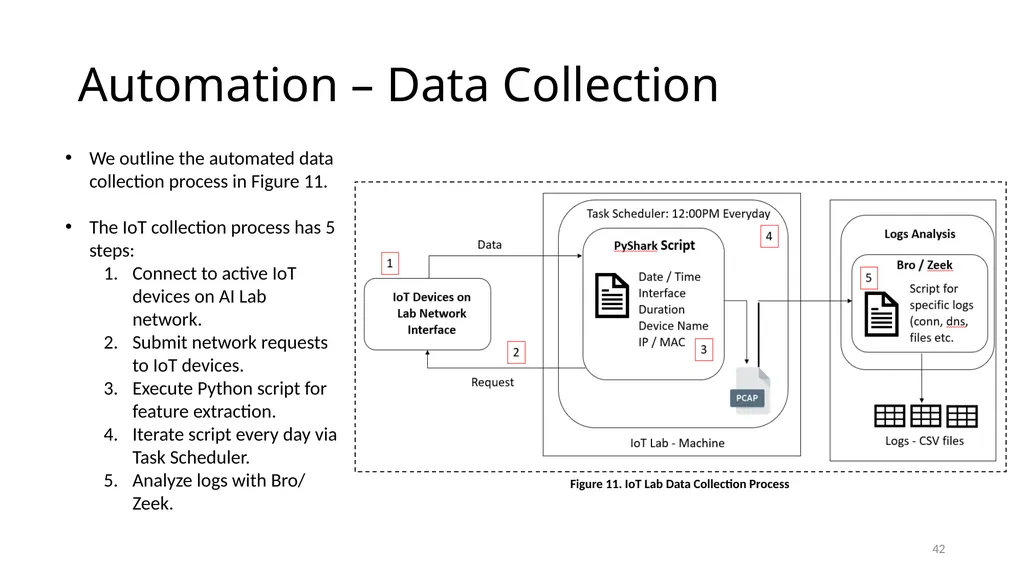
Automation – Data Collection Figure 11. IoT Lab Data Collection Process 42 We outline the automated data collection process in Figure 11.
The IoT collection process has 5 steps:
Connect to active IoT devices on AI Lab network.
Submit network requests to IoT devices.
Execute Python script for feature extraction.
Iterate script every day via Task Scheduler.
Analyze logs with Bro/ Zeek.<br>
The IoT collection process has 5 steps:
Connect to active IoT devices on AI Lab network.
Submit network requests to IoT devices.
Execute Python script for feature extraction.
Iterate script every day via Task Scheduler.
Analyze logs with Bro/ Zeek.<br>
43
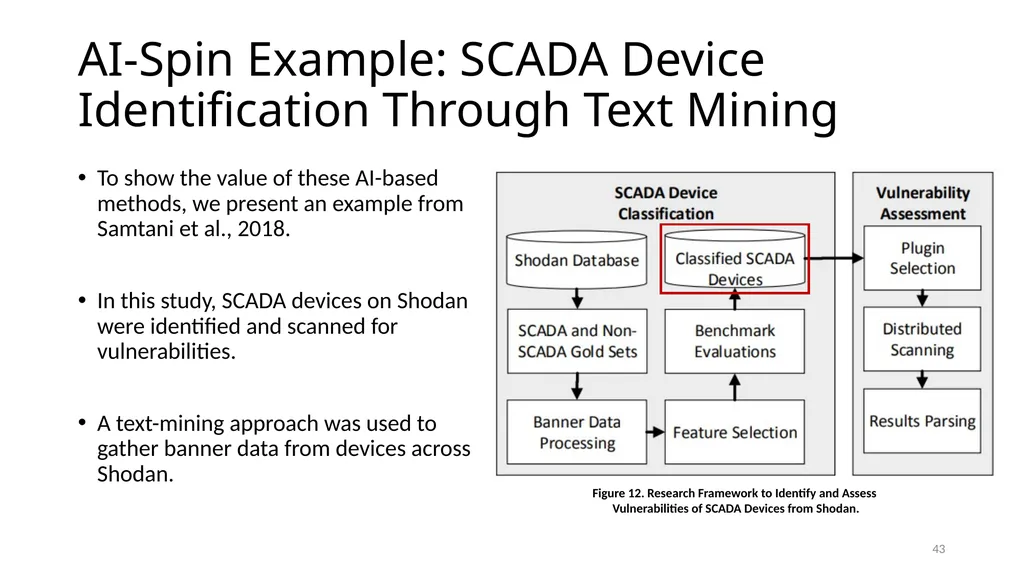
AI-Spin Example: SCADA Device Identification Through Text Mining To show the value of these AI-based methods, we present an example from Samtani et al., 2018.
In this study, SCADA devices on Shodan were identified and scanned for vulnerabilities.
A text-mining approach was used to gather banner data from devices across Shodan. 43 Figure 12. Research Framework to Identify and Assess
Vulnerabilities of SCADA Devices from Shodan.<br>
In this study, SCADA devices on Shodan were identified and scanned for vulnerabilities.
A text-mining approach was used to gather banner data from devices across Shodan. 43 Figure 12. Research Framework to Identify and Assess
Vulnerabilities of SCADA Devices from Shodan.<br>
44
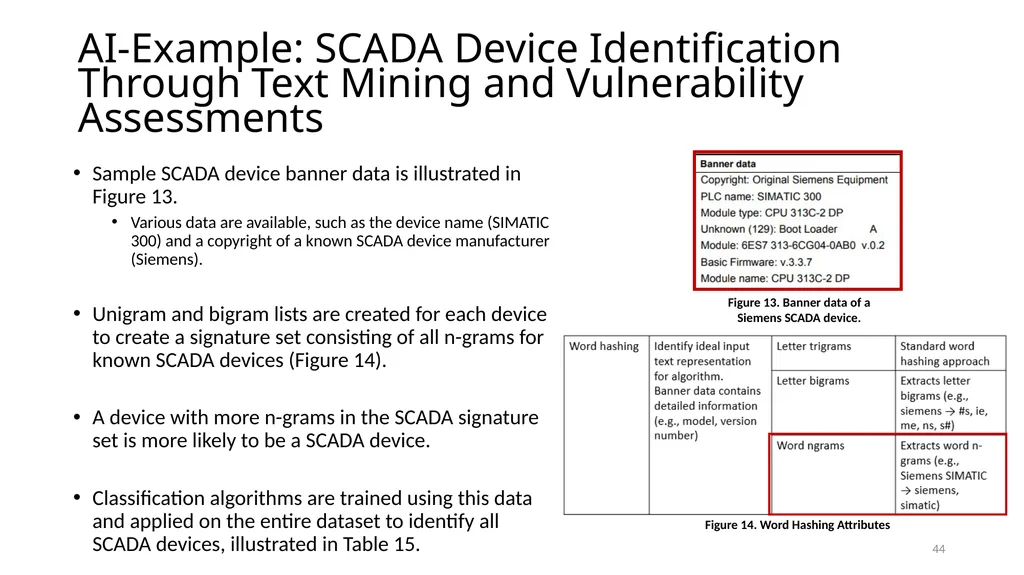
AI-Example: SCADA Device Identification Through Text Mining and Vulnerability Assessments 44 Figure 13. Banner data of a
Siemens SCADA device. Sample SCADA device banner data is illustrated in Figure 13.
Various data are available, such as the device name (SIMATIC 300) and a copyright of a known SCADA device manufacturer (Siemens).
Unigram and bigram lists are created for each device to create a signature set consisting of all n-grams for known SCADA devices (Figure 14).
A device with more n-grams in the SCADA signature set is more likely to be a SCADA device.
Classification algorithms are trained using this data and applied on the entire dataset to identify all SCADA devices, illustrated in Table 15. Figure 14. Word Hashing Attributes<br>
Siemens SCADA device. Sample SCADA device banner data is illustrated in Figure 13.
Various data are available, such as the device name (SIMATIC 300) and a copyright of a known SCADA device manufacturer (Siemens).
Unigram and bigram lists are created for each device to create a signature set consisting of all n-grams for known SCADA devices (Figure 14).
A device with more n-grams in the SCADA signature set is more likely to be a SCADA device.
Classification algorithms are trained using this data and applied on the entire dataset to identify all SCADA devices, illustrated in Table 15. Figure 14. Word Hashing Attributes<br>
45
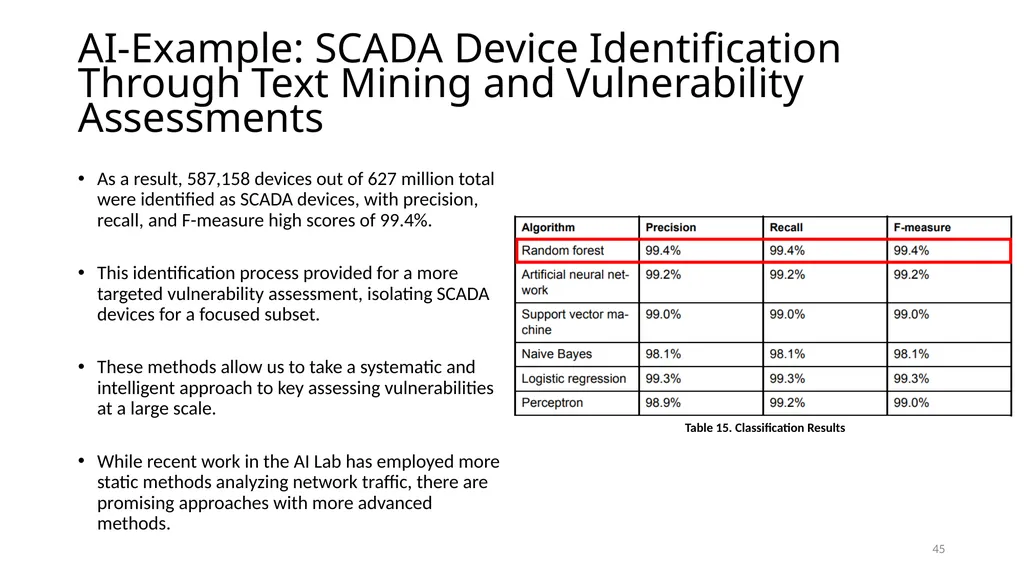
AI-Example: SCADA Device Identification Through Text Mining and Vulnerability Assessments 45 As a result, 587,158 devices out of 627 million total were identified as SCADA devices, with precision, recall, and F-measure high scores of 99.4%.
This identification process provided for a more targeted vulnerability assessment, isolating SCADA devices for a focused subset.
These methods allow us to take a systematic and intelligent approach to key assessing vulnerabilities at a large scale.
While recent work in the AI Lab has employed more static methods analyzing network traffic, there are promising approaches with more advanced methods. Table 15. Classification Results<br>
This identification process provided for a more targeted vulnerability assessment, isolating SCADA devices for a focused subset.
These methods allow us to take a systematic and intelligent approach to key assessing vulnerabilities at a large scale.
While recent work in the AI Lab has employed more static methods analyzing network traffic, there are promising approaches with more advanced methods. Table 15. Classification Results<br>
46
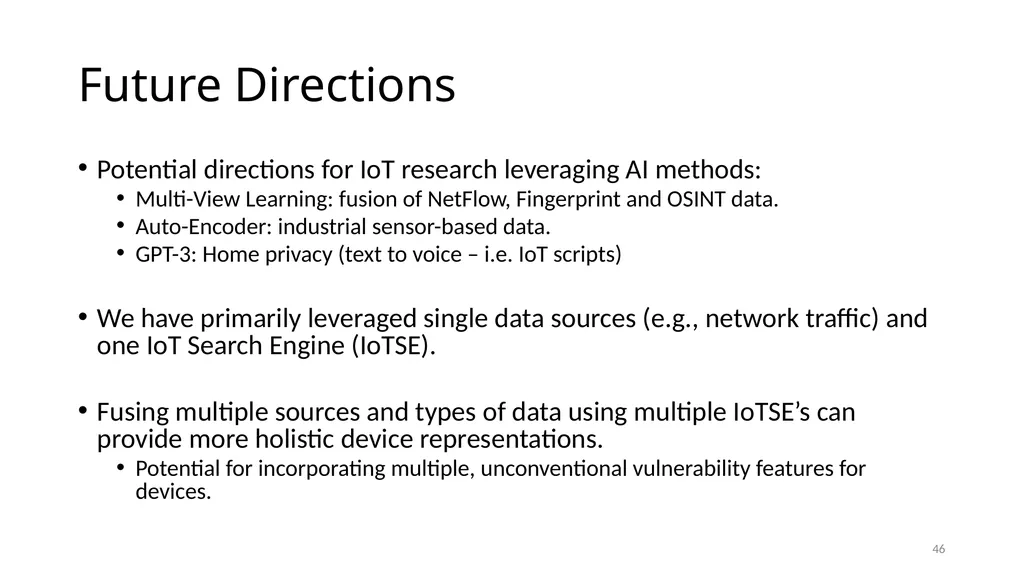
Future Directions Potential directions for IoT research leveraging AI methods:
Multi-View Learning: fusion of NetFlow, Fingerprint and OSINT data.
Auto-Encoder: industrial sensor-based data.
GPT-3: Home privacy (text to voice – i.e. IoT scripts)
We have primarily leveraged single data sources (e.g., network traffic) and one IoT Search Engine (IoTSE).
Fusing multiple sources and types of data using multiple IoTSE’s can provide more holistic device representations.
Potential for incorporating multiple, unconventional vulnerability features for devices. 46<br>
Multi-View Learning: fusion of NetFlow, Fingerprint and OSINT data.
Auto-Encoder: industrial sensor-based data.
GPT-3: Home privacy (text to voice – i.e. IoT scripts)
We have primarily leveraged single data sources (e.g., network traffic) and one IoT Search Engine (IoTSE).
Fusing multiple sources and types of data using multiple IoTSE’s can provide more holistic device representations.
Potential for incorporating multiple, unconventional vulnerability features for devices. 46<br>
47
Summary Smart Vulnerability Assessment (SVA) applies AI techniques to system/device information to better assess inherent vulnerabilities.
We presented several key areas of work that the AI Lab is focused on for SVA:
VM Images in Scientific Cyberinfrastructure
Public Social Coding Repositories (GitHub)
IoT Devices
For work in the AI Lab, it is critical to identify the available data, sources and types, and relevant security/vulnerability features.
These determine the specific types of analytics that can be used within the research
Finally, an automated and scalable approach is critical for collecting data and assessing vulnerabilities/security concerns within each area. 47<br>
We presented several key areas of work that the AI Lab is focused on for SVA:
VM Images in Scientific Cyberinfrastructure
Public Social Coding Repositories (GitHub)
IoT Devices
For work in the AI Lab, it is critical to identify the available data, sources and types, and relevant security/vulnerability features.
These determine the specific types of analytics that can be used within the research
Finally, an automated and scalable approach is critical for collecting data and assessing vulnerabilities/security concerns within each area. 47<br>
48
Questions 48<br>