
Using Long Short-Term Memory Neural Network Model
Description: Using Long Short-Term Memory Neural Network Model to Predict Air Quality Index Martha Crisp, Veeraraghava Raju Hasti MAE 495 011 and MAE 589 011: Artificial Intelligence for Engineering Applications, Fall 2023, Project Advisor: Prof.
Related Topics
Download Presentation
"Using Long Short-Term Memory Neural Network Model" is the property of its rightful owner. Permission is granted to download and print the materials on this website for personal, non-commercial use only, and to display it on your personal computer provided you do not modify the materials and that you retain all copyright notices contained in the materials. By downloading content from our website, you accept the terms of this agreement.
Presentation Transcript
slide1. Using Long Short-Term Memory Neural Network Model to Predict Air Quality Index
Martha Crisp, Veeraraghava Raju Hasti
MAE 495 – 011 and MAE 589 – 011: Artificial Intelligence for Engineering Applications, Fall 2023, Project Advisor: Prof. Veeraraghava Raju Hasti, Ph.D. Abstract Introduction Objectives/ Goals of the project Methodology Results Conclusion and Discussion Future Work Acknowledgments On the forefront of the youngest generation’s mind is the rising concern of pollutant levels. Popular prediction methods including linear and polynomial regression have been used to forecast an abundance of different datasets, but the nature of pollution levels reflected in Air Quality Index (AQI) datasets are too complex to be accurately modeled by these methods. This research uses the Long Short-Term Memory (LSTM) model, a variation of the Recurrent Neural Network, to predict future AQI levels in Delhi, India. Upon evaluation, the R squared value of the model resulted in a 0.954 value. This close prediction is visualized against when the true and predicted values are graphed. Air Quality Index is a tool used by government agencies to describe the abundance of pollution the air from 0-500, with 0 indicating the lowest level of concern and 500 indicating the highest level of concern. As the population of Delhi has increased, pollution has also increased, thus contributing to rising AQI levels. The dataset chosen to analyze has daily values from 2015 to 2020 of pollutant levels, and the recorded AQI. When graphing AQI vs time (fig. 1), the relationship graphed has several peaks and valleys. Due to the relationship of the data, using linear or polynomial regression will not be great choices for prediction.
Long Short-Term Memory (LSTM) network illustrated in Fig. 1 and Fig. 2 is a subset of Recurrent Neural Network. The input layer takes and processes data. The hidden layer is responsible for looping through iterations while simultaneously retaining information by filtering data through an input, forget, and output data. The data is then outputted. The objective of this project is to create an LSTM code capable of predicting future levels of the AQI in Delhi, India with an R squared value between 0.95 and 0.99. The Mean Squared Error Loss (MSE) will also be evaluated and graphed.
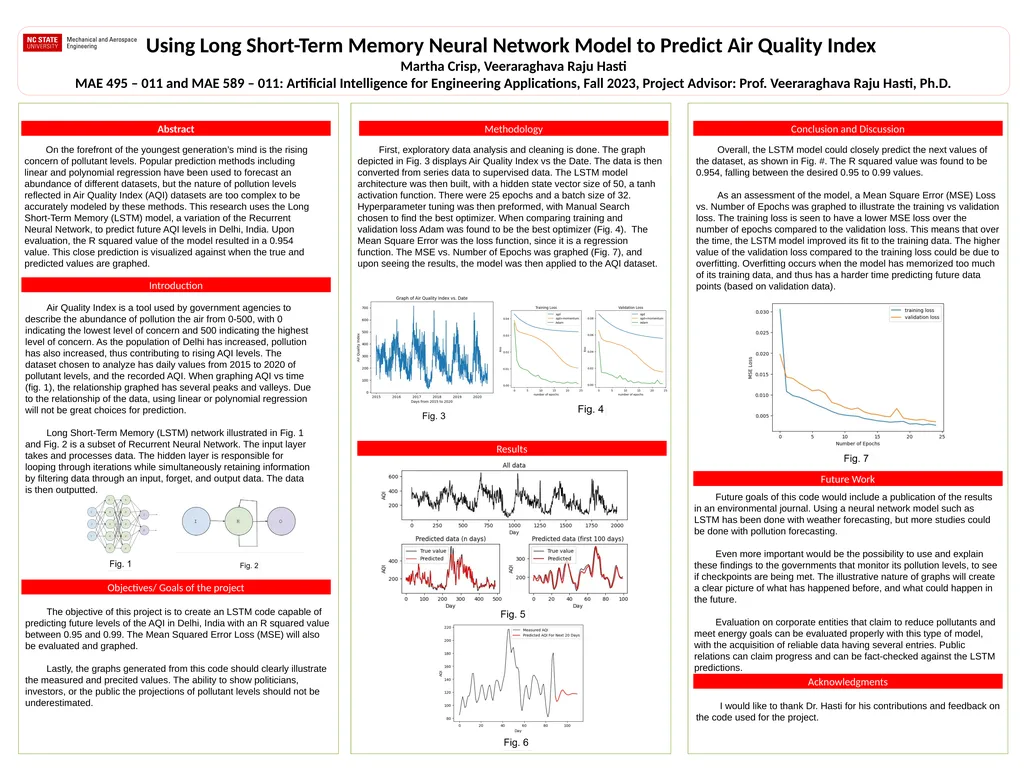
Lastly, the graphs generated from this code should clearly illustrate the measured and precited values. The ability to show politicians, investors, or the public the projections of pollutant levels should not be underestimated. First, exploratory data analysis and cleaning is done. The graph depicted in Fig. 3 displays Air Quality Index vs the Date. The data is then converted from series data to supervised data. The LSTM model architecture was then built, with a hidden state vector size of 50, a tanh activation function. There were 25 epochs and a batch size of 32. Hyperparameter tuning was then preformed, with Manual Search chosen to find the best optimizer. When comparing training and validation loss Adam was found to be the best optimizer (Fig. 4). The Mean Square Error was the loss function, since it is a regression function. The MSE vs. Number of Epochs was graphed (Fig. 7), and upon seeing the results, the model was then applied to the AQI dataset. Overall, the LSTM model could closely predict the next values of the dataset, as shown in Fig. #. The R squared value was found to be 0.954, falling between the desired 0.95 to 0.99 values.
As an assessment of the model, a Mean Square Error (MSE) Loss vs. Number of Epochs was graphed to illustrate the training vs validation loss. The training loss is seen to have a lower MSE loss over the number of epochs compared to the validation loss. This means that over the time, the LSTM model improved its fit to the training data. The higher value of the validation loss compared to the training loss could be due to overfitting. Overfitting occurs when the model has memorized too much of its training data, and thus has a harder time predicting future data points (based on validation data). Future goals of this code would include a publication of the results in an environmental journal. Using a neural network model such as LSTM has been done with weather forecasting, but more studies could be done with pollution forecasting.
Even more important would be the possibility to use and explain these findings to the governments that monitor its pollution levels, to see if checkpoints are being met. The illustrative nature of graphs will create a clear picture of what has happened before, and what could happen in the future.
Evaluation on corporate entities that claim to reduce pollutants and meet energy goals can be evaluated properly with this type of model, with the acquisition of reliable data having several entries. Public relations can claim progress and can be fact-checked against the LSTM predictions. I would like to thank Dr. Hasti for his contributions and feedback on the code used for the project.<br>
Martha Crisp, Veeraraghava Raju Hasti
MAE 495 – 011 and MAE 589 – 011: Artificial Intelligence for Engineering Applications, Fall 2023, Project Advisor: Prof. Veeraraghava Raju Hasti, Ph.D. Abstract Introduction Objectives/ Goals of the project Methodology Results Conclusion and Discussion Future Work Acknowledgments On the forefront of the youngest generation’s mind is the rising concern of pollutant levels. Popular prediction methods including linear and polynomial regression have been used to forecast an abundance of different datasets, but the nature of pollution levels reflected in Air Quality Index (AQI) datasets are too complex to be accurately modeled by these methods. This research uses the Long Short-Term Memory (LSTM) model, a variation of the Recurrent Neural Network, to predict future AQI levels in Delhi, India. Upon evaluation, the R squared value of the model resulted in a 0.954 value. This close prediction is visualized against when the true and predicted values are graphed. Air Quality Index is a tool used by government agencies to describe the abundance of pollution the air from 0-500, with 0 indicating the lowest level of concern and 500 indicating the highest level of concern. As the population of Delhi has increased, pollution has also increased, thus contributing to rising AQI levels. The dataset chosen to analyze has daily values from 2015 to 2020 of pollutant levels, and the recorded AQI. When graphing AQI vs time (fig. 1), the relationship graphed has several peaks and valleys. Due to the relationship of the data, using linear or polynomial regression will not be great choices for prediction.
Long Short-Term Memory (LSTM) network illustrated in Fig. 1 and Fig. 2 is a subset of Recurrent Neural Network. The input layer takes and processes data. The hidden layer is responsible for looping through iterations while simultaneously retaining information by filtering data through an input, forget, and output data. The data is then outputted. The objective of this project is to create an LSTM code capable of predicting future levels of the AQI in Delhi, India with an R squared value between 0.95 and 0.99. The Mean Squared Error Loss (MSE) will also be evaluated and graphed.
Lastly, the graphs generated from this code should clearly illustrate the measured and precited values. The ability to show politicians, investors, or the public the projections of pollutant levels should not be underestimated. First, exploratory data analysis and cleaning is done. The graph depicted in Fig. 3 displays Air Quality Index vs the Date. The data is then converted from series data to supervised data. The LSTM model architecture was then built, with a hidden state vector size of 50, a tanh activation function. There were 25 epochs and a batch size of 32. Hyperparameter tuning was then preformed, with Manual Search chosen to find the best optimizer. When comparing training and validation loss Adam was found to be the best optimizer (Fig. 4). The Mean Square Error was the loss function, since it is a regression function. The MSE vs. Number of Epochs was graphed (Fig. 7), and upon seeing the results, the model was then applied to the AQI dataset. Overall, the LSTM model could closely predict the next values of the dataset, as shown in Fig. #. The R squared value was found to be 0.954, falling between the desired 0.95 to 0.99 values.
As an assessment of the model, a Mean Square Error (MSE) Loss vs. Number of Epochs was graphed to illustrate the training vs validation loss. The training loss is seen to have a lower MSE loss over the number of epochs compared to the validation loss. This means that over the time, the LSTM model improved its fit to the training data. The higher value of the validation loss compared to the training loss could be due to overfitting. Overfitting occurs when the model has memorized too much of its training data, and thus has a harder time predicting future data points (based on validation data). Future goals of this code would include a publication of the results in an environmental journal. Using a neural network model such as LSTM has been done with weather forecasting, but more studies could be done with pollution forecasting.
Even more important would be the possibility to use and explain these findings to the governments that monitor its pollution levels, to see if checkpoints are being met. The illustrative nature of graphs will create a clear picture of what has happened before, and what could happen in the future.
Evaluation on corporate entities that claim to reduce pollutants and meet energy goals can be evaluated properly with this type of model, with the acquisition of reliable data having several entries. Public relations can claim progress and can be fact-checked against the LSTM predictions. I would like to thank Dr. Hasti for his contributions and feedback on the code used for the project.<br>