
What type of valuation? Relative Value: Selecting
TF
Published · 18 slides · 0 views

1 / 1
Description
What type of valuation? Relative Value: Selecting the best security in a given sector --The Wall Street approach: Comparative evaluation without having to make purchase decision --Basis of Presentations Intrinsic Value: Selecting an equity
Related Topics
Share
Embed code
Download this presentation From Below
"What type of valuation? Relative Value: Selecting" is the property of its rightful owner. Permission is granted to download and print the materials on this website for personal, non-commercial use only, and to display it on your personal computer provided you do not modify the materials and that you retain all copyright notices contained in the materials. By downloading content from our website, you accept the terms of this agreement.
Presentation Transcript
01
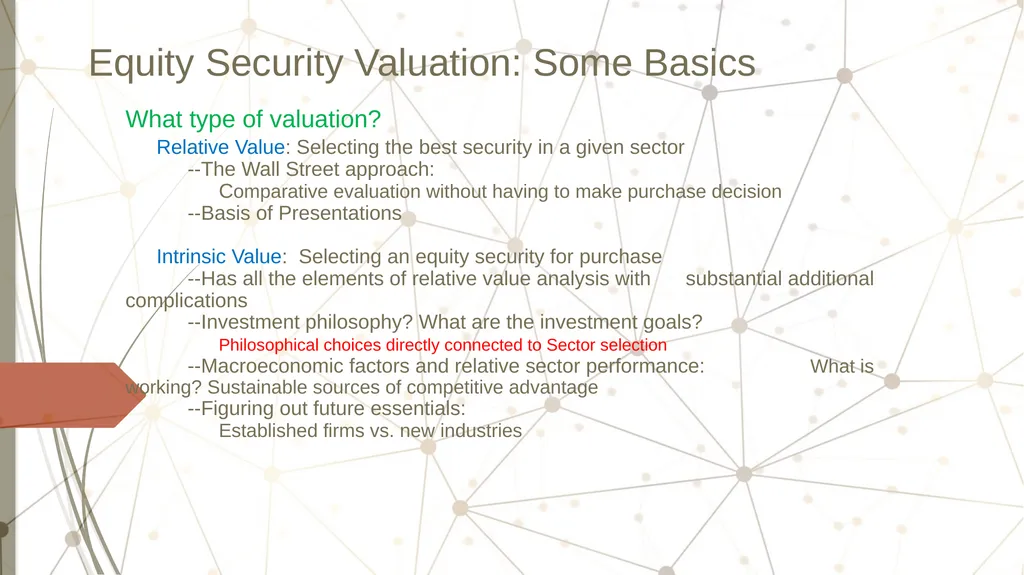
What type of valuation?
Relative Value: Selecting the best security in a given sector
--The Wall Street approach:
Comparative evaluation without having to make purchase decision
--Basis of Presentations
Intrinsic Value: Selecting an equity security for purchase
--Has all the elements of relative value analysis with substantial additional complications
--Investment philosophy? What are the investment goals?
Philosophical choices directly connected to Sector selection
--Macroeconomic factors and relative sector performance: What is working? Sustainable sources of competitive advantage
--Figuring out future essentials:
Established firms vs. new industries Equity Security Valuation: Some Basics<br>
02
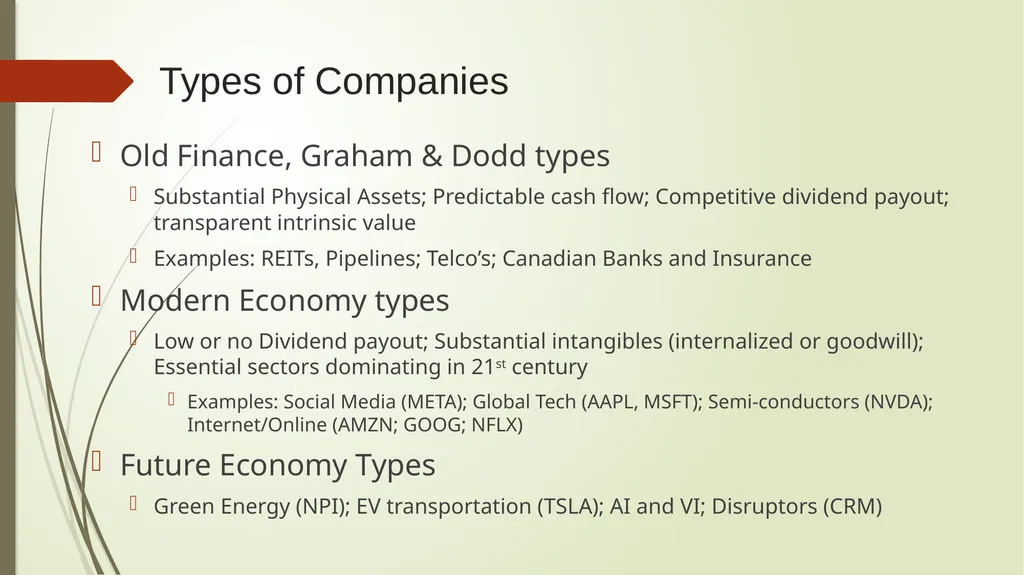
Types of Companies Old Finance, Graham & Dodd types
Substantial Physical Assets; Predictable cash flow; Competitive dividend payout; transparent intrinsic value
Examples: REITs, Pipelines; Telco’s; Canadian Banks and Insurance
Modern Economy types
Low or no Dividend payout; Substantial intangibles (internalized or goodwill); Essential sectors dominating in 21st century
Examples: Social Media (META); Global Tech (AAPL, MSFT); Semi-conductors (NVDA); Internet/Online (AMZN; GOOG; NFLX)
Future Economy Types
Green Energy (NPI); EV transportation (TSLA); AI and VI; Disruptors (CRM)<br>
Substantial Physical Assets; Predictable cash flow; Competitive dividend payout; transparent intrinsic value
Examples: REITs, Pipelines; Telco’s; Canadian Banks and Insurance
Modern Economy types
Low or no Dividend payout; Substantial intangibles (internalized or goodwill); Essential sectors dominating in 21st century
Examples: Social Media (META); Global Tech (AAPL, MSFT); Semi-conductors (NVDA); Internet/Online (AMZN; GOOG; NFLX)
Future Economy Types
Green Energy (NPI); EV transportation (TSLA); AI and VI; Disruptors (CRM)<br>
03
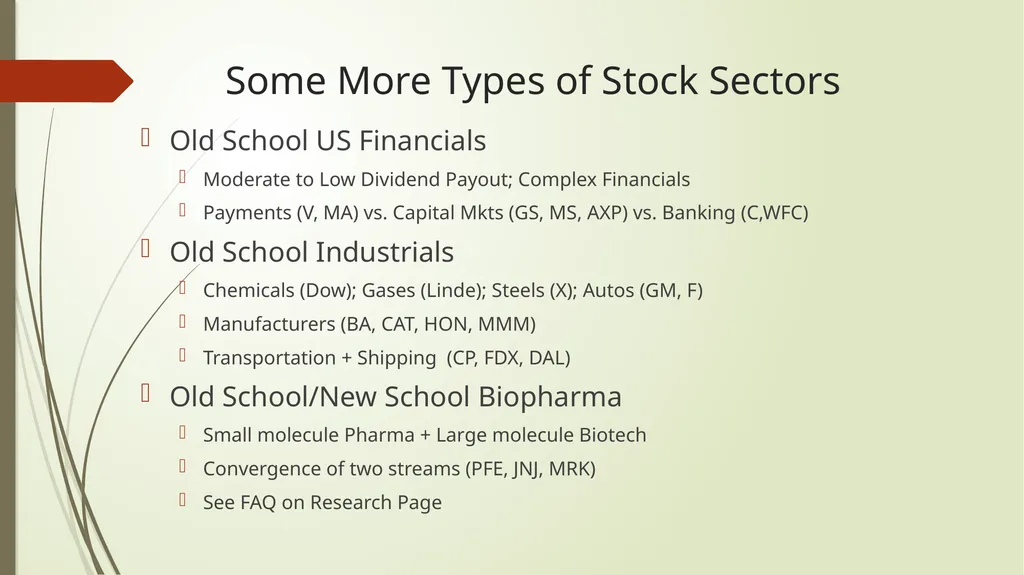
Some More Types of Stock Sectors Old School US Financials
Moderate to Low Dividend Payout; Complex Financials
Payments (V, MA) vs. Capital Mkts (GS, MS, AXP) vs. Banking (C,WFC)
Old School Industrials
Chemicals (Dow); Gases (Linde); Steels (X); Autos (GM, F)
Manufacturers (BA, CAT, HON, MMM)
Transportation + Shipping (CP, FDX, DAL)
Old School/New School Biopharma
Small molecule Pharma + Large molecule Biotech
Convergence of two streams (PFE, JNJ, MRK)
See FAQ on Research Page<br>
Moderate to Low Dividend Payout; Complex Financials
Payments (V, MA) vs. Capital Mkts (GS, MS, AXP) vs. Banking (C,WFC)
Old School Industrials
Chemicals (Dow); Gases (Linde); Steels (X); Autos (GM, F)
Manufacturers (BA, CAT, HON, MMM)
Transportation + Shipping (CP, FDX, DAL)
Old School/New School Biopharma
Small molecule Pharma + Large molecule Biotech
Convergence of two streams (PFE, JNJ, MRK)
See FAQ on Research Page<br>
04
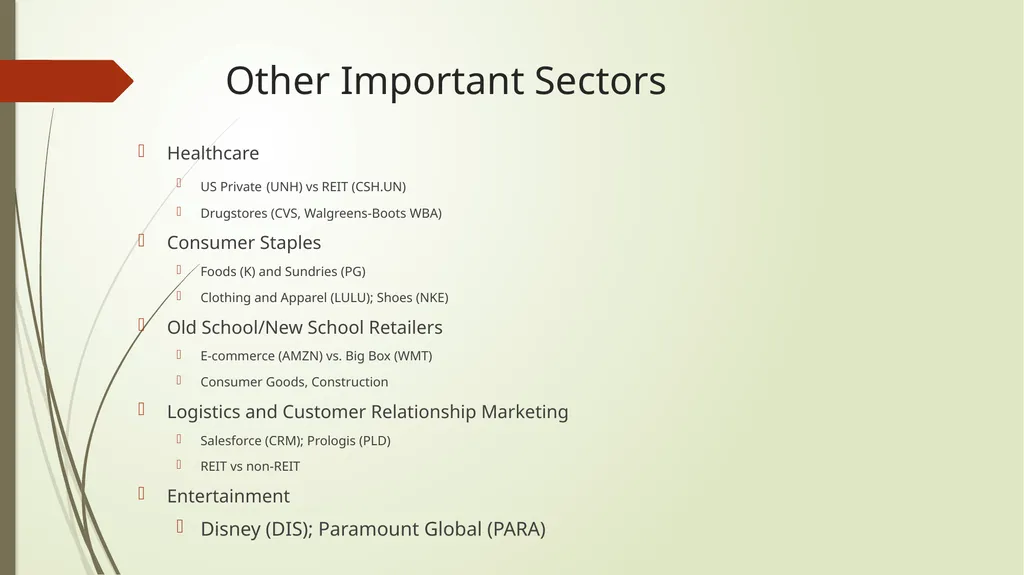
Other Important Sectors Healthcare
US Private (UNH) vs REIT (CSH.UN)
Drugstores (CVS, Walgreens-Boots WBA)
Consumer Staples
Foods (K) and Sundries (PG)
Clothing and Apparel (LULU); Shoes (NKE)
Old School/New School Retailers
E-commerce (AMZN) vs. Big Box (WMT)
Consumer Goods, Construction
Logistics and Customer Relationship Marketing
Salesforce (CRM); Prologis (PLD)
REIT vs non-REIT
Entertainment
Disney (DIS); Paramount Global (PARA)<br>
US Private (UNH) vs REIT (CSH.UN)
Drugstores (CVS, Walgreens-Boots WBA)
Consumer Staples
Foods (K) and Sundries (PG)
Clothing and Apparel (LULU); Shoes (NKE)
Old School/New School Retailers
E-commerce (AMZN) vs. Big Box (WMT)
Consumer Goods, Construction
Logistics and Customer Relationship Marketing
Salesforce (CRM); Prologis (PLD)
REIT vs non-REIT
Entertainment
Disney (DIS); Paramount Global (PARA)<br>
05
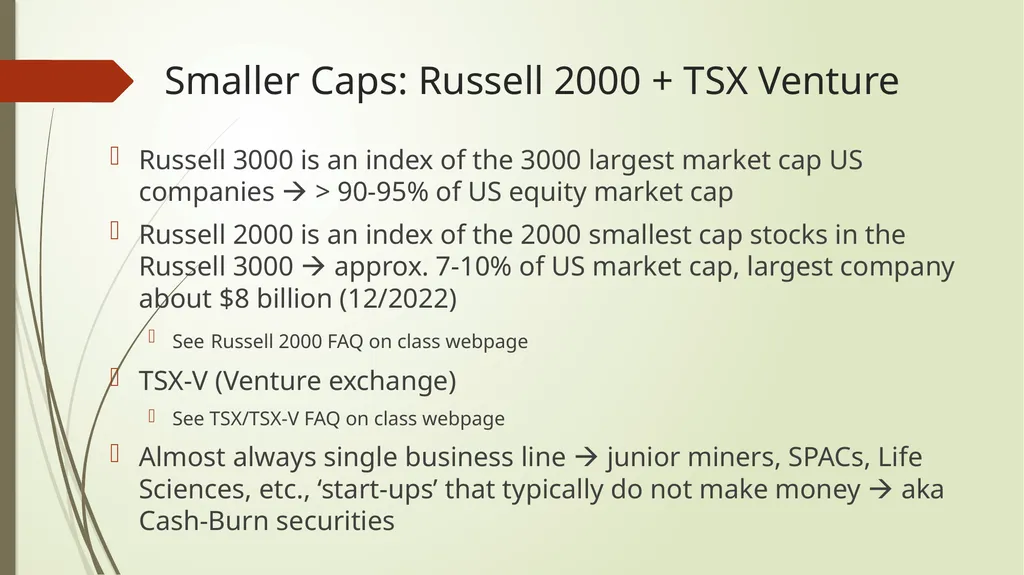
Smaller Caps: Russell 2000 + TSX Venture Russell 3000 is an index of the 3000 largest market cap US companies > 90-95% of US equity market cap
Russell 2000 is an index of the 2000 smallest cap stocks in the Russell 3000 approx. 7-10% of US market cap, largest company about $8 billion (12/2022)
See Russell 2000 FAQ on class webpage
TSX-V (Venture exchange)
See TSX/TSX-V FAQ on class webpage
Almost always single business line junior miners, SPACs, Life Sciences, etc., ‘start-ups’ that typically do not make money aka Cash-Burn securities<br>
Russell 2000 is an index of the 2000 smallest cap stocks in the Russell 3000 approx. 7-10% of US market cap, largest company about $8 billion (12/2022)
See Russell 2000 FAQ on class webpage
TSX-V (Venture exchange)
See TSX/TSX-V FAQ on class webpage
Almost always single business line junior miners, SPACs, Life Sciences, etc., ‘start-ups’ that typically do not make money aka Cash-Burn securities<br>
06
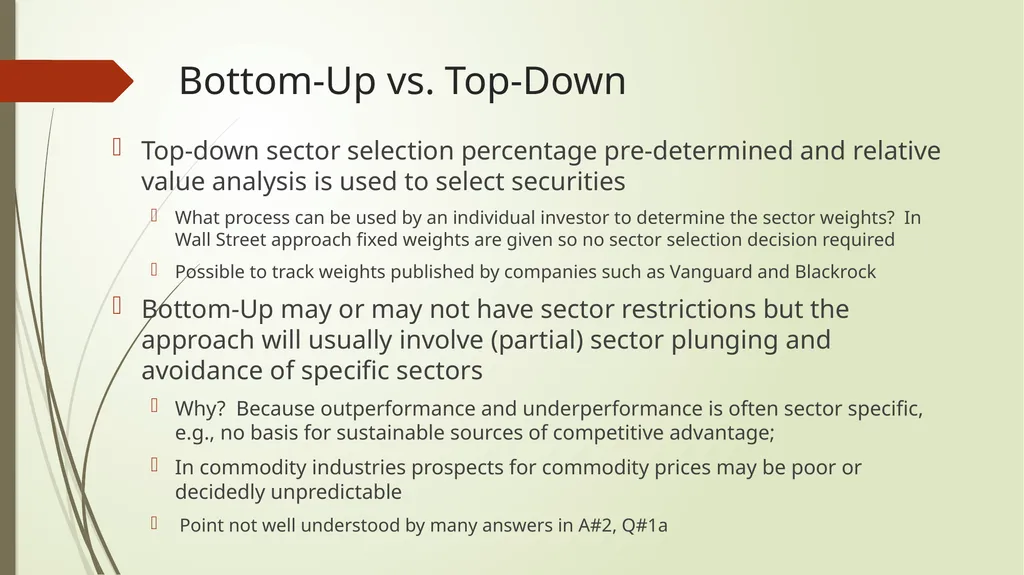
Bottom-Up vs. Top-Down Top-down sector selection percentage pre-determined and relative value analysis is used to select securities
What process can be used by an individual investor to determine the sector weights? In Wall Street approach fixed weights are given so no sector selection decision required
Possible to track weights published by companies such as Vanguard and Blackrock
Bottom-Up may or may not have sector restrictions but the approach will usually involve (partial) sector plunging and avoidance of specific sectors
Why? Because outperformance and underperformance is often sector specific, e.g., no basis for sustainable sources of competitive advantage;
In commodity industries prospects for commodity prices may be poor or decidedly unpredictable
Point not well understood by many answers in A#2, Q#1a<br>
What process can be used by an individual investor to determine the sector weights? In Wall Street approach fixed weights are given so no sector selection decision required
Possible to track weights published by companies such as Vanguard and Blackrock
Bottom-Up may or may not have sector restrictions but the approach will usually involve (partial) sector plunging and avoidance of specific sectors
Why? Because outperformance and underperformance is often sector specific, e.g., no basis for sustainable sources of competitive advantage;
In commodity industries prospects for commodity prices may be poor or decidedly unpredictable
Point not well understood by many answers in A#2, Q#1a<br>
07
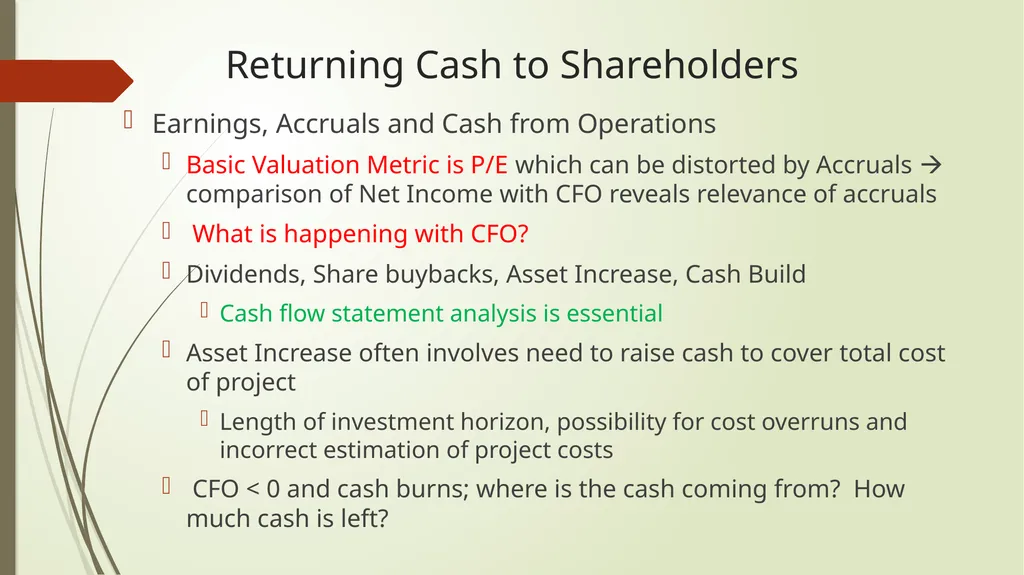
Returning Cash to Shareholders Earnings, Accruals and Cash from Operations
Basic Valuation Metric is P/E which can be distorted by Accruals comparison of Net Income with CFO reveals relevance of accruals
What is happening with CFO?
Dividends, Share buybacks, Asset Increase, Cash Build
Cash flow statement analysis is essential
Asset Increase often involves need to raise cash to cover total cost of project
Length of investment horizon, possibility for cost overruns and incorrect estimation of project costs
CFO < 0 and cash burns; where is the cash coming from? How much cash is left?<br>
Basic Valuation Metric is P/E which can be distorted by Accruals comparison of Net Income with CFO reveals relevance of accruals
What is happening with CFO?
Dividends, Share buybacks, Asset Increase, Cash Build
Cash flow statement analysis is essential
Asset Increase often involves need to raise cash to cover total cost of project
Length of investment horizon, possibility for cost overruns and incorrect estimation of project costs
CFO < 0 and cash burns; where is the cash coming from? How much cash is left?<br>
08
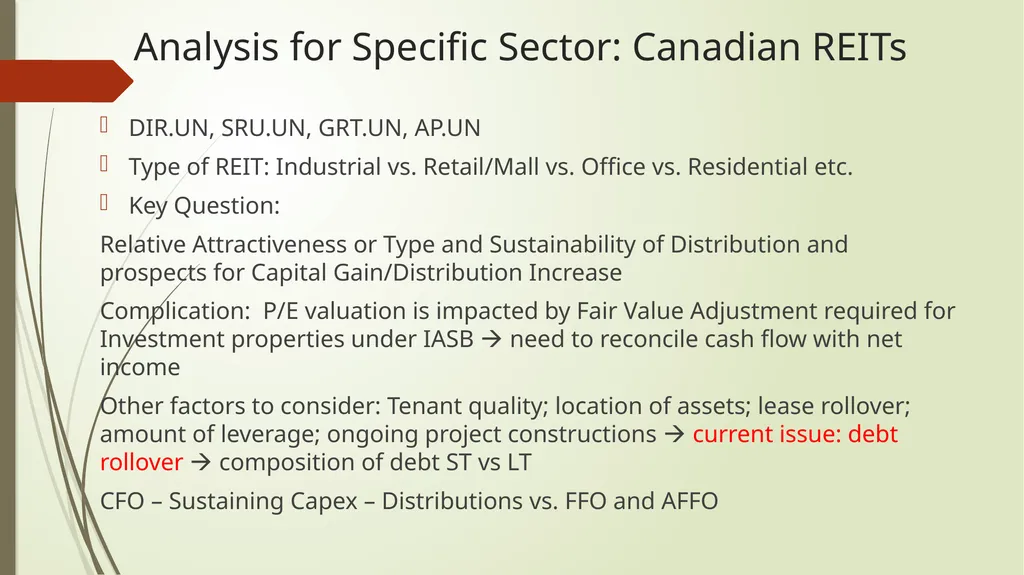
Analysis for Specific Sector: Canadian REITs DIR.UN, SRU.UN, GRT.UN, AP.UN
Type of REIT: Industrial vs. Retail/Mall vs. Office vs. Residential etc.
Key Question:
Relative Attractiveness or Type and Sustainability of Distribution and prospects for Capital Gain/Distribution Increase
Complication: P/E valuation is impacted by Fair Value Adjustment required for Investment properties under IASB need to reconcile cash flow with net income
Other factors to consider: Tenant quality; location of assets; lease rollover; amount of leverage; ongoing project constructions current issue: debt rollover composition of debt ST vs LT
CFO – Sustaining Capex – Distributions vs. FFO and AFFO<br>
Type of REIT: Industrial vs. Retail/Mall vs. Office vs. Residential etc.
Key Question:
Relative Attractiveness or Type and Sustainability of Distribution and prospects for Capital Gain/Distribution Increase
Complication: P/E valuation is impacted by Fair Value Adjustment required for Investment properties under IASB need to reconcile cash flow with net income
Other factors to consider: Tenant quality; location of assets; lease rollover; amount of leverage; ongoing project constructions current issue: debt rollover composition of debt ST vs LT
CFO – Sustaining Capex – Distributions vs. FFO and AFFO<br>
09
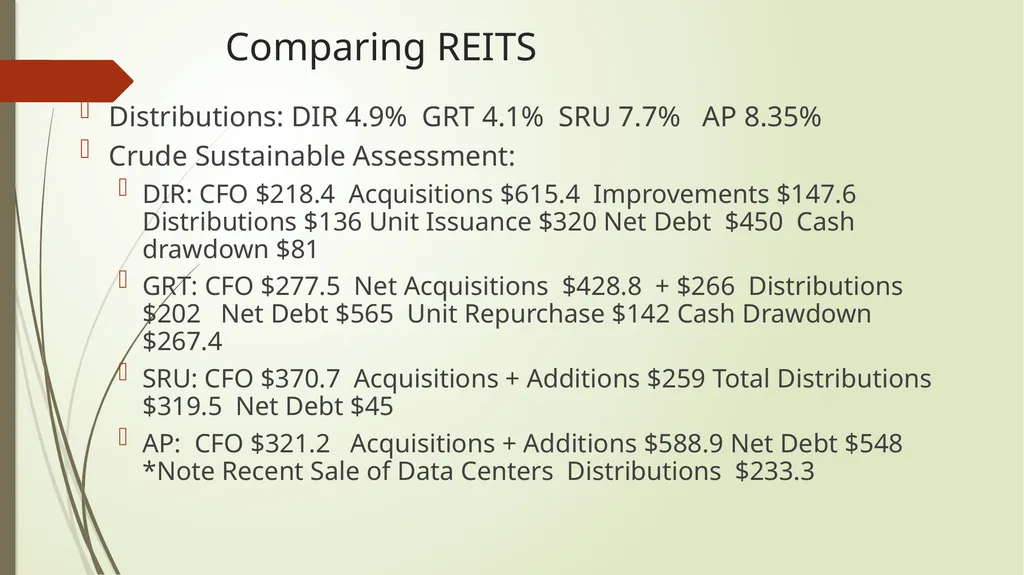
Comparing REITS Distributions: DIR 4.9% GRT 4.1% SRU 7.7% AP 8.35%
Crude Sustainable Assessment:
DIR: CFO $218.4 Acquisitions $615.4 Improvements $147.6 Distributions $136 Unit Issuance $320 Net Debt $450 Cash drawdown $81
GRT: CFO $277.5 Net Acquisitions $428.8 + $266 Distributions $202 Net Debt $565 Unit Repurchase $142 Cash Drawdown $267.4
SRU: CFO $370.7 Acquisitions + Additions $259 Total Distributions $319.5 Net Debt $45
AP: CFO $321.2 Acquisitions + Additions $588.9 Net Debt $548 *Note Recent Sale of Data Centers Distributions $233.3<br>
Crude Sustainable Assessment:
DIR: CFO $218.4 Acquisitions $615.4 Improvements $147.6 Distributions $136 Unit Issuance $320 Net Debt $450 Cash drawdown $81
GRT: CFO $277.5 Net Acquisitions $428.8 + $266 Distributions $202 Net Debt $565 Unit Repurchase $142 Cash Drawdown $267.4
SRU: CFO $370.7 Acquisitions + Additions $259 Total Distributions $319.5 Net Debt $45
AP: CFO $321.2 Acquisitions + Additions $588.9 Net Debt $548 *Note Recent Sale of Data Centers Distributions $233.3<br>
10
Analysis for Specific Sector: Pipelines PPL, TRP, ERP
Relative Attractiveness and Sustainability of Dividends and prospects for Capital Gain/Dividends Increase
Types, locations and age of pipelines + other lines of business (e.g., fractionation)
Large cap ex projects underway + projected completion, cost structure and financing
How much is growth Cap Ex exceeding CFO and method of financing
Political complications<br>
Relative Attractiveness and Sustainability of Dividends and prospects for Capital Gain/Dividends Increase
Types, locations and age of pipelines + other lines of business (e.g., fractionation)
Large cap ex projects underway + projected completion, cost structure and financing
How much is growth Cap Ex exceeding CFO and method of financing
Political complications<br>
11
Analysis for Specific Sector: US Retail COST, HD, WMT
Small to low dividend payout; lower single digit gross margin; competitive industry; grocery vs. merch.
Different business models
How to generate growth to justify capital gains that are needed to drive total return?
International expansion possibilities? Difficulty in applying some business models outside US/N. America
Importance of supply chain and logistics<br>
Small to low dividend payout; lower single digit gross margin; competitive industry; grocery vs. merch.
Different business models
How to generate growth to justify capital gains that are needed to drive total return?
International expansion possibilities? Difficulty in applying some business models outside US/N. America
Importance of supply chain and logistics<br>
12
Example: Walmart P/E = 37+ (a growth multiple) is this an accrual issue? $416B market cap; Price has been grinding higher 1+5+ 10 year as the company expands geographically and into e-commerce+ Health; low dividend
Substantial holdings still with Walton family though only one member left in BofD
Sam’s Club improving
Most Senior Mgmt. with long track records at WMT
At least two with background in international where WMT has had issues in the past<br>
Substantial holdings still with Walton family though only one member left in BofD
Sam’s Club improving
Most Senior Mgmt. with long track records at WMT
At least two with background in international where WMT has had issues in the past<br>
13
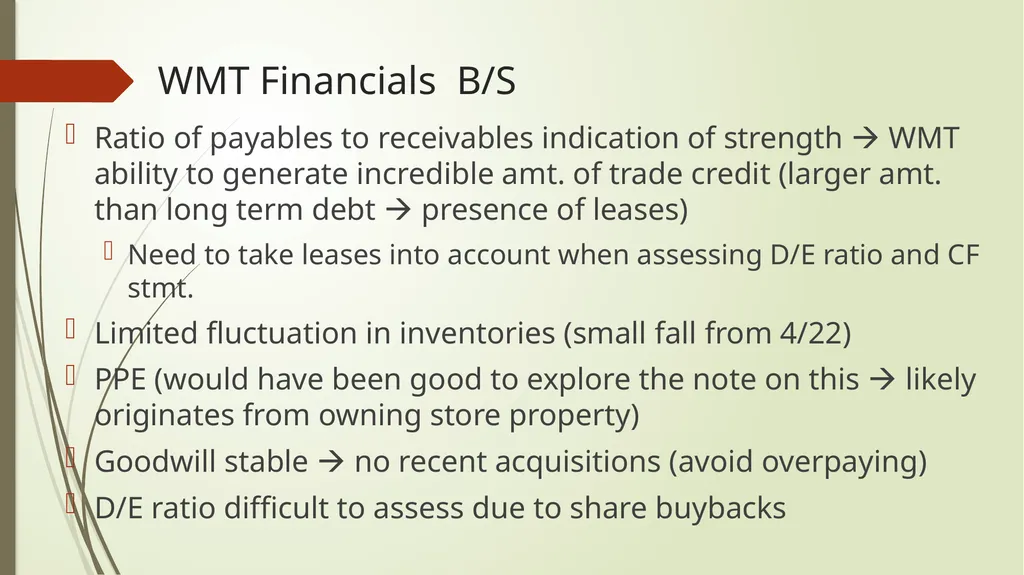
WMT Financials B/S Ratio of payables to receivables indication of strength WMT ability to generate incredible amt. of trade credit (larger amt. than long term debt presence of leases)
Need to take leases into account when assessing D/E ratio and CF stmt.
Limited fluctuation in inventories (small fall from 4/22)
PPE (would have been good to explore the note on this likely originates from owning store property)
Goodwill stable no recent acquisitions (avoid overpaying)
D/E ratio difficult to assess due to share buybacks<br>
Need to take leases into account when assessing D/E ratio and CF stmt.
Limited fluctuation in inventories (small fall from 4/22)
PPE (would have been good to explore the note on this likely originates from owning store property)
Goodwill stable no recent acquisitions (avoid overpaying)
D/E ratio difficult to assess due to share buybacks<br>
14
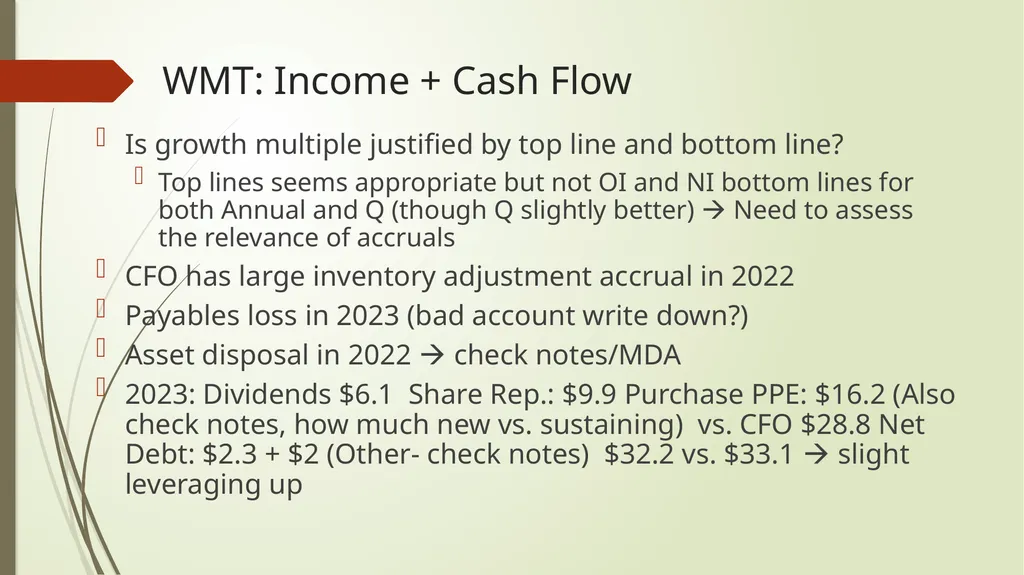
WMT: Income + Cash Flow Is growth multiple justified by top line and bottom line?
Top lines seems appropriate but not OI and NI bottom lines for both Annual and Q (though Q slightly better) Need to assess the relevance of accruals
CFO has large inventory adjustment accrual in 2022
Payables loss in 2023 (bad account write down?)
Asset disposal in 2022 check notes/MDA
2023: Dividends $6.1 Share Rep.: $9.9 Purchase PPE: $16.2 (Also check notes, how much new vs. sustaining) vs. CFO $28.8 Net Debt: $2.3 + $2 (Other- check notes) $32.2 vs. $33.1 slight leveraging up<br>
Top lines seems appropriate but not OI and NI bottom lines for both Annual and Q (though Q slightly better) Need to assess the relevance of accruals
CFO has large inventory adjustment accrual in 2022
Payables loss in 2023 (bad account write down?)
Asset disposal in 2022 check notes/MDA
2023: Dividends $6.1 Share Rep.: $9.9 Purchase PPE: $16.2 (Also check notes, how much new vs. sustaining) vs. CFO $28.8 Net Debt: $2.3 + $2 (Other- check notes) $32.2 vs. $33.1 slight leveraging up<br>
15
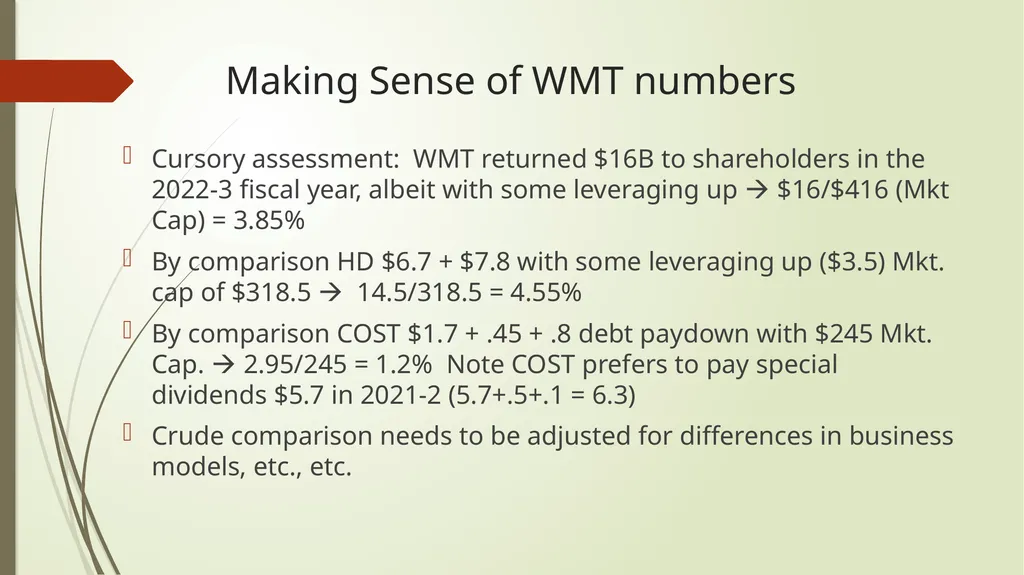
Making Sense of WMT numbers Cursory assessment: WMT returned $16B to shareholders in the 2022-3 fiscal year, albeit with some leveraging up $16/$416 (Mkt Cap) = 3.85%
By comparison HD $6.7 + $7.8 with some leveraging up ($3.5) Mkt. cap of $318.5 14.5/318.5 = 4.55%
By comparison COST $1.7 + .45 + .8 debt paydown with $245 Mkt. Cap. 2.95/245 = 1.2% Note COST prefers to pay special dividends $5.7 in 2021-2 (5.7+.5+.1 = 6.3)
Crude comparison needs to be adjusted for differences in business models, etc., etc.<br>
By comparison HD $6.7 + $7.8 with some leveraging up ($3.5) Mkt. cap of $318.5 14.5/318.5 = 4.55%
By comparison COST $1.7 + .45 + .8 debt paydown with $245 Mkt. Cap. 2.95/245 = 1.2% Note COST prefers to pay special dividends $5.7 in 2021-2 (5.7+.5+.1 = 6.3)
Crude comparison needs to be adjusted for differences in business models, etc., etc.<br>
16
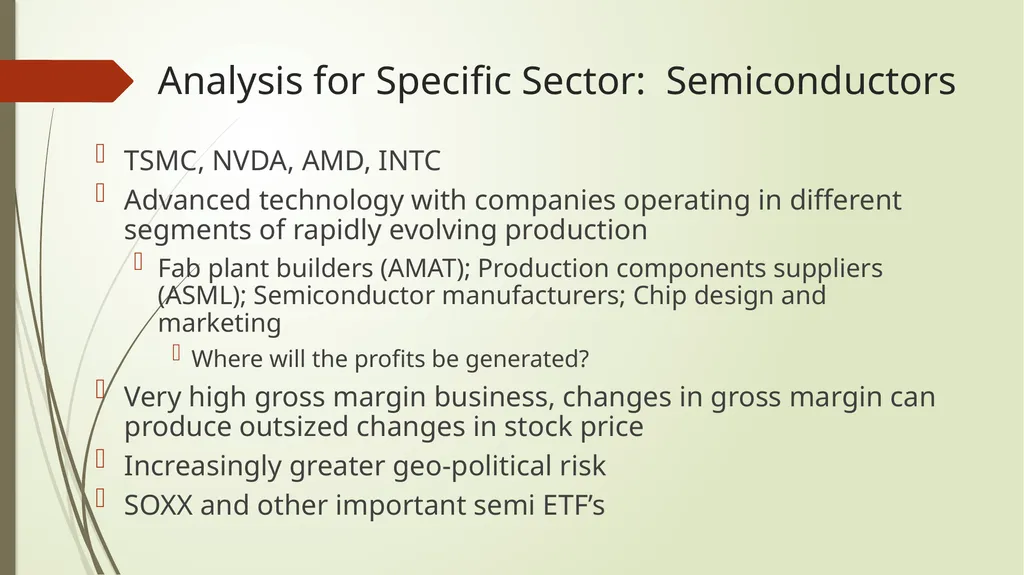
Analysis for Specific Sector: Semiconductors TSMC, NVDA, AMD, INTC
Advanced technology with companies operating in different segments of rapidly evolving production
Fab plant builders (AMAT); Production components suppliers (ASML); Semiconductor manufacturers; Chip design and marketing
Where will the profits be generated?
Very high gross margin business, changes in gross margin can produce outsized changes in stock price
Increasingly greater geo-political risk
SOXX and other important semi ETF’s<br>
Advanced technology with companies operating in different segments of rapidly evolving production
Fab plant builders (AMAT); Production components suppliers (ASML); Semiconductor manufacturers; Chip design and marketing
Where will the profits be generated?
Very high gross margin business, changes in gross margin can produce outsized changes in stock price
Increasingly greater geo-political risk
SOXX and other important semi ETF’s<br>
17
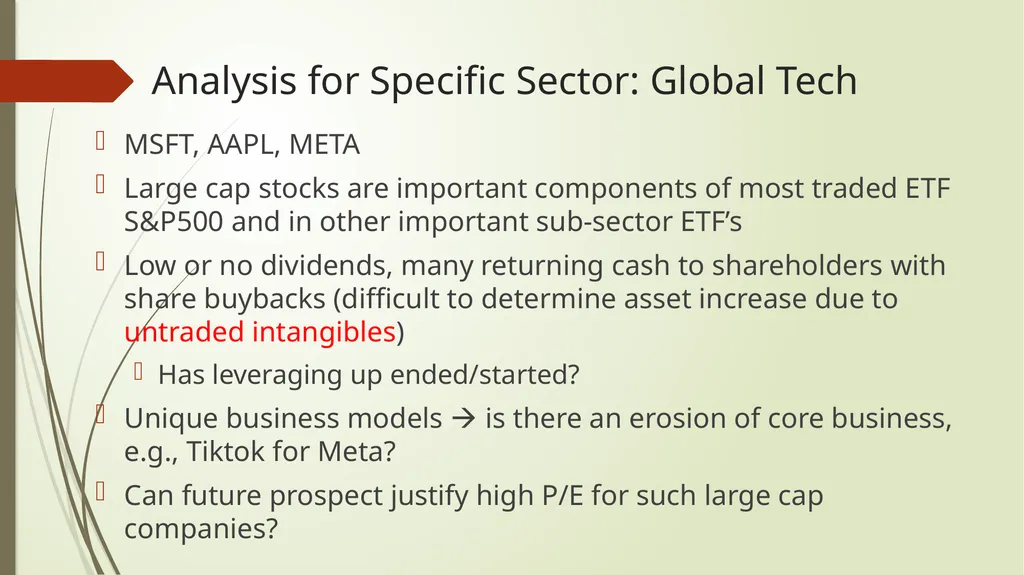
Analysis for Specific Sector: Global Tech MSFT, AAPL, META
Large cap stocks are important components of most traded ETF S&P500 and in other important sub-sector ETF’s
Low or no dividends, many returning cash to shareholders with share buybacks (difficult to determine asset increase due to untraded intangibles)
Has leveraging up ended/started?
Unique business models is there an erosion of core business, e.g., Tiktok for Meta?
Can future prospect justify high P/E for such large cap companies?<br>
Large cap stocks are important components of most traded ETF S&P500 and in other important sub-sector ETF’s
Low or no dividends, many returning cash to shareholders with share buybacks (difficult to determine asset increase due to untraded intangibles)
Has leveraging up ended/started?
Unique business models is there an erosion of core business, e.g., Tiktok for Meta?
Can future prospect justify high P/E for such large cap companies?<br>
18
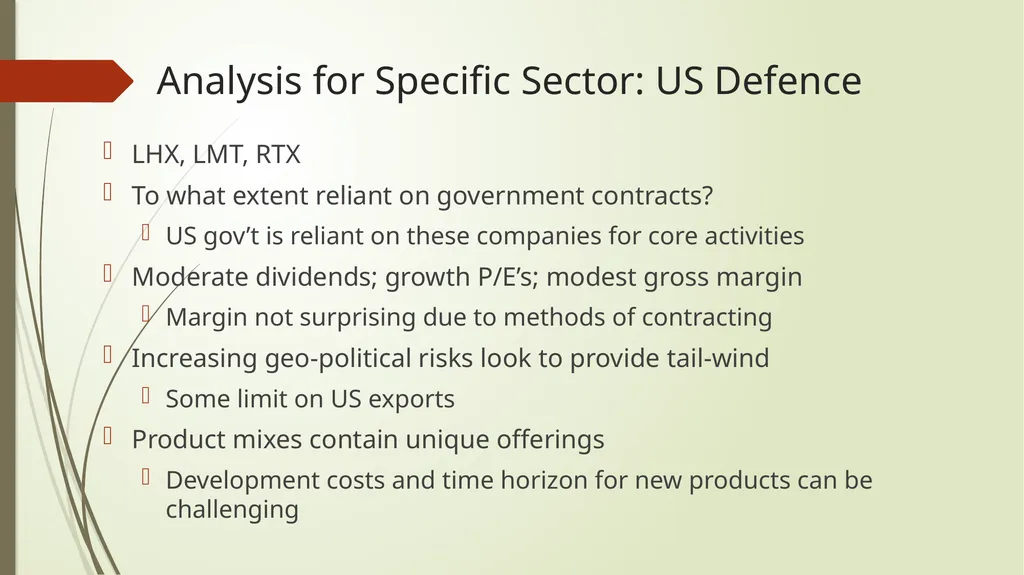
Analysis for Specific Sector: US Defence LHX, LMT, RTX
To what extent reliant on government contracts?
US gov’t is reliant on these companies for core activities
Moderate dividends; growth P/E’s; modest gross margin
Margin not surprising due to methods of contracting
Increasing geo-political risks look to provide tail-wind
Some limit on US exports
Product mixes contain unique offerings
Development costs and time horizon for new products can be challenging<br>
To what extent reliant on government contracts?
US gov’t is reliant on these companies for core activities
Moderate dividends; growth P/E’s; modest gross margin
Margin not surprising due to methods of contracting
Increasing geo-political risks look to provide tail-wind
Some limit on US exports
Product mixes contain unique offerings
Development costs and time horizon for new products can be challenging<br>