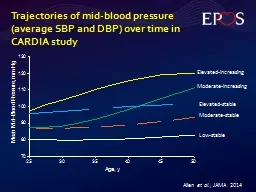
PPT-Trajectories of mid-blood pressure (average SBP and DBP) over time in CARDIA study

Author : CountryBumpkin | Published Date : 2022-08-04

Elevatedincreasing Moderateincreasing Elevatedstable Lowstable Allen et al JAMA 2014 Moderatestable

Presentation Embed Code

Download Presentation

Download Presentation The PPT/PDF document "Trajectories of mid-blood pressure (aver..." is the property of its rightful owner. Permission is granted to download and print the materials on this website for personal, non-commercial use only, and to display it on your personal computer provided you do not modify the materials and that you retain all copyright notices contained in the materials. By downloading content from our website, you accept the terms of this agreement.

Trajectories of mid-blood pressure (average SBP and DBP) over time in CARDIA study: Transcript


Elevatedincreasing Moderateincreasing Elevatedstable Lowstable Allen et al JAMA 2014 Moderatestable. 20 1027200 1048830 1054860 1081860 1126920 1137390 1180200 1192470 1229340 1282710 O7 826440 864840 882600 896730 922290 947580 976770 1005900 1035120 1126920 1204380 O6 612540 672960 717120 717120 719850 750720 754770 754770 797670 873510 918030 O5 Modeling and Analysis. By: Shahab Helmi. Outline. Larger datasets are becoming available from GPS, GSM, RFID, and other sensors.. Interest in movement has shifted from . raw movement data analysis . to more . in . Hypertension. From ESH 2016 | POS 4C:. Sverre. E. . Kjeldsen. , MD. Oslo University Hospital, . Ullevaal. , Oslo, Norway. Overview. Greater protection of renal function with lower average on-treatment systolic blood pressure (SBP) in patients with hypertension and echocardiographic (ECG)-confirmed left ventricular hypertrophy (LVH) was found in post hoc analysis of the LIFE (Losartan Intervention For Endpoint reduction) study . Ngo Minh . Triet. , MD. Department of Neurology, . University of Medicine and Pharmacy. Introduction. Intracerebral. . hemorrhage (ICH) results from the rupture of an . intracerebral. vessel. .. 10-35% percent of all strokes (in USA). . ;. some. do’s . and. . don’ts. Hans Burgerhof. Medical. . S. tatistics. and . Decision. Making. Department. of . Epidemiology. UMCG. . Help! Statistics! Lunchtime Lectures. When?. Where?. What?. Clinical Pharmacy Manager, Cardiology. Montefiore Medical Center. 5/15/2018. Reaching for the “New Normal” with the 2017 ACC/AHA Hypertension Guideline. Disclosures. The presenter has no conflicts of interest to disclose. Getting to Blood Pressure Goal Alex Krist MD MPH Family Physician Virginia Commonwealth University Member, US Preventive Services Task Force ahkrist@vcu.edu 1 Disclaimer Although I am a member of the U.S. Preventive Services Task Force (USPSTF), materials provided in this presentation reflect my individual views and do not represent the views or recommendations of the USPSTF. The overall presentation should not be attributed to the USPSTF. Atul. R. . Chugh. , MD, FACC, RPVI. Clinical Hypertension Specialist, American Society of Hypertension. 2017 High Blood Pressure Guideline . Writing Committee. Paul K. Whelton, MB, MD, MSc, FAHA, . Chair. 4Gize( )istheEthiopianwordfortime. RelatedWork. ApproachesliketheDBpediaWaybackMachine[4]allowtore-trievedataatacertaintimestamp(providedbytheuser).Otherapproaches(e.g.,[7])accesshistoricaldatavia(HTT Why We Should Understand Them. March 26, 2018. J. Clark Maness, EI. Staff Professional, WithersRavenel. PRESENTATION. 2. TOPICS. 3. Why disinfect?. Needed to prevent microbial, waterborne diseases. . The system pressure values are, for technical reasons, dependent . on:. Measuring. . method. . used. Non-. invasive. . methods. :. auscultatory. oscillometry. ultrasound. photopletysmography. Invasive. From ESH 2016 | POS 3C:. Chiara . Lorenzi. , MD. AOU, University of Florence, Italy. Overview. Observational study of older adults with cognitive impairment showed that high-normal levels of systolic blood pressure (SBP) of 130-145 . (IX.) Non-invasive methods of blood pressure measurement . Phys. iology - . practicals. Arterial blood pressure curve. SBP. Systolic blood pressure. a. rea above MAP. area under MAP. DBP. Diastolic blood pressure. Proof-of-Concept Presentation and Demonstration. Shawn C. Williams and Charles Collins. July 2019. Topics. Introduction. Why SBP?. USDA Applications. Budget Status and Forecasting (BSF). Allotment Planning and Management (APM).

Download Document

Here is the link to download the presentation.
"Trajectories of mid-blood pressure (average SBP and DBP) over time in CARDIA study"The content belongs to its owner. You may download and print it for personal use, without modification, and keep all copyright notices. By downloading, you agree to these terms.

Related Documents