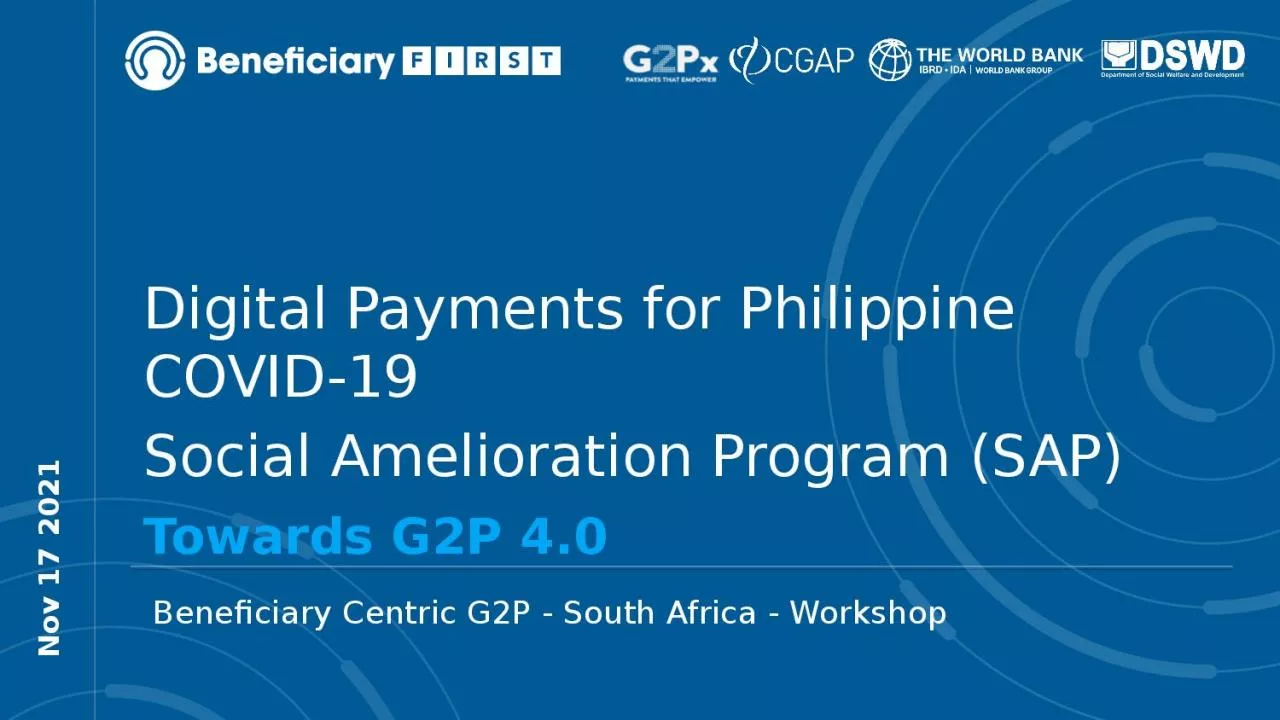
/
Nov 17 2021 Beneficiary Centric G2P - South Africa - Workshop Nov 17 2021 Beneficiary Centric G2P - South Africa - Workshop

Nov 17 2021 Beneficiary Centric G2P - South Africa - Workshop - PowerPoint Presentation

DateMeDarling
DateMeDarling . @DateMeDarling
Follow
342 views
Uploaded On 2022-08-04

Nov 17 2021 Beneficiary Centric G2P - South Africa - Workshop - PPT Presentation

Digital Payments for Philippine COVID19 Social Amelioration Program SAP Towards G2P 40 Context PHL Government introduced a large scale COVID19 response Social Amelioration Program SAP to cover over 3 out of 4 households in the country ID: 935810

beneficiaries sap data digital sap beneficiaries digital data fsp time payment fsps program 100 g2p financial account beneficiary income

Share:

Link:

Embed:

Download Presentation from below link

Download Presentation The PPT/PDF document "Nov 17 2021 Beneficiary Centric G2P - So..." is the property of its rightful owner. Permission is granted to download and print the materials on this web site for personal, non-commercial use only, and to display it on your personal computer provided you do not modify the materials and that you retain all copyright notices contained in the materials. By downloading content from our website, you accept the terms of this agreement.


Presentation Transcript

Slide1

Nov 17 2021

Beneficiary Centric G2P - South Africa - Workshop

Digital Payments for Philippine COVID-19 Social Amelioration Program (SAP)

Towards G2P 4.0

Slide2

Context

PHL Government introduced a large scale COVID-19 response – Social Amelioration Program (SAP) to cover over 3 out of 4 households in the country

Pantawid Pamilyang Pilipino Program (4Ps): country’s flagship safety net with Conditional Cash Transfers (CCTs) that covers about 1/5 of households, for which digital payments have been made (through

LandBank

Cash cards). 4Ps beneficiaries automatically part of SAP, but no straightforward mechanisms to identify other beneficiaries beyond 4Ps.

Listahanan

: Country’s registry (based on census sweep) was outdated

PhilSys

: Country’s foundational national ID was at nascent stage

Manual process introduced with paper application and physical cash delivery

Slide3

Context: urgent need for digital G2P payments

Slide4

Context

WB’s Beneficiary FIRST SP project (US$ 600m) was brought in

FIRST: Fast, Innovative, and Responsive Service Transformation

Short term COVID-19 response and support for 4Ps

Medium term SP systems strengthening: Digital ID, digital data governance, and digital payments

Our studies – part of digital G2P agenda

Slide5

Research Approach

OBJECTIVE:

Document lessons learned from the implementation of SAP 2 (2

nd

tranche of social amelioration program), to inform transition to future digital G2P payments delivery (G2P 4.0)

FOCUS AREAS:

Beneficiary registration and payment delivery (successes & challenges)

METHODOLOGY:

Qualitative

(desk review + KIIs with DSWD (4Ps NPMO, FMS, PMB), BSP, and FSPs [Robinsons Bank, Union Bank, RCBC, GCash and PayMaya]) + Quantitative IPA survey study on beneficiary experience

DATA COLLECTION TIMEFRAME: Interviews conducted from Nov 2020 to January 2021, and Surveys in Feb-April 2021 (IPA-WB study)

Slide6

What worked well…

Clear eligibility criteria

for participating FSPs were established and

multilateral MOA with 6 FSPs signed

– DSWD and BSP joint leadership for communication and transparency

Online registration:

Introduced a web-based platform i.e., ReliefAgad with 2 million applicants who self-registered and indicated preferred payment channel

Proven payment infrastructure

(i.e., PESONet, InstaPay) and

support of FSPs

in opening bank/e-money accounts for beneficiaries facilitated digital payments – increased access points for beneficiaries & reduced physical interactions, opened door for financial inclusion

Supported scaling-up of SAP coverage:

Catered to an expanded pool of beneficiaries i.e., additional 5.3 million waitlisted households. DSWD estimated

11 million SAP2 beneficiaries who received benefits through digital channels including 4Ps beneficiaries

Slide7

What can be improved…

Low quality of

beneficiary registration data and information system

Majority of invalid or duplicative data from SAP1 paper-based forms were inherited in SAP2

- cleaning and checking data was an unexpected increased in workload for FSPs and delayed the payment processReliefAgad by design used beneficiary SAC form and barcode which required field-based verification/deduplication…missed the opportunity to build IT system that can verify applicant identity with functional IDs and to cross-reference with other databases of COVID-19 programs

30-35% payroll data with duplicate mobile numbers tagged by FSPs as “unsuccessful disbursements” – DSWD had to re-assigned beneficiaries to RCBC or processed payments manually

Lack of

government-issued ID

prevented beneficiaries from easily cashing out

Slide8

SAP2 Beneficiary Journey Map (Banks)

Slide9

SAP2 Beneficiary Journey Map (EMIs)

Slide10

Quantitative Survey

Slide11

SAC Data from ICTMS

HH demographic information of digital and non-digital beneficiaries

E.g. Family roster, monthly income, work, phone number,

etc

FSP Data from FMS

Cash transfer information of digital beneficiaries

E.g. Date and time of cash transfer, status, amount disbursed

Quantitative Survey Sample:

Merging administrative data

No unique Identifier

Slide12

SAC Data from ICTMS was clean but had some issues

~1.5 million households had the same phone number as someone else

~1 million households have more than Php 100,000 (USD 2K) monthly income (vs. Php5-8K)

Slide13

FSP data came from hundreds of different XLS/CSV files with varying formats

Slide14

How do you tell if two observations refer to the same household? What are reasonable matches?

Joel O Ambrosio

11/21/1978

Brgy

. VI

Joel

Olivar

Ambrosio

11/12/1978

Brgy

. VI

vs

*

This is a fictional example only

Since there was no unique household ID in both datasets, there was

no straightforward way

to merge the datasets and remove duplicates.

Slide15

uses names, date of birth, barangay information, etc. to carry out a

fuzzy merge the two data sets.

Assign matching score (scaled 0-1)For matching score <0.95, reduce the set of variables to be matched and run the fuzzy mergeRetain reasonable matches with slight variations (e.g. Jr vs Junior, 01/01/1987 vs 11/01/1987)

Repeat the process

Fuzzy Matching

Slide16

After four weeks, about 65% of FSP data matched


FSP

SAC

Matched

 Matched over FSP

REGION III

1,545,551

1,742,365

994,158

64%

REGION IV-A

1,725,703

1,867,151

1,076,325

62%

REGION V

133,728

183,456

123,667

92%

REGION VII

401,615

661,736

287,243

72%

TOTAL

3,806,597

4,454,708

2,481,393

65%

Slide17

Financial service providers

Profile of Respondents

Majority of beneficiaries received their SAP allowance from

GCash

and

StarPay

.

Slide18

Phone Ownership

Profile of Respondents

Of those who own a phone,

69% own a smartphone

81% of respondents own a phone

All respondents

By gender

Slide19

Type and frequency of phone use

Profile of Respondents

N=5090

N=5090

Slide20

Mobile application account ownership

Profile of Respondents

For those with access to a phone

, slightly more women than men own personal accounts in mobile apps.

By gender

N=5090

Slide21

Main income source

Financial Awareness, Capability and Health

Beneficiaries’ main income source come from

earnings

; this is followed by remittances.

Main source of income

Means of receiving income

Almost 90% of beneficiaries receive their income through

cash

. Only 6% receive their income in a bank, 1% in a mobile money account.

Slide22

Availability of emergency funds (Php 10,000 about USD 200)

Financial Awareness, Capability and Health

26% of respondents say they would not be able

pay off an unexpected expenses of Php

10,000 within the next 30 days.

Of those that could, 79% say they it would be very difficult.

Slide23

Recollection of their own FSP is Low

Program awareness

69% of respondents named another company or service provider instead of their FSP.

FSP*

N

Named another company instead

of FSP**

F6

1,570

22%

F5

1,444

90%

F4

915

97%

F3

809

100%

F2

291

98%

F1

51

33%

Total

5,080

69%

*FSP according to the administrative data.

**This may not necessarily be an account under the FSP.

Slide24

Use of SAP Financial Account

Program awareness


Has an account for SAP

F1

531

34%

F2

96

33%

F3

31

4%

F6

1

2%

F5

93

6%

F4

37

4%

Recollection of owning an account with an FSP for their SAP allowance varies by FSP. Of those with an account, few report available features other than for SAP.

N=789

Slide25

Payment withdrawal

Program Experience

62%

collected payment by themselves

Almost all

(99.8%) withdrew

entire SAP amount

93%

withdrew SAP in

one trip

Of those reported having difficulty with SAP withdrawal, 29% cited

long queue time

63% reported having

no difficulties

with SAP withdrawal

74% had to travel

outside their barangay

to the payment point

Slide26

Travel time and queueing, but significant differences across FSPs

Program Experience


F1

F2

F3

F4

F5

F6

Overall

N


1575

1446

917

809

292

51

5090

Travel time in

Mean

17.14

24.40

22.45

19.82

20.86

19.62

20.85

 mins (one way)

Median

10.00

20.00

20.00

15.00

15.00

15.00

15.00

Queue time

Mean

69.53

194.69

127.77

127.25

69.74

180.96

126.56

 in mins

Median

20.00

120.00

60.00

90.00

30.00

120.00

60.00

Time at payment

Mean

9.78

10.43

9.27

8.88

9.04

12.04

9.71

 desk in mins

Median

5.00

5.00

5.00

5.00

5.00

10.00

5.00

Total time cost in hours*

Mean

1.87

4.25

3.01

2.93

1.99

3.87

2.96


Median

1.08

3.12

2.18

2.25

1.33

3.17

2.00

*The time cost is the average of the sum of the queue time, time at payment desk and twice the travel time.

Slide27

Withdrawal fees and travel costs, but significant differences across FSPs

Program Experience

Beneficiaries spent an average

Php 132 (Php 100)

to withdraw their SAP payment. There is no significant difference in total cost between FSPs.


F1

F2

F3

F4

F5

F6

Overall

N


1575

1446

917

809

292

51

5090

Withdrawal fee

Mean

96.54

57.22

52.70

50.82

79.03

49.35

68.05


Median

100.00

50.00

50.00

50.00

50.00

50.00

50.00

Travel fee (one way)

Mean

21.61

41.15

34.06

38.67

25.23

39.02

32.58


Median

0.00

25.00

20.00

25.00

0.00

30.00

20.00

Total financial cost*

Mean

136.69

138.08

120.29

128.45

134.86

114.19

132.44


Median

110.00

100.00

90.00

110.00

100.00

100.00

100.00

* The financial cost is the average of the sum of the withdrawal fee and twice the travel fee.

Slide28

Policy Recommendations

Slide29

Moving Toward G2P Payment 4.0

SAP 1

4Ps

SAP 2

Slide30

G2P 4.0 Delivery System: Shared and Inclusive Infrastructure

Slide31

Recommendation 1

Shift to disbursing both regular and temporary aid through digital channels due to positive experience and benefits

Policy Recommendations

Slide32

Recommendation 2

Continue collaborating with FSPs to foster awareness

Standardize onboarding and account processes

Develop communication strategy to support FSP-usage

Support efforts to improve digital financial literacy

Policy Recommendations

Slide33

Recommendation 3

Improve the quality and integrity of the data framework:

Unified, standardized database and management information systems

Use

PhilSys for identification and verification of beneficiaries

Policy Recommendations

Slide34

Thank you…