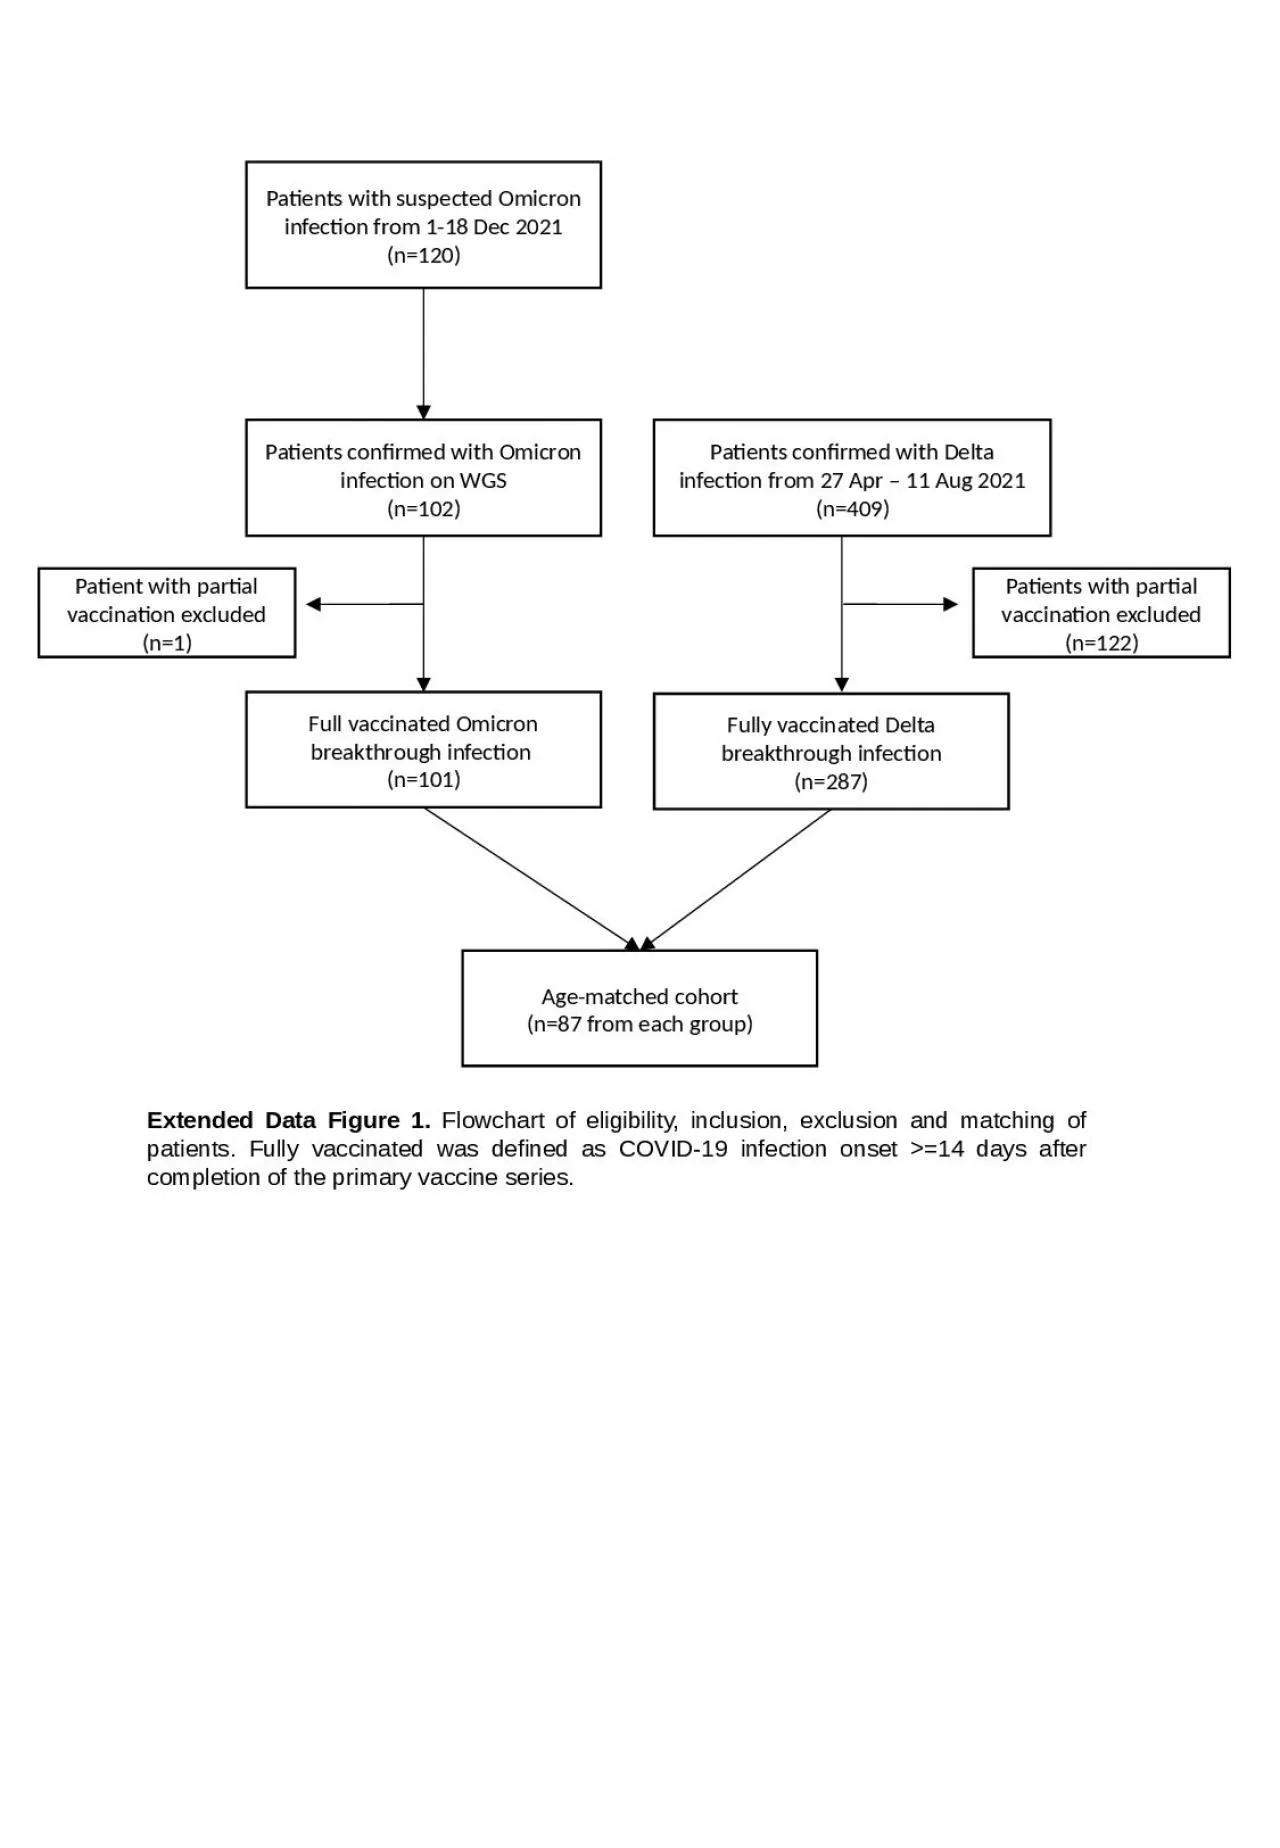
/
Patients with suspected Omicron infection from 1-18 Dec 2021 Patients with suspected Omicron infection from 1-18 Dec 2021

Patients with suspected Omicron infection from 1-18 Dec 2021 - PowerPoint Presentation

DateMeDarling
DateMeDarling . @DateMeDarling
Follow
352 views
Uploaded On 2022-08-03

Patients with suspected Omicron infection from 1-18 Dec 2021 - PPT Presentation

n120 Patients confirmed with Omicron infection on WGS n102 Full vaccinated Omicron breakthrough infection n101 Patients confirmed with Delta infection from 27 Apr 11 Aug 2021 n409 ID: 934454

figure breakthrough data omicron breakthrough figure omicron data cells infection patients extended vaccine acute gating vaccinated delta presented blood

Share:

Link:

Embed:

Download Presentation from below link

Download Presentation The PPT/PDF document "Patients with suspected Omicron infectio..." is the property of its rightful owner. Permission is granted to download and print the materials on this web site for personal, non-commercial use only, and to display it on your personal computer provided you do not modify the materials and that you retain all copyright notices contained in the materials. By downloading content from our website, you accept the terms of this agreement.


Presentation Transcript

Slide1

Patients with suspected Omicron infection from 1-18 Dec 2021(n=120)

Patients confirmed with Omicron infection on WGS(n=102)

Full vaccinated Omicron breakthrough infection (n=101)

Patients confirmed with Delta infection from 27 Apr – 11 Aug 2021(n=409)

Fully vaccinated Delta breakthrough infection(n=287)

Age-matched cohort(n=87 from each group)

Extended Data

Figure 1.

Flowchart of eligibility, inclusion, exclusion and matching of patients. Fully vaccinated was defined as COVID-19 infection onset >=14 days after completion of the primary vaccine series.

Patient with partial vaccination excluded (n=1)

Patients with partial vaccination excluded (n=122)

Slide2

x Negative viral culture (symptomatic)

Positive viral culture (symptomatic)

x

Negative viral culture (asymptomatic)

Positive viral culture (asymptomatic)

Extended Data Figure 2.

Viral cultures and PCR Ct values correlated with day of illness

Slide3

Extended Data Figure 3. Specific IgG antibodies against full length S protein.

Plasma samples were collected from vaccinated healthy controls (n=85), Delta vaccine breakthrough acute infections (n=59) and Omicron vaccine breakthrough acute infection (n=17). (A) IgG against full length SARS-CoV2 S protein expressed on the surface of HEK293T cells, in

vaccinated healthy controls, Delta vaccine breakthrough cases and Omicron vaccine breakthrough infections, were presented as scatter plots. Data are shown as mean ± SD. Statistical analysis was carried out using Kruskal-Wallis tests, followed by post hoc Dunn’s multiple comparison tests. (B)

Specific IgG antibodies against full length S protein in plasma samples collected from Omicron breakthrough cases who received >2 vaccination doses, compared to those received only 2 doses of vaccines. Data are shown as mean ± SD. Statistical analysis was carried out using Mann-Whitney U test. (***p < 0.001).

A

B

Slide4

Extended Data Figure 4. Whole blood immunophenotyping of Omicron breakthrough cases.

Absolute counts of circulating natural killer cells, basophils, eosinophils and dendritic cells in vaccinated healthy controls (n=13), Delta vaccine breakthrough acute infections (n=15) and Omicron vaccine breakthrough acute infection (n=17). Data were presented as scatter plots. Kruskal-Wallis test with post-hoc Dunn's multiple comparisons test

was performed to compare the cellular profiles among the three groups. (*p < 0.05; **

p < 0.01).

Total NK cells

NK CD56 Bright

NK CD56 Dim

Basophils

Eosinophils

Dendritic cells

Slide5

Extended Data Figure 4. Representative flow cytometry gating strategy for whole blood immunophenotyping of circulating monocytes, neutrophils, natural killer cells, basophils, eosinophils and dendritic cells.

25µL of fresh whole blood from acute Omicron breakthrough patients were stained with the antibodies described in Supplementary Table 2. Gating was performed in

FlowJo as presented in this figure.

Slide6

Extended Data Figure 5. Representative flow cytometry gating strategy for whole blood immunophenotyping of T cell compartments.

25µL of fresh whole blood from acute Omicron breakthrough patients were stained with the antibodies described in Supplementary Table 2. Gating was performed in

FlowJo as presented in this figure.

Slide7

Extended Data Figure 6. Representative gating strategy for the characterization of IFN-

γ, IL-2, TNF-⍺, IL-4, IL-6, IL-10, IL-17a and Granzyme B expression of CD4+ and CD8+ T cells in isolated PBMCs of COVID-19 patients by flow cytometry upon stimulation.

Gating was performed in FlowJo as presented in this figure.