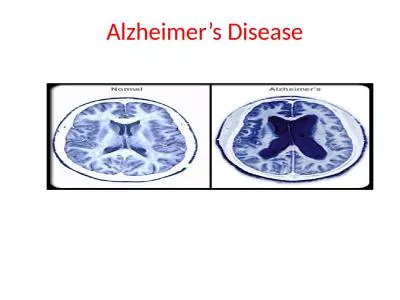
John C Morris MD On behalf of MW Weiner L Beckett T Benzinger D Coble AM Fagan BA Gordon P Massoumzadeh L McCue N Saito L Shaw C Xiong VD Buckles and all Dominantly Inherited Alzheimer Network DIAN and Alzheimer Disease Neuroimaging Initiative ADNI ID: 932099
Download Presentation The PPT/PDF document "AAIC 2018 Biomarker Rates of Change in A..." is the property of its rightful owner. Permission is granted to download and print the materials on this web site for personal, non-commercial use only, and to display it on your personal computer provided you do not modify the materials and that you retain all copyright notices contained in the materials. By downloading content from our website, you accept the terms of this agreement.
Slide1
AAIC 2018Biomarker Rates of Change in Autosomal Dominant Versus “Sporadic” Alzheimer Disease
John C. Morris, MDOn behalf of MW Weiner, L Beckett, T Benzinger, D Coble, AM Fagan, BA Gordon, P Massoumzadeh, L McCue, N Saito, L Shaw, C Xiong, VD Buckles, and all Dominantly Inherited Alzheimer Network (DIAN) and Alzheimer Disease Neuroimaging Initiative (ADNI) Investigators
Slide2DisclosuresThe DIAN-ADNI Comparison Study is funded by:Alzheimer’s Association
Anonymous FoundationNational Institute on AgingAlzheimer Disease Neuroimaging Initiative, U19 AG024904Dominantly Inherited Alzheimer Network, UF1 AG032438Roche Diagnostics (Elecsys)JCM has no pertinent disclosures
Slide3Autosomal Dominant AD (ADAD) & “Sporadic” Late Onset AD (LOAD)Both ADAD and LOAD have altered Aβ
42 homeostasis:LOAD is characterized by underclearance of Aβ42 (Patterson et al., Ann Neurol, 2015)ADAD mutations result in relative Aβ42 overproduction (St. George-Hyslop, Biol Psychiatry, 2000; Potter et al., Sci Trans Med, 2013)If ADAD and LOAD share the same pathophysiology, will their clinical and pathological phenotypes be similar and will they respond similarly to mechanism-based therapies?ADNI (since 2004) and DIAN (since 2008) are multi-center, international studies using multimodal biomarkers to study “sporadic” late-onset AD (ADNI) and autosomal dominant AD (DIAN)
Slide4ADAD Compared to LOAD
Measure
ADAD
LOAD
Clinical presentation
Amnestic predominant
Cognitive
deterioration
Memory, frontal/executive,
generalized cognitive decline
Memory, frontal/executive,
generalized cognitive declinePathology – Identity and sequenceAmyloid plaques & tau tangles > Lewy bodiesAmyloid plaques & tau tangles > Lewy bodies > TDP-43 > OtherMRIHippocampal and whole brain atrophyHippocampal & whole brain atrophyPIB PETCortex plus basal gangliaCortexFDG PETParieto-occipital hypometabolismParieto-occipital hypometabolismCSF Aβ42Decreased by 50%Decreased by 50%CSF tauIncreased by 2-foldIncreased by 2-foldSymptom onsetMid-life or “Early onset”Late-life or “Late onset” Disease duration~ 9.7 years~ 8-10 years
Some mutations produce additional symptoms including seizures, spastic
paraparesis
and extrapyramidal signs.
Slide5Analytic ChallengesAge
When cohort age ranges do not overlap, “adjusting for age” can be done within each cohort but not between the two cohortsIn response, the cohorts were anchored on dementia progression using CDR-SumBox (SB) ≥1 to permit cognitive test results to serve as outcome measures; participants were aligned on CDR-SB=1 to compare rates of change before and after this anchor point
Neuropathological HeterogeneityAD rarely occurs in isolation in ADNI’s older adults1 (e.g., TDP43, vasculopathy/infarcts, synucleinopathy, hippocampal sclerosis) whereas DIAN cases (with the exception of
synucleinopathy) have pure
AD2Mutation-dependent pathology in DIAN (e.g., PSEN1 mutations before codon 200 of APP have greater amyloid burden than mutations after codon 200
3)PSEN mutations affect many other proteins that are
γ
secretase substrates
4
1
Boyle PA et al, Ann
Neurol
; 2018; 83:74-83 3Mann DM et al, Am J Pathol 2001; 158:2165-752Cairns NJ et al, Neuropathol 2015; 35:390-400 4Roher AE et al, J Alz Dis 2016; ;50:645-58
Slide6Analytic Challenges – Cont’dVariable methods confound comparisonsDifferent amyloid PET tracers, different imaging pipelines
DIAN uses PiB, ADNI uses AV45 (some PiB in the past)Solution: Reprocess imaging data with conversion equation (Centiloid)CSF analytic variability (lot to lot and plate to plate); Aβ42 assay drift1Solution: Reprocess CSF with Roche Elecsys automated platform for CSF analytes (Aβ42, Aβ
40, tau, p-tau) Shaw (ADNI Biomarker Core) and Fagan (DIAN Biomarker Core) designed additional analyses to obtain mass spectrometry measures of Aβ isoforms and important methodological comparisons (AlzBio3)
1Schindler SE et al., Alzheimers
Dement. 2017;S1552-5260(17):32516-5
Slide7Anchoring Cohorts at CDR-SB≥1
ADNI (n=559)Any clinical group (CN-MCI-AD) at baseline
Baseline amyloid PETAt least a 1-point increase in the CDR-SB with follow-up in CN/MCIDIAN (n=291)
All mutation carriers, symptomatic and asymptomatic
224
PSEN1, 45 APP
,
22
PSEN2
Baseline
CDR-SB ≤ 1
Age when actual CDR-SB ≥ 1
Age when actual CDR-SB ≥ 1Baseline CDR-SB > 1 Age extrapolated using the estimated rate of change in CDR-SB from a mixed effect modelAge extrapolated using the estimated rate of change in CDR-SB from a mixed effect modelCDR-SB remained < 1 Not Applicable – all CN/MCI had to have CDR-SB change by 1Estimated mutation-specific age of onset (or parental age of onset)ADNI - Age at symptomatic onset unavailable for the ADNI cohort unless progression occurred from CDR-SB=0 to CDR-SB ≥1. Otherwise, age of onset is estimated (See below) DIAN – Age at onset is available for all by observation, extrapolation, or estimation (See below)
Slide8Cohort Baseline Description
DIAN Mutation Carriers
N= 291
ADNI Participants
N=559
Asymptomatic
CDR=0
N=184
(63%)
Symptomatic
CDR>0
N=107
(37%)AsymptomaticCDR=0N=72(13%)SymptomaticCDR>0N=487(87%)DIAN vs ADNICDR=0pDIAN vs ADNICDR>0p Age, Years, Mean (SD)33.4 (8.7)46.0 (10.0)75.2 (5.6)73.6 (7.6)<.0001<.0001Sex (% Women)57.651.451.439.40.36470.0232Race (% Caucasian)88.092.593.195.50.24650.2108Education, Years, Mean (SD)14.8 (2.9)13.4 (3.1)16.1 (2.8)15.9 (2.8)0.0006<.0001MMSE, Mean (SD)29.1 (1.2)22.5 (6.9)29.1 (1.0)26.1 (2.8)0.9721<.0001APOE4+ 1 E4 2 E452 (28.3%)28 (26.2%)22 (30.6%)215 (44.2%)0.72990.0005
2 (1.1%)
6 (5.6%)
1 (1.4%)
75 (15.4%)
0.9407
0.0017
Clinical f/u, Years, Mean (SD)
3.4 (1.5)
2.5 (1.5)
5.8 (3.2)
3.5 (2.5)
<.0001
0.0012
Slide9Reprocessed Biomarker
DIANADNI
CSF reprocessed by ADNI Biomarker Core
(Roche
Elecsys)
A
β
1-42
Yes
Yes
A
β
1-40YesYesTauYesYespTau181YesYesImaging reprocessed by DIAN Imaging CoreMRI Hippocampal volumeCortical thickness in precuneusYesYesAmyloid PETCortical mean Centiloid unitsPiB AV45(initially PiB)Variables Available for ComparisonCommon Cognitive AssessmentsAnimal FluencyLogical Memory ImmediateBoston NamingLogical Memory DelayedDigit Span ForwardTrailmaking ADigit Span BackwardTrailmaking BLetter Fluency - FWAIS Digit SymbolVegetable FluencyMMSE Global Composite (All tests)
Slide10Cognitive Composite Score
Unadjusted comparisons (adjusting for sex, education, race, and
APOE4
did not notably change results)
Slide11Hippocampal Volume (Summed)
Slide12Cortical Mean Amyloid –
Centiloid
Units
Slide13CSF A
β
42
log
Slide14CSF p-tau
Slide15CSF tau
Slide16ConclusionsDifferences between ADAD and LOAD
LOAD may be modified by age, APOE4 effects, and other pathologiesADAD may be modified by individual mutation effects on Aβ, other substrates
The course of symptomatic ADAD appears to be more aggressive than LOADHowever, both share a long asymptomatic period and have
identical
AD endophenotypes (supported by ADNI’s independent analyses):
At symptomatic onset (often marked by inflection points)
:
Increasing amyloidosis (amyloid PET; CSF A
β
42
)
Increasing
tauopathy (CSF t-tau, p-tau)Progressive hippocampal atrophyProgressive cognitive declineCautious optimism that lessons from ADAD will translate to LOAD