/
Drugs  monitoring by 19F-MR imaging and 19F-MR spectroscopy Drugs  monitoring by 19F-MR imaging and 19F-MR spectroscopy

Drugs monitoring by 19F-MR imaging and 19F-MR spectroscopy - PowerPoint Presentation

Hiphopkid
Hiphopkid . @Hiphopkid
Follow
342 views
Uploaded On 2022-08-01

Drugs monitoring by 19F-MR imaging and 19F-MR spectroscopy - PPT Presentation

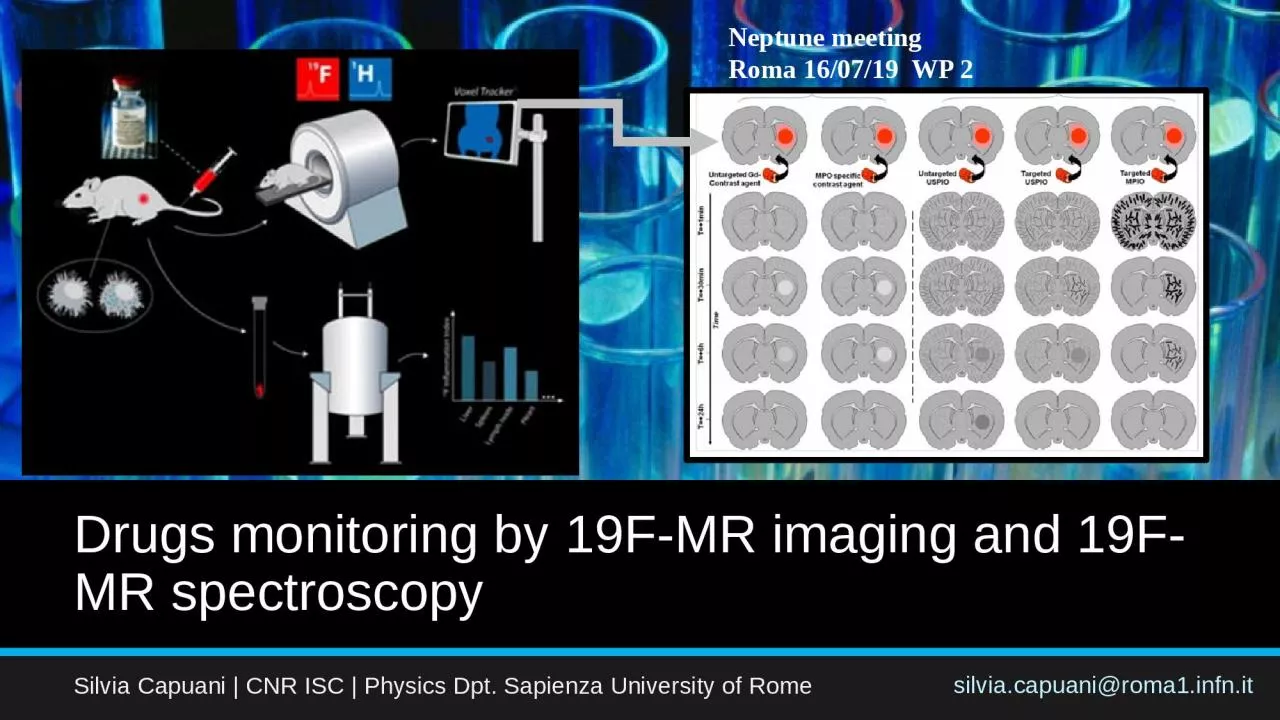
Silvia Capuani CNR ISC Physics Dpt Sapienza University of Rome silviacapuaniroma1infnit Neptune meeting Roma 160719 WP 2 Neptune 19F MRI in mouse pancreas T2w TE40ms ID: 932110

bpa mri brain 19f mri bpa 19f brain rat dopa infusion pancreas neptune mouse image pre tissue capuani tumour

Share:

Link:

Embed:

Download Presentation from below link

Download Presentation The PPT/PDF document "Drugs monitoring by 19F-MR imaging and ..." is the property of its rightful owner. Permission is granted to download and print the materials on this web site for personal, non-commercial use only, and to display it on your personal computer provided you do not modify the materials and that you retain all copyright notices contained in the materials. By downloading content from our website, you accept the terms of this agreement.


Presentation Transcript

Slide1

Drugs monitoring by 19F-MR imaging and 19F-MR spectroscopy

Silvia Capuani | CNR ISC | Physics Dpt. Sapienza University of Rome

silvia.capuani@roma1.infn.it

Neptune

meeting

Roma 16/07/19 WP

2

Slide2

Neptune:

19F MRI in mouse pancreas:

T2w

TE=40ms

Roma, CNR, INFN, ISS

Slide3

FDG vs 12F (dodecafluoro-dodecaborato)

Slide4

12F vs fluoroetanolo

17M vs 50mM2F 12F

Slide5

Conventional magnetic resonance (MR) techniques are based on

the detection of the signal from mobile protons (hydrogen 1[1H]) of water or lipids (concentration of protons 50

M

). Protons are highly abundant in the body, and

their concentration and magnetic

properties (relaxations times T1, T2) vary with anatomy.

Nuclear Magnetic Resonance Imaging (MRI)

Signal from hydrogen nuclei

MRI

scans essentially map the location of water and fat in the body

Slide6

Due to the absence of NMR-visible 19F in living tissues, 19F MRI has the strong advantage over 1H MRI to specifically detect administered 19F-containing compounds

without background signal, and to yield a linear relationship between signal and concentration of contrast agent. These properties, combined with the fact that 19F is the most sensitive nucleus after 1H, have raised much enthusiasm about 19F MRI emerging as a potential substitute to PET imaging

19F NMR

19F has 100% natural abundance,

spin =

1/2, and a gyromagnetic ratio

slightly

lower than

that of

of

1H,

resulting in

83%

of

the sensitivity of

1H

.

With

seven outer-shell

electrons,

19F

chemical shifts (CSs) are more sensitive to the local

environment

than

1H

with its single electron. Indeed, the

spectroscopic

signatures

of 19F compounds can vary over a

range more than 200 ppm, offering the potential for definitive identification of many compounds even at lower clinical field strengths

Slide7

19

F-MRI and 19F-MRS in C6 bearing rat brain

19

F-MRI and

19

F-MRS were used to obtain in vivo spatial distribution mapping

and pharmacokinetic of BPA

to investigate the use of L-DOPA as enhancer for BPA uptake in C6-glioma cells

BNCT

Slide8

1s

2s

3s

4s

Axial

1

H MR images of rat brain acquired two hours after

19

F-BPA-fr complex infusion

2.5h

after

infusion

19

F axial

image of rat brain acquired after

1

H MR scan

In

vivo

Imaging

results

Intra-carotid

BPA-

fr

infusion:

300mg/Kg

Slide9

Superimposition of

19

F axial image

(in colour level: low=blue, red=high)

acquired 2.5 hours after infusion on the corresponding morphological

1

H proton reference (in grey levels)

.

19

F-BPA

spatial bio-distribution

mapping by

19

F

MRI

P.

Porcari, S. Capuani, E. D’Amore

et al.

2008

Phys. Med. Biol.

19F MRI

Parameter

Protocol:SE

T2-weighted images

TR/TE

Slice

thikness

Square

FOV

Matrix

Resolution

NS

1800/4.3 ms

40 mm

120X120 mm

64X64 pixels

1.85

mm

X1.85

mm

40

1

H MRI

Parameter

Protocol:

MSME

T2-weighted images

TR/TE

Slice

thikness

Square

FOV

Matrix

Resolution

2500/45 ms

1.5 mm

40X40 mm

128X128 pixels

312

m

m

X312

m

m

Slide10

1h

2.5h

4h

MRS of blood

samples

extracted from the

right femoral vein

P.

Porcari, S. Capuani, E. D’Amore

et al.

2008

Phys. Med. Biol.

P

harmacokinetic

of

19

F-BPA

by

19

F

MRS

2.5 h after infusion the

19F–BPA uptake is maximum

in the

tumour

and minimum in systemic circulation

1

h after

infusion

2.5h after

infusion

4h after

infusion

4h after infusion

rat brain

SNR=3.7

2.5h after infusion

rat brain

SNR=5.1

Slide11

In

vivo

L-DOPA

preloading

results

BPA accumulation in tumor

samples

assessed by

HPLC was

significantly higher in treated group

compared

to control group (p<0.0001)

Mean

SD BPA/tissue concentration [µg/g]

Control group

Only BPA

N=10

L-DOPA pre-treatment +BPA

N=15

Tumor

33.5

7.5

88.3

12.1

Normal brain (

ipsilateral

)

12.0

5.2

10.5

6.2

Normal brain (

contralateral

)

7.4

2.2

6.6

2.8

Blood

5.0

1.8

4.8

2.1

BPA uptake in C6-glioma model is

dramatically increased

by L-DOPA preloading

HPLC

1

H T

2

-w image (a) and

19

F image (b)

of rat brain pre-treated with L-DOPA and then infused with

19

F-BPA-fr complex

1

H T

2

-w image (c) and

19

F image (d)

of rat brain not pre-loaded with L-DOPA (control) and then infused with

19

F-BPA-fr complex

19

F-BPA tumour signal was observed only in L-DOPA pre-treated rat but not in the other case confirming an increased

19

F-BPA tumour uptake after L-DOPA administration

S. Capuani,

et

al.

Int

J

Radiat

Oncol

Biol

Phys 2008

P.

Porcari

S. Capuani, E.

D’Amore

et al.

Appl

. Rad.

Isot

. 2009

1

H

19

F

Phantom

:

19F-BPA-frcomplex (10mM) was positioned on the

rf

coil as a reference during MRI measurements

.

Slide12

Conclusion

1

9

F-MRI in combination with

1

H-MRI selectively maps

the spatial-distribution

of

19

F-BPA in C6 tumour-bearing rats

19

F MRI is a useful method to investigate and evaluate the pharmacokinetics of the fluorinated-containing drugs

Correlation between

19

F MRI and

19

F MRS results highlights an improved understanding of

19

F-BPA uptake in tumour and systemic

circulation

L-DOPA pre-administration produced in the C6 glioma rat model an enhancement of tumor BPA accumulation which was

2.5

times higher than in the control condition

In order to quantify fluorine-containing molecules in tissues, a phantom containing different drug concentrations should be used in

phantom containing pellets

or in solutions / gels with similar characteristics to biological tissues

Slide13

Conclusion and future prospective

In this study we used a drug containing only one 19F

In recent years fluorinated molecules containing many 19F were synthetized to increase image SNR

As an example,

using

a functionalized

perfluorinated

emulsion

(PFOB)

and optimized

high sensitivity MSE sequence,

Giraudeau

et al. (2011) were

able to detect

about

100

picomolar

concentrations of αvβ3-targeted PFOB emulsion in vivo in a U87 human glioblastoma mouse model

Slide14

Neptune

Tissue: Mouse Pancreas

Preliminary MRI tests

Drugs

FDG

Slide15

Neptune: MRI mouse pancreas features:

T2w

TE=40ms

Roma, CNR, INFN, ISS

Slide16

Neptune: MRI mouse pancreas features

: relaxation times

Tissue

T2(ms)T1(ms

)brain45-80

800pancreas22-381300

Slide17

Neptune: MRI mouse pancreas

features: diffusion MRI

Slide18

Neptune: MRI mouse pancreas features

: diffusion MRI

tissueD(m

2/s)brain

9*10-10pancreas

3.5*10-10

water dynamics

slower

in the pancreas compared to the

cerebral tissue

Slide19

Neptune:

critical aspect, choice of the compoundThe pancreatic tissue is more dense than the cerebral one. Therefore we expect less favorable conditions for the detection of

19F compounds in

pancreas compared to brain tissues

With the development of the tumor the tissue becomes denser

L-DOPA pre-administration produced in the C6 glioma rat model an enhancement of tumor BPA accumulation which was 2.5 times higher than in the control condition