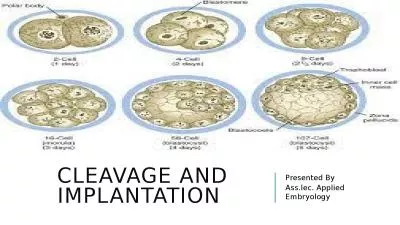
Figure compares restriction fragments in humans and gorillas for two different enzmes Bands change due to point mutations in restriction sites A shift in both these patterns corresponds to a 95 bp deletion in Gorilla ID: 931258
Download Presentation The PPT/PDF document "Ferris et al PNAS 1981 Evolutionary tre..." is the property of its rightful owner. Permission is granted to download and print the materials on this web site for personal, non-commercial use only, and to display it on your personal computer provided you do not modify the materials and that you retain all copyright notices contained in the materials. By downloading content from our website, you accept the terms of this agreement.
Slide1
Slide2Slide3Ferris et al PNAS 1981
Evolutionary tree of apes and humans based on cleavage maps of mtDNA
Figure compares restriction fragments in humans and gorillas for two different enzmes.
Bands change due to point mutations in restriction sites.
A shift in both these patterns corresponds to a 95 bp deletion in Gorilla.
Slide4Restriction site map of 5 species
42 sites that are either present or absent in each species
Slide5The most parsimonious tree for these data has 67 mutations in 42 positions.
This places Gorillas and Chimps closer than Humans (almost cetainly wrong).
The alternative tree with Chimps and Humans closer than Gorillas has 68.
This is now thought to be the correct tree using other types of sequence data.
Applying parsimony to restriction sites means finding the tree with the fewest possible changes in the sites.
Slide6Cann et al, Nature 1987
Mitochondrial DNA and Human Evolution
Parsimony Tree of 134 human mitochondrial sequences
398 mutations in restrictions sites
One of the two primary branches leads exclusively to frican sequences. Suggests an African origin.
Dates of colonization (archaeological)
12000 yrs for New World
30000 yrs for New Guinea
40000 yrs for AustraliaAssume constant rate of evolution
Mean rate of evolution is 2%-4% per million years
Hence age of Eve is 140000 – 290000 yrs
Slide7Neighbour-joining phylogram based on complete mtDNA genome sequences (excluding the D-loop).
From
Ingman et al – Nature 2000
Slide8From the mean genetic distance between all the humans and the one chimpanzee sequence (0.17 substitutions per site) and the assumption, based on palaeontological
10
and genetic11 evidence, of a divergence time between humans and chimpanzees of 5 Myr, the mutation rate () for the mitochondrial molecule, excluding the D-loop, is estimated to be 1.70 10 -8 substitutions per site per year
.
This is 0.017 per million years – close to 2% per million years in the previous paper
Slide9Endicott et al – Trends in Ecol and Evol (2009)
Deducing human migration pathways from fossils and reconciling with genetic evidence
Slide10Endicott et al – Trends in Ecol and Evol (2009)
Dating the important branchpoints on the tree depends on rate calibrations.
Still difficult to do precisely
Slide11A revised timescale for human evolution based on ancient mitochondrial genomes.
Fu et al (2013) Current Biology
Sequence fragments of mtDNA from a fossil specimen and assemble the genome.
Radiocarbon dating to get the age of the sample. Gives good calibration.
Otherwise – the date of the human chimp split is much farther back (5-7 million years) and is much less certain.
Slide12Slide13Selection is also important
Apparently faster evolution on more recent branches