/
Greenhouse gas fluxes derived from regional measurement networks and atmospheric inversions: Greenhouse gas fluxes derived from regional measurement networks and atmospheric inversions:

Greenhouse gas fluxes derived from regional measurement networks and atmospheric inversions: - PowerPoint Presentation

KingOfTheWorld
KingOfTheWorld . @KingOfTheWorld
Follow
347 views
Uploaded On 2022-07-28

Greenhouse gas fluxes derived from regional measurement networks and atmospheric inversions: - PPT Presentation

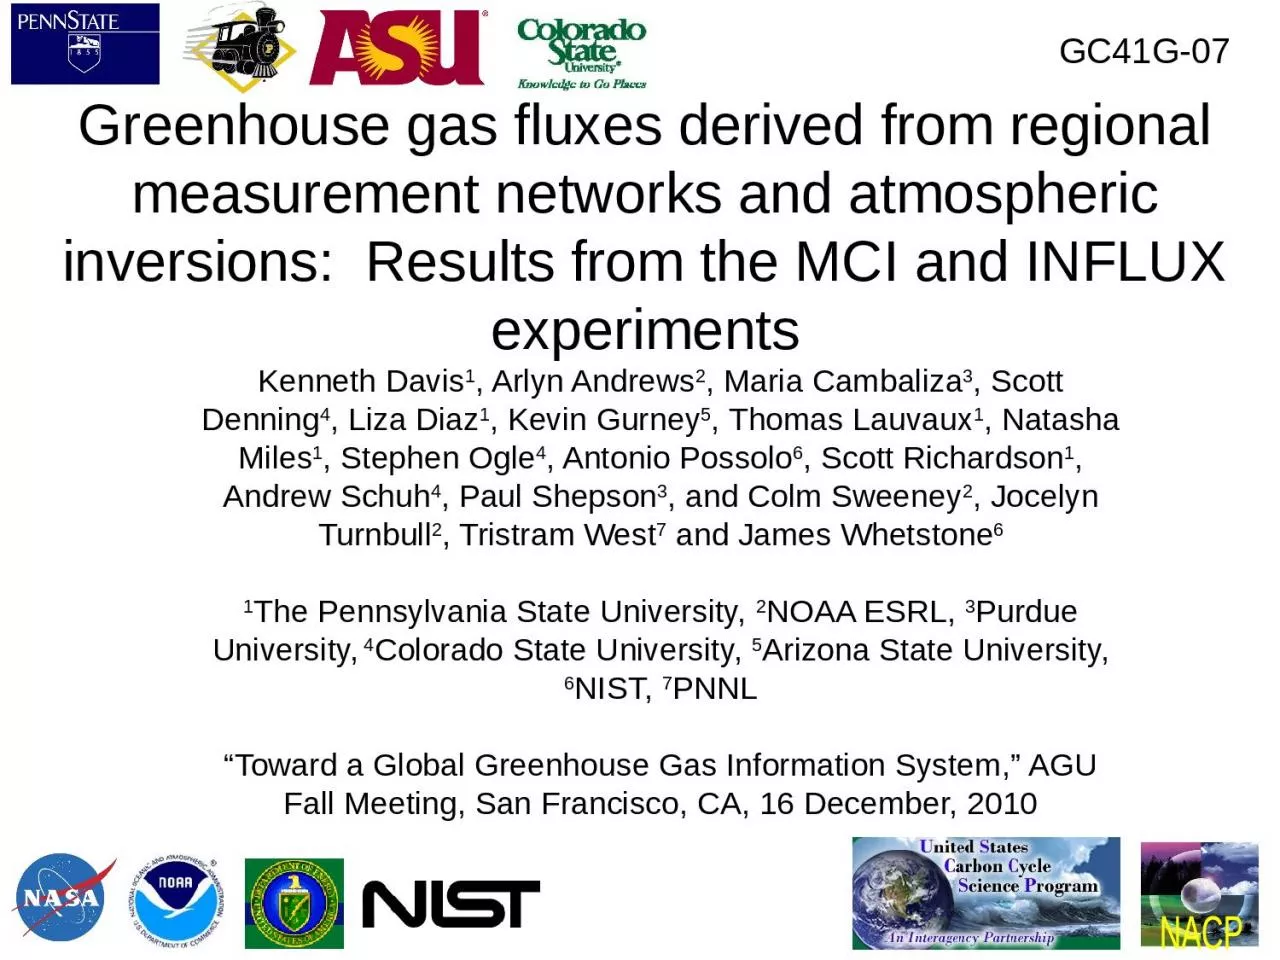
Kenneth Davis 1 Arlyn Andrews 2 Maria Cambaliza 3 Scott Denning 4 Liza Diaz 1 Kevin Gurney 5 Thomas Lauvaux 1 Natasha Miles 1 Stephen Ogle 4 Antonio Possolo 6 ID: 931071

co2 flux estimates mci flux co2 mci estimates fluxes prior data sites tower atmospheric inventory carbon influx inversion aircraft

Share:

Link:

Embed:

Download Presentation from below link

Download Presentation The PPT/PDF document "Greenhouse gas fluxes derived from regio..." is the property of its rightful owner. Permission is granted to download and print the materials on this web site for personal, non-commercial use only, and to display it on your personal computer provided you do not modify the materials and that you retain all copyright notices contained in the materials. By downloading content from our website, you accept the terms of this agreement.


Presentation Transcript

Slide1

Greenhouse gas fluxes derived from regional measurement networks and atmospheric inversions: Results from the MCI and INFLUX experiments

Kenneth Davis1, Arlyn Andrews2, Maria Cambaliza3, Scott Denning4, Liza Diaz1, Kevin Gurney5, Thomas Lauvaux1, Natasha Miles1, Stephen Ogle4, Antonio Possolo6, Scott Richardson1, Andrew Schuh4, Paul Shepson3, and Colm Sweeney2, Jocelyn Turnbull2, Tristram West7 and James Whetstone61The Pennsylvania State University, 2NOAA ESRL, 3Purdue University, 4Colorado State University, 5Arizona State University, 6NIST, 7PNNL “Toward a Global Greenhouse Gas Information System,” AGU Fall Meeting, San Francisco, CA, 16 December, 2010

NACP

GC41G-07

Slide2

Learn by doingWhat is needed to estimate regional CO2 fluxes using atmospheric data?

The MCI and INFLUX are experiments aimed at addressing this question experimentally.

Slide3

Evolution of the MCI1999 US Carbon Cycle Science Plan (Sarmiento and

Wofsy) proposed regional atmospheric inversions.2002 white paper by Pieter Tans proposed the U.S. midcontinent as a good experimental site – agricultural fluxes are known because of harvest/inventory data.2006 Midcontinent Intensive (MCI) science plan (Ogle et al) spelled out the objectives of this contribution to the North American Carbon Program (NACP).Field work, 2005-2009. Analyses are at hand!The primary objective of the NACP MCI is to test of our ability to achieve convergence of “top-down” and “bottom-up” estimates of the terrestrial carbon balance of a large, sub-continental region.

Slide4

INFLUXIndianapolis flux experiment: A field campaign with very similar objectives to the NACP MCI, but aimed at urban/anthropogenic carbon fluxes.

Slide5

Experimental designDense, tower-based greenhouse gas measurement networkRelatively simple terrain and dense meteorological data

These yield our best chances to derive robust flux estimates using atmospheric inversions.Excellent “bottom-up” flux estimates from inventory methods This provides the test for the atmospheric inversion methodology.

Slide6

Toolbox

(used at Penn State)Air ParcelAir ParcelAir ParcelSources

Sinks

wind

wind

Sample

Sample

Network of tower-based GHG sensors:

(9 sites with CO

2

for the MCI)

(~11 sites with CO

2

, CH

4

, CO and

14

CO

2

for INFLUX)

Atmospheric transport model:

(WRF, 10km for the MCI)

(WRF, 2km for INFLUX)

Prior flux estimate:

(

SiB

-

Crop

for MCI)

(Hestia for INFLUX)

B

oundary conditions (CO2/met):

(Carbon Tracker and NOAA aircraft

profiles,

NCEP meteorology

)

Slide7

Toolbox, continuedLagragian Particle Dispersion Model (LPDM,

Uliasz). Determines “influence function” – the areas that contribute to GHG concentrations at measurement points.Independent data for evaluation of our results.Agricultural inventory, flux towers and some aircraft data for the MCIFossil fuel inventory, (flux towers?) and abundant in situ aircraft data for INFLUX

Slide8

Inversion methodSimulate atmospheric transport.

Run LPDM to determine influence functionsConvolute influence functions with prior flux estimates to predict CO2 at observation pointsCompare modeled and observed CO2 and minimize the difference by adjusting the fluxes and boundary conditions.

Slide9

Inversion method (graphic)

Estimated together Enhance uncertainty assessment by experimenting with the prior and the uncertainty estimates (model-data, prior) and examining the impact on the derived fluxes.

Slide10

Results from the NACP MCI

Slide11

CO

2 Concentration Network: 2008Midcontinent intensive, 2007-2009INFLUX, 2010-2012Gulf coast intensive, 2013-2014

Slide12

MCI inventory estimates

West, Ogle, Gurney and colleagues

Slide13

MCI inventory estimates

West, Ogle, Gurney and colleaguesWest et al, submitted.Schuh et al, B51L-05

Slide14

Corn-dominated sites

MCI Tower-Based CO2 Observational NetworkAircraft profile sites, flux towers omitted for clarity.

Slide15

Large variance in seasonal drawdown, despite being separated by ~ 500-800 km

2 groups: 33-39 ppm drawdown and 24 – 29 ppm drawdown (difference of about 10 ppm)

Mauna Loa

Miles et al, in preparation

MCI 31 day running mean daily daytime average CO2

Slide16

Daily

differences from site to site as large at 60 ppm.Synoptic variability in boundary-layer CO2 mixing ratios: Daily daytime averagesMiles et al, in preparation

Slide17

Prior flux estimate

Posterior flux estimateLauvaux et al, in preparation, AUnits are TgC/degree2, Jun-Dec07

Slide18

Prior flux estimate

Posterior flux estimateLauvaux et al, in preparation, ASpatial pattern of NEE is not overly sensitive to the prior.Units are TgC/degree2, Jun-Dec07

Slide19

C

omparison to inventorySpatial patterns are similar.Integrated net fluxes are similar.PSU SiB-crop inversionInventory estimateOgle et al, in prep

Slide20

CO2 boundary condition adjustment

CT vs. NOAA aircraft profilesLauvaux et al, in preparation, A

Slide21

Regionally and time integrated C flux uncertainty

assessmentExperiments with the PSU inversion include varying the: - prior flux - prior flux uncertainty (magnitude and spatial correlation) - model-data error (magnitude and temporal correlation) - boundary condition temporal persistence.Net flux estimate is fairly robust to the assumptions made in the inversion.Lauvaux et al, in preparation, A

Slide22

Impact of observational network:

Tower removal experimentsPrior fluxPosterior fluxPosterior with only “corn” sitesPosterior without “corn” sitesRegional integral is fairly robust to tower removal.Spatial patterns are quite sensitive to tower removal.Lauvaux et al, in prep, B

Slide23

No explicit assessment yet of the impact of atmospheric transport uncertainty, save for comparison of

CSU (RAMS), CT (TM5) and PSU (WRF) inversions. Schuh et al, in prep; B51L-05Diaz et al., in prep.

Slide24

CO

2 Concentration Network: 2008Midcontinent intensive, 2007-2009INFLUX, 2010-2012Gulf coast intensive, 2013-2014

Slide25

INFLUX (Indianapolis FLUX)

Project Goals:• Develop improved approach for measurement of area-wide greenhouse gas emission fluxes within the urban area• Compare top-down emission estimates from aircraft and tower-based measurements with bottom-up emission estimates from inventory methods • Quantify uncertainties in the two approaches

Slide26

Why Indianapolis?

Medium-sized city, with fossil fuel CO2 emissions of ~3.4 MtC yr-1Located far from other metropolitan areas, so the signal from Indianapolis can be isolated with relative easeFlat terrain, making the meteorology relatively simpleView of Indianapolis from the White River (photo by Jean Williams) 1

Slide27

Tower-based measurements: continuous

Current: continuous measurements of CO2 at two sitesPlannedTwo sites measuring CO2/CO/CH4Three sites measuring CO2/COThree sites measuring CO2/CH4Four sites measuring CO2

Slide28

Tower locationsSites 1 and 2

are currently measuring CO2.Sites 3 through 12 are planned, with tentative locations shown.Mixture of continuous CO2, CH4 and CO sensors, and flask 14CO2 data.1 21

Slide29

Slide30

Y. Zhou and K. Gurney, A new methodology for quantifying on-site residential and commercial fossil fuel CO2 emissions at the building spatial scale and hourly time scale, Carbon Management (2010) 1(1), 45–56.

Hestia: A downscaled inventory derived from Vulcan

Slide31

Hestia: Hourly, building level resolution of emissions

Slide32

Hestia Annual Fluxes for Indianapolis

Slide33

Purdue airborne

sampling(budget flux estimates, source ID, transport test)Mays, K. L., P. B. Shepson, B. H. Stirm, A. Karion, C. Sweeney, and K. R. Gurney, 2009. Aircraft-Based Measurements of the Carbon Footprint of Indianapolis, Environ. Sci. Technol., 43, 7816-7823

Slide34

14CO2=14CC()

sa

14

C

C

(

)

std

BN[x]

-1

x1000

{(

)

}

std=1.176x10

-12 14

C/C

C

obs

=

C

bg

+

C

ff

+

C

r

C

obs

obs

=

C

bg

bg

+

C

ff

ff

+

C

r

r

(

)

(

C

ff

=

C

obs

obs

-

bg

ff

-

bg

-

C

r

r

-

bg

)

ff

-

bg

Calculation of recently added fossil fuel CO

2

mixing ratio from observations of CO

2

and

14

CO

2

Slide35

14

±2 ppb/ppm9 ppb/ppm20 ppb/ppm7 ppb/ppmEmission ratios: CO:CO2ffTurnbull, J. C., Karion, A., Fischer, M. L., Faloona, I. C., Guilderson, T. P., Lehman, S. J., Miller, B. R., Miller, J. B., Montzka, S. A., Sherwood, T., Saripalli, S., Sweeney, C., and Tans, P. P.: Measurement of fossil fuel derived carbon dioxide and other anthropogenic trace gases above Sacramento, California in spring 2009, Atmospheric Chemistry and Physics Discussions, 10.5194/acpd-10-1-2010, 2010.

Slide36

ConclusionsRegional C flux inverse

estimates for the MCI appear to converge with inventory estimates.Regional C flux inverse estimates for the MCI are fairly robust to assumptions.Regional sums of NEE do not require a very dense observational network, but spatial patterns are highly sensitive to the network.Differences remain across inversion systems (transport, structure of inversion).Multi-species (fossil and bio CO2, CH4), high resolution (2 km) INFLUX inversions will address similar questions for an urban experiment.