/
The Binding of Bile Acids by Biscuits with Bioactive Substances during The Binding of Bile Acids by Biscuits with Bioactive Substances during

The Binding of Bile Acids by Biscuits with Bioactive Substances during - PowerPoint Presentation

Masterchief
Masterchief . @Masterchief
Follow
342 views
Uploaded On 2022-08-04

The Binding of Bile Acids by Biscuits with Bioactive Substances during - PPT Presentation

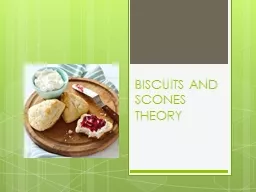
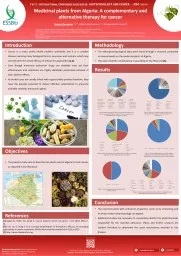
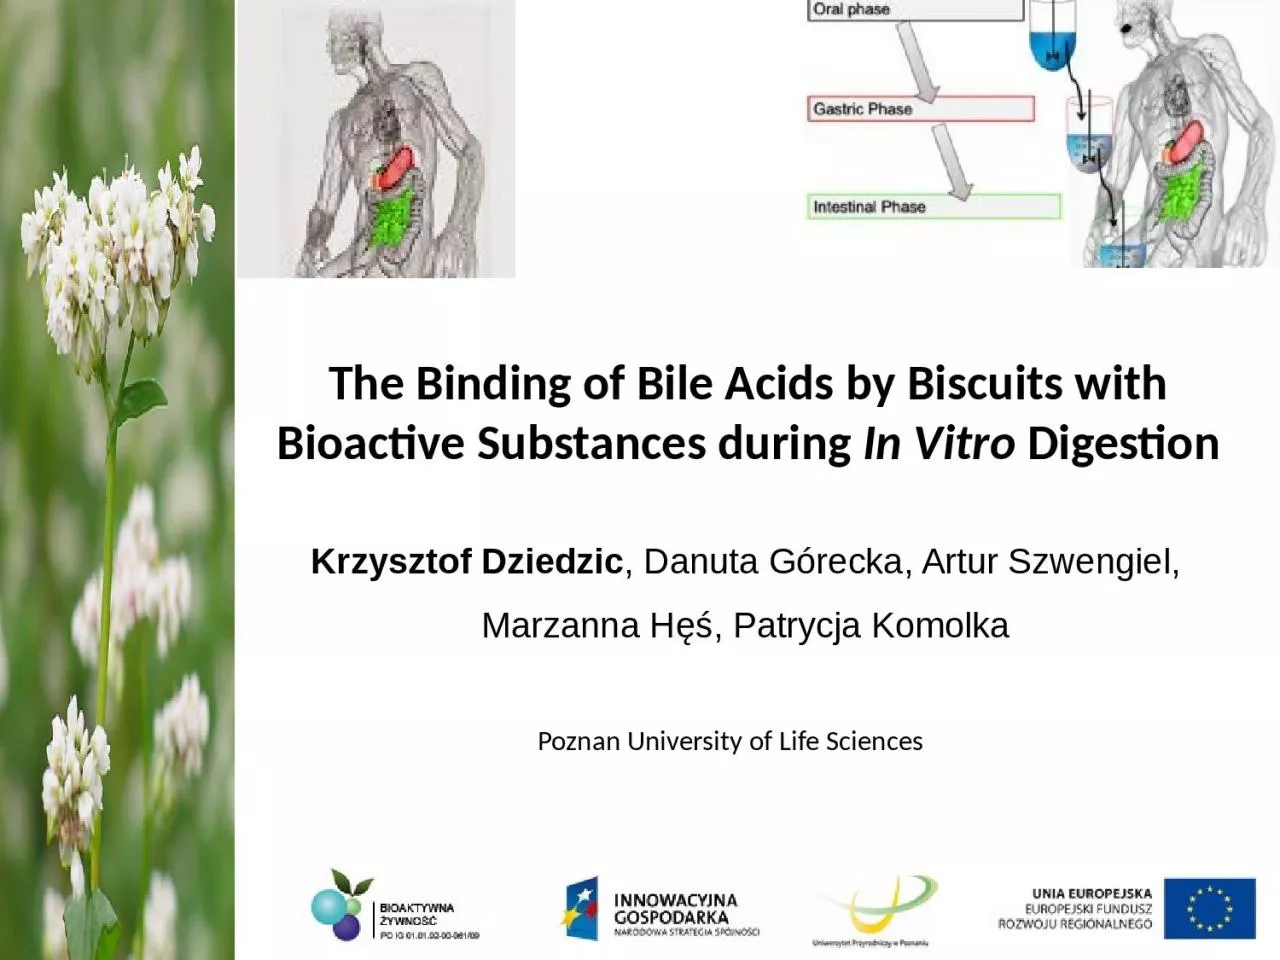
In Vitro Digestion Poznan University of Life Sciences Krzysztof Dziedzic Danuta Górecka Artur Szwengiel Marzanna Hęś Patrycja Komolka Bioreactor used during in vitro ID: 935518

acid intestine biscuits bile intestine acid bile biscuits control large small dietary fiber sample bb1 bioactive 3458 means comparison

Share:

Link:

Embed:

Download Presentation from below link

Download Presentation The PPT/PDF document "The Binding of Bile Acids by Biscuits wi..." is the property of its rightful owner. Permission is granted to download and print the materials on this web site for personal, non-commercial use only, and to display it on your personal computer provided you do not modify the materials and that you retain all copyright notices contained in the materials. By downloading content from our website, you accept the terms of this agreement.


Presentation Transcript

Slide1

The Binding of Bile Acids by Biscuits with Bioactive Substances during In Vitro Digestion

Poznan University of Life Sciences

Krzysztof Dziedzic, Danuta Górecka, Artur Szwengiel, Marzanna Hęś, Patrycja Komolka

Slide2

Slide3

Slide4

Bioreactor used during in vitro

digestion- singel

chamber static model

pH

electrode

Stirrer

Water

jacket

Sampling

system

Peristaltic

pomps

Slide5

www.naturalvigour.com

Slide6

www.buzzle.com

E.

faecalis

E.

coli

Slide7

www.buzzle.com

Slide8

www.otsuka.co.jp

Slide9

www.publish.ucc.ie

Slide10

The aim of study

determination of bile salts binding ability by pastry

goods during in vitro digestionDietary fiber assays: Total dietary fiber

Insoluble dietary fiber

Soluble dietary fiberNeutral detergent fiber

Cellulose

HemicelluloseLignin

Bile salts assays:

Cholic acid

Deoksycholic acid

Lithocholic acid

Slide11

Neutral detergent fiber, cellulose (C), hemicellulose (H) and lignin (L) was assayed using Van Soest method

; Total dietary fiber (TDF), soluble (SDF) and insoluble (IDF) fractions were assayed using Asp method

The ability to bind bile acids was estimated using UHPLC equipment1. Van Soest, P.J. 1963. Use of detergents in the analysis fibrous feeds. I. Preparation of fiber residues of low nitrogen content. J. AOAC Int. 46: 825-835.

2. Van Soest, P.J.

1967. Use of detergents in the analysis of fibrous feeds. IV. Determination of plant cell wall constituents. J. AOAC Int. 50: 50-55.

3. Asp N.-G., Johansson C.-G., Hallmer H. and Siljestrom

M. 1983. Rapid enzymatic assay of insoluble, and soluble dietary fiber. J. Agr. Food Chem.

31: 476-482.4. Asp N.-G. 1996. Dietary carbohydrates: classification by chemistry and physiology. Food Chem.

57: 9-14.5.

Wang

, W.,

Onnagawa

, M.,

Yoshie

, Y.,

Szuzuki

, T. 2001. Binding of bile salts soluble and insoluble dietary

fibers

of

seaweeds

.

Fishieries

Science. 67: 1169-1173.

Methods

Slide12

The Samples

Control biscuits (CB)

Bioactive biscuits (BB1)Bioactive biscuits (BB2)

Slide13

CB

BB1

BB2Plant butter2010

10

Innulin-

2

2Water

-4

4

Egs

20

21

21

Sugar

17

17

17

Wheat flour

43

23

33

Buckwheat flour

-

21

11

Buckwheat hull

-

2

2

Table 1. Ingredients of biscuits.

Slide14

CB

BB1

BB2Plant butter2010

10

Innulin-

2

2Water

-4

4

Egs

20

21

21

Sugar

17

17

17

Wheat flour

43

23

33

Buckwheat flour

-

21

11

Buckwheat hull

-

2

2

Table 1. Ingredients of biscuits.

Slide15

CB

BB1

BB2Plant butter2010

10

Innulin-

2

2Water

-4

4

Egs

20

21

21

Sugar

17

17

17

Wheat flour

43

23

33

Buckwheat flour

-

21

11

Buckwheat hull

-

2

2

Table 1. Ingredients of biscuits.

Slide16

CB

BB1

BB2Plant butter2010

10

Innulin-

2

2Water

-4

4

Egs

20

21

21

Sugar

17

17

17

Wheat flour

43

23

33

Buckwheat flour

-

21

11

Buckwheat hull

-

2

2

Table 1. Ingredients of biscuits.

Slide17

Organic

acids

Phenolic compounds

Bile salts

carbohydrates

Stomach

(pH 2,0; after 10min)

x

x

x

Stomach

(after 2h)

x

x

x

Small

intestine

(pH 6,0; after 30 min)

x

Small

intestine

(pH 7,4 )

x

x

x

x

Large

intestine

(pH 8.0; start)

x

x

x

x

Large

intestine

(pH 8.0;

final

)

x

x

x

x

Model

of research

Slide18

Organic

acids

Phenolic compounds

Bile salts

carbohydrates

Stomach

(pH 2,0; after 10min)

x

x

x

Stomach

(after 2h)

x

x

x

Small

intestine

(pH 6,0; after 30 min)

x

Small

intestine

(pH 7,4 )

x

x

x

x

Large

intestine

(pH 8.0; start)

x

x

x

x

Large

intestine

(pH 8.0;

final

)

x

x

x

x

Model

of research

Slide19

Organic

acids

Phenolic compounds

Bile salts

carbohydrates

Stomach

(pH 2,0; after 10min)

x

x

x

Stomach

(after 2h)

x

x

x

Small

intestine

(pH 6,0; after 30 min)

x

Small

intestine

(pH 7,4 )

x

x

x

x

Large

intestine

(pH 8.0; start)

x

x

x

x

Large

intestine

(pH 8.0;

final

)

x

x

x

x

Model

of research

Slide20

Results

Slide21

Tab.1.

Content of neutral dietary fiber (NDF) and its fraction.

Control

biscuits

(CB)

Bioactive

biscuits

(BB1)

Bioactive

biscuits

(BB2)

NDF

3.53

b

5.20

a

4.83

c

Cellulose

0.95

c

1.99

ab

1.37

bc

Hemicellulose

0.78

bc

0.84

ab

0.20

c

Lignin

1.80

c

2.38

b

3.26

a

Sample

Fraction

Slide22

Tab.1.

Content of neutral dietary fiber (NDF) and its fraction.

Control

biscuits

(CB)

Bioactive

biscuits

(BB1)

Bioactive

biscuits

(BB2)

NDF

3.53

b

5.20

a

4.83

c

Cellulose

0.95

c

1.99

ab

1.37

bc

Hemicellulose

0.78

bc

0.84

ab

0.20

c

Lignin

1.80

c

2.38

b

3.26

a

Sample

Fraction

Slide23

Tab.1.

Content of neutral dietary fiber (NDF) and its fraction.

Control

biscuits

(CB)

Bioactive

biscuits

(BB1)

Bioactive

biscuits

(BB2)

NDF

3.53

b

5.20

a

4.83

c

Cellulose

0.95

c

1.99

ab

1.37

bc

Hemicellulose

0.78

bc

0.84

ab

0.20

c

Lignin

1.80

c

2.38

b

3.26

a

Sample

Fraction

Slide24

Tab.2. Content of total dietary fiber (TDF) and its fractions.

Control

biscuits

(CB)

Bioactive

biscuits

(BB1)

Bioactive

biscuits

(BB2)

Total Dietary Fiber

8.7

c

11.2

ab

12.8

a

Insoluble Dietary Fiber

4.5

c

7.5

a

7.4

ab

Soluble Dietary Fiber

4.2

b

3.8

c

5.4

a

Sample

Fraction

Slide25

Tab.2. Content of total dietary fiber (TDF) and its fractions.

Control

biscuits

(CB)

Bioactive

biscuits

(BB1)

Bioactive

biscuits

(BB2)

Total Dietary Fiber

8.7

c

11.2

ab

12.8

a

Insoluble Dietary Fiber

4.5

c

7.5

a

7.4

ab

Soluble Dietary Fiber

4.2

b

3.8

c

5.4

a

Sample

Fraction

Slide26

Tab.3.

Bile acid binding capacity

by pastry goods.„-” means decrease of bile acid in comparison to control sample , „+” means increase of bile acid in comparison to control sample.

Control

(mg/

mL

)

CB

(mg/

mL

)

BB1

(mg/

mL

)

BB2

(mg/

mL

)

Cholic acid

Small

intestine

3265

2257

(-31%)

3087

(-5%)

274

(-92%)

Large

intestine

3055

3458

(+13%)

3332

(+9%)

1250

(-59%)

Deoksycholic

acid

Small

intestine

11181

848

(-92%)

765

(-93%)

29

(-99%)

Large

intestine

2696

3527

(+31%)

3136

(+16%)

301

(-89%)

Lithocholic

acid

Small

intestine

320

91

(-72%)

126

(-61%)

182

(-56%)

Large

intestine

2223

2675

(+20%)

3576

(+61%)

3458

(+56%)

Slide27

Tab.3.

Bile acid binding capacity

by pastry goods.„-” means decrease of bile acid in comparison to control sample , „+” means increase of bile acid in comparison to control sample.

Control

(mg/

mL

)

CB

(mg/

mL

)

BB1

(mg/

mL

)

BB2

(mg/

mL

)

Cholic acid

Small

intestine

3265

2257

(-31%)

3087

(-5%)

274

(-92%)

Large

intestine

3055

3458

(+13%)

3332

(+9%)

1250

(-59%)

Deoksycholic

acid

Small

intestine

11181

848

(-92%)

765

(-93%)

29

(-99%)

Large

intestine

2696

3527

(+31%)

3136

(+16%)

301

(-89%)

Lithocholic

acid

Small

intestine

320

91

(-72%)

126

(-61%)

182

(-56%)

Large

intestine

2223

2675

(+20%)

3576

(+61%)

3458

(+56%)

Slide28

Tab.3.

Bile acid binding capacity

by pastry goods.„-” means decrease of bile acid in comparison to control sample , „+” means increase of bile acid in comparison to control sample.

Control

(mg/

mL

)

CB

(mg/

mL

)

BB1

(mg/

mL

)

BB2

(mg/

mL

)

Cholic acid

Small

intestine

3265

2257

(-31%)

3087

(-5%)

274

(-92%)

Large

intestine

3055

3458

(+13%)

3332

(+9%)

1250

(-59%)

Deoksycholic

acid

Small

intestine

11181

848

(-92%)

765

(-93%)

29

(-99%)

Large

intestine

2696

3527

(+31%)

3136

(+16%)

301

(-89%)

Lithocholic

acid

Small

intestine

320

91

(-72%)

126

(-61%)

182

(-56%)

Large

intestine

2223

2675

(+20%)

3576

(+61%)

3458

(+56%)

Slide29

Tab.3.

Bile acid binding capacity

by pastry goods.„-” means decrease of bile acid in comparison to control sample , „+” means increase of bile acid in comparison to control sample.

Control

(mg/

mL

)

CB

(mg/

mL

)

BB1

(mg/

mL

)

BB2

(mg/

mL

)

Cholic acid

Small

intestine

3265

2257

(-31%)

3087

(-5%)

274

(-92%)

Large

intestine

3055

3458

(+13%)

3332

(+9%)

1250

(-59%)

Deoksycholic

acid

Small

intestine

11181

848

(-92%)

765

(-93%)

29

(-99%)

Large

intestine

2696

3527

(+31%)

3136

(+16%)

301

(-89%)

Lithocholic

acid

Small

intestine

320

91

(-72%)

126

(-61%)

182

(-56%)

Large

intestine

2223

2675

(+20%)

3576

(+61%)

3458

(+56%)

Slide30

Tab.3.

Bile acid binding capacity

by pastry goods.„-” means decrease of bile acid in comparison to control sample , „+” means increase of bile acid in comparison to control sample.

Control

(mg/

mL

)

CB

(mg/

mL

)

BB1

(mg/

mL

)

BB2

(mg/

mL

)

Cholic acid

Small

intestine

3265

2257

(-31%)

3087

(-5%)

274

(-92%)

Large

intestine

3055

3458

(+13%)

3332

(+9%)

1250

(-59%)

Deoksycholic

acid

Small

intestine

11181

848

(-92%)

765

(-93%)

29

(-99%)

Large

intestine

2696

3527

(+31%)

3136

(+16%)

301

(-89%)

Lithocholic

acid

Small

intestine

320

91

(-72%)

126

(-61%)

182

(-56%)

Large

intestine

2223

2675

(+20%)

3576

(+61%)

3458

(+56%)

Slide31

Tab.3.

Bile acid binding capacity

by pastry goods.„-” means decrease of bile acid in comparison to control sample , „+” means increase of bile acid in comparison to control sample.

Control

(mg/

mL

)

CB

(mg/

mL

)

BB1

(mg/

mL

)

BB2

(mg/

mL

)

Cholic acid

Small

intestine

3265

2257

(-31%)

3087

(-5%)

274

(-92%)

Large

intestine

3055

3458

(+13%)

3332

(+9%)

1250

(-59%)

Deoksycholic

acid

Small

intestine

11181

848

(-92%)

765

(-93%)

29

(-99%)

Large

intestine

2696

3527

(+31%)

3136

(+16%)

301

(-89%)

Lithocholic

acid

Small

intestine

320

91

(-72%)

126

(-61%)

182

(-56%)

Large

intestine

2223

2675

(+20%)

3576

(+61%)

3458

(+56%)

Slide32

www.skinmed.com

Slide33

Conclusions Biscuits containing bioactive ingredients were characterized by a higher content of NDF and TDF dietary fibre, as compared with the control samples

It was found that the ability to bind bile acids depended both on the type of tested product and the type of bile acidThe highest cholic and deoksycholic acid binding

ability was observed in case of bioactive biscuits 2 The content of cholic, deoksycholic and lithocholic acid in the large intestine section increased in case of control biscuits and bioactive biscuits 1.

Slide34

Thank

You