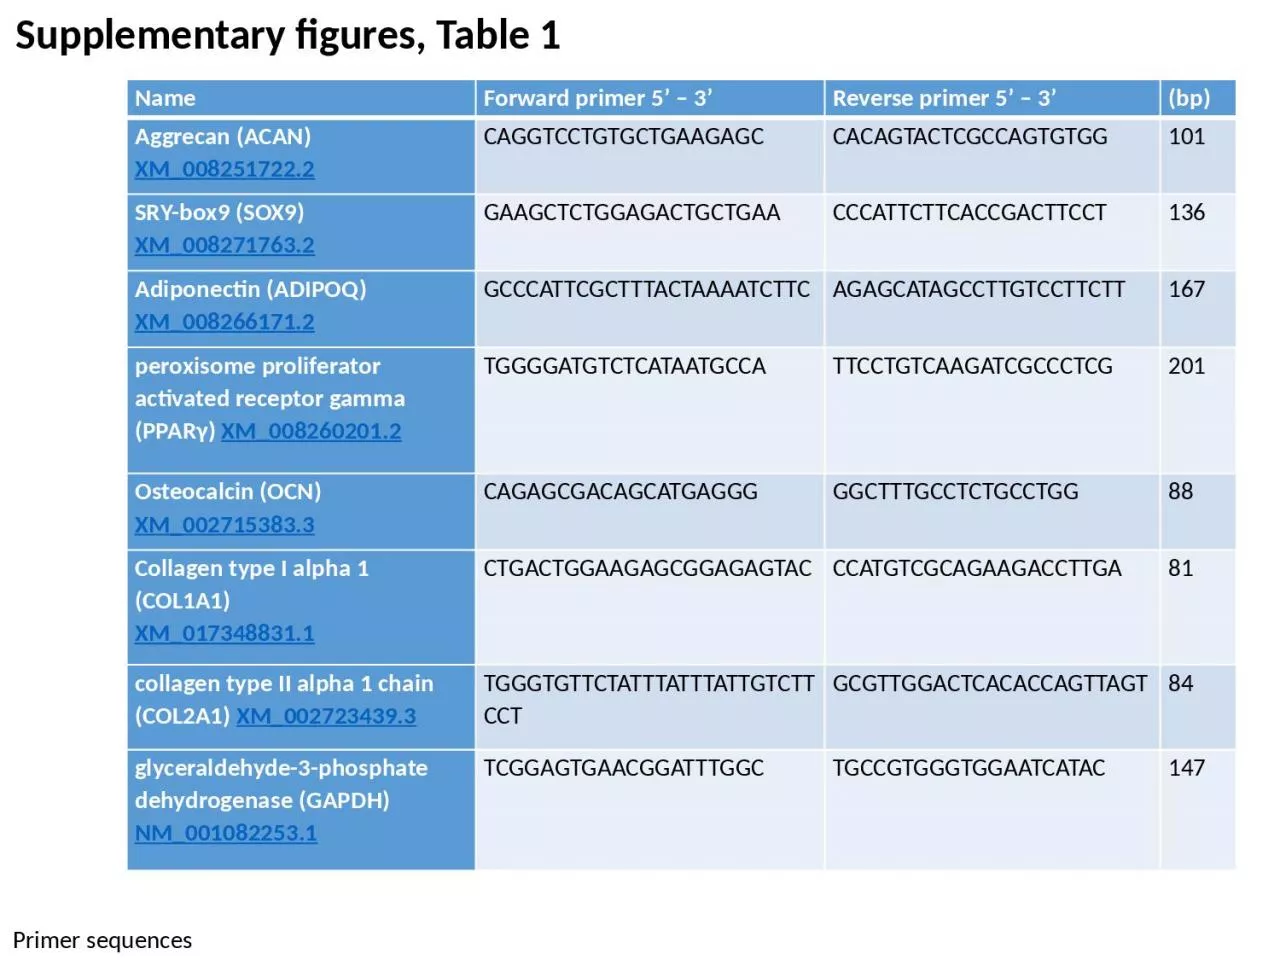
Reverse primer 5 3 bp Aggrecan ACAN XM0082517222 CAGGTCCTGTGCTGAAGAGC CACAGTACTCGCCAGTGTGG 101 SRYbox9 SOX9 XM0082717632 GAAGCTCTGGAGACTGCTGAA CCCATTCTTCACCGACTTCCT 136 ID: 930728
Download Presentation The PPT/PDF document "Name Forward primer 5’ – 3’" is the property of its rightful owner. Permission is granted to download and print the materials on this web site for personal, non-commercial use only, and to display it on your personal computer provided you do not modify the materials and that you retain all copyright notices contained in the materials. By downloading content from our website, you accept the terms of this agreement.
Slide1
NameForward primer 5’ – 3’Reverse primer 5’ – 3’(bp)Aggrecan (ACAN)XM_008251722.2CAGGTCCTGTGCTGAAGAGCCACAGTACTCGCCAGTGTGG101SRY-box9 (SOX9)XM_008271763.2GAAGCTCTGGAGACTGCTGAACCCATTCTTCACCGACTTCCT136Adiponectin (ADIPOQ)XM_008266171.2GCCCATTCGCTTTACTAAAATCTTCAGAGCATAGCCTTGTCCTTCTT167peroxisome proliferator activated receptor gamma (PPARγ) XM_008260201.2TGGGGATGTCTCATAATGCCATTCCTGTCAAGATCGCCCTCG201Osteocalcin (OCN)XM_002715383.3CAGAGCGACAGCATGAGGGGGCTTTGCCTCTGCCTGG88Collagen type I alpha 1 (COL1A1)XM_017348831.1CTGACTGGAAGAGCGGAGAGTACCCATGTCGCAGAAGACCTTGA81collagen type II alpha 1 chain (COL2A1) XM_002723439.3TGGGTGTTCTATTTATTTATTGTCTTCCTGCGTTGGACTCACACCAGTTAGT84glyceraldehyde-3-phosphate dehydrogenase (GAPDH)NM_001082253.1TCGGAGTGAACGGATTTGGCTGCCGTGGGTGGAATCATAC147
Supplementary figures, Table 1
Primer sequences
Slide2HE-staining osteochondral drill model, unpublished data from Oliver Huwert (representative slices)A: Scaffold without cells after 3 weeks, B: Scaffold with chondrocytes after 3 weeks, C: Scaffold without cells after 6 weeks, D: Scaffold with chondrocytes after 6 weeks, E: Scaffold without cells after 12 weeks, F: Scaffold with chondrocytes after 12 weeksDifferences for histological scoring were already statistically significant different after 3 weeks, showing superior results when chondrocytes were implanted with the scaffold.500µm500µm500µm500µm500µm500µmABCDEFSupplementary figures, Figure 1
Slide3Supplementary figures, Figure 2controlosteogenicAlizarin RedDay 21ABCDEOsteogenic differentiation of rabbit SMSC in passage 3 (P3). A and B show phase contrast microscopy following induction of osteogenic differentiation. The cells change their phenotype typically, but the increase of calcium deposition (Alizarin Red staining, C) is rather small. Accordingly, the induction of typical genes associated with osteogenic differentiation as collagen type 1 (col1) and osteocalcin (OCN) showed only a minimal increase (D) (n=3, p<0.05). ALP activity was not different in differentiated cells compared to controls (E).
Slide4Supplementary figures, Figure 3Adipogenic differentiation of rabbit SMSC. A and B show the Oil Red O stain following induction of adipogenic differentiation. The cells change their phenotype typically, but the fat droplets are rather small. Accordingly, the induction of typical genes associated with adipogenic differentiation such as PPARG and AN (adiponectin) show an increase, which was marginal in case of AN (n=3, p<0.05).ABC
Slide5Supplementary figures, Figure 4AFor the biomechanical analysis, femoral condyles were fixed in polymethylmethacrylate (PMMA). By means of a camera associated to the Mach-1 (Model V500css) unit, the points for analysis were selected. The black points mark the measuring positions on a sample, the blue points are for calibration of coordinates.
Slide6Description of data processing for the mechanical properties with principle for correction of thickness.Thickness (h) = vertical distance x cosine (θz)Supplementary figures, Figure 4B
Slide7contact to surfacemaximum penetration depthstress relaxationFigure 4C: Example for a strain-relaxation test for one sampleThe figure shows a typical strain-relaxation curve for an unconfined compression test as used for biomechanical testing.