/
Introduction to  Directed Acyclic Graphs (DAGs) in ( Introduction to  Directed Acyclic Graphs (DAGs) in (

Introduction to Directed Acyclic Graphs (DAGs) in ( - PowerPoint Presentation

SillyGoose
SillyGoose . @SillyGoose
Follow
342 views
Uploaded On 2022-08-03

Introduction to Directed Acyclic Graphs (DAGs) in ( - PPT Presentation

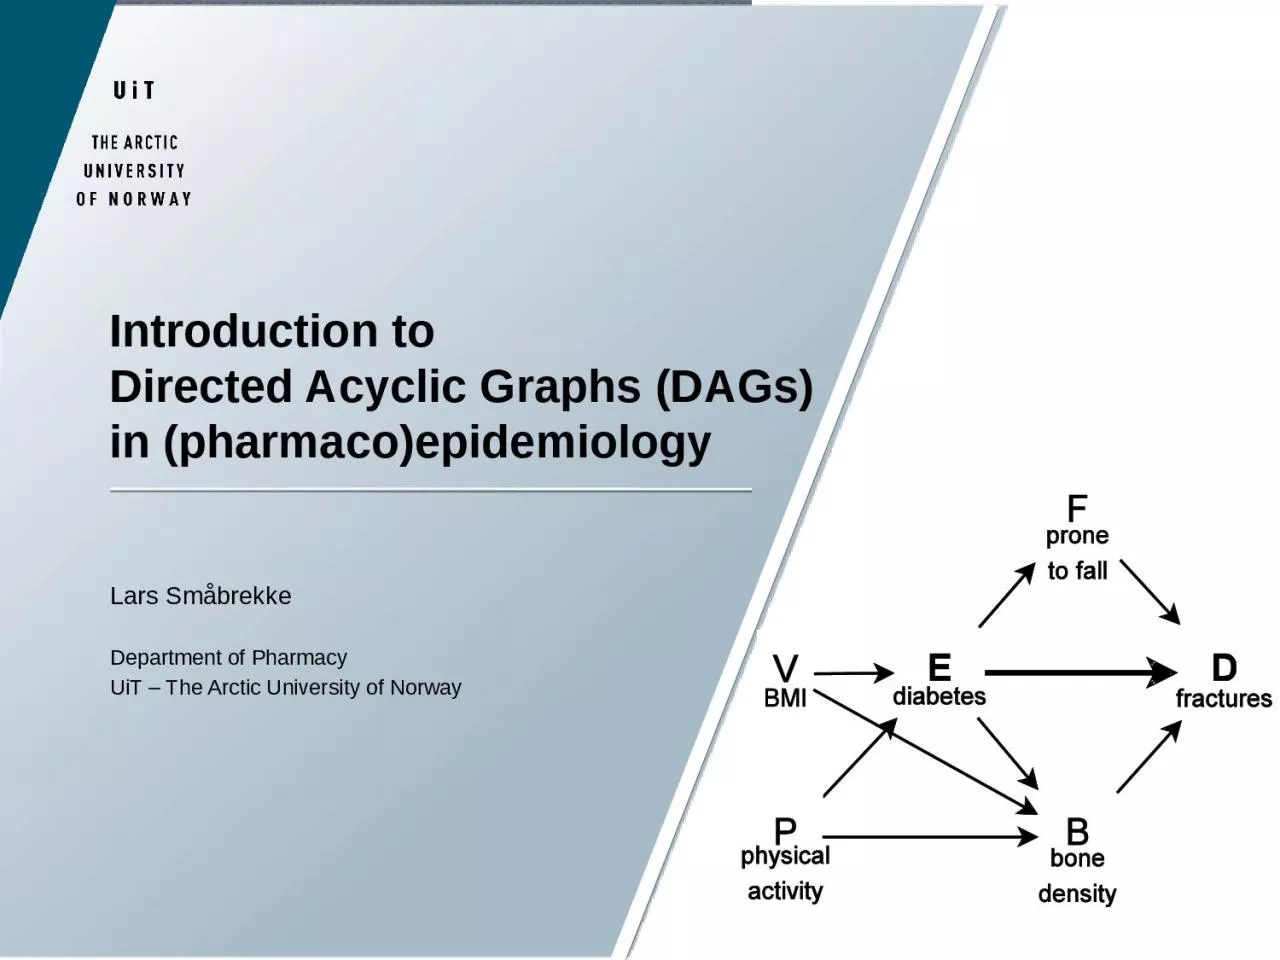
pharmaco epidemiology Lars Småbrekke Department of Pharmacy UiT The Arctic University of Norway Why bother with Directed Acyclic Graphs DAGs Our problem Observational data and experimental data are different ID: 934577

causal bias open effect bias causal effect open amp path selection total collider variables exposure smoking adjust unmeasured direct

Share:

Link:

Embed:

Download Presentation from below link

Download Presentation The PPT/PDF document "Introduction to Directed Acyclic Graphs..." is the property of its rightful owner. Permission is granted to download and print the materials on this web site for personal, non-commercial use only, and to display it on your personal computer provided you do not modify the materials and that you retain all copyright notices contained in the materials. By downloading content from our website, you accept the terms of this agreement.


Presentation Transcript

Slide1

Introduction to

Directed Acyclic Graphs (DAGs) in (

pharmaco

)epidemiology

Lars Småbrekke

Department of PharmacyUiT – The Arctic University of Norway

Slide2

Why bother with Directed Acyclic Graphs (DAGs)?

Our problem

Observational data and experimental data are different

We face many pitfalls in the analysis of observational dataConfounding, colliding, conditioning on the outcome, regression to the mean, mathematical coupling bias, composite variable bias……..What about RCT’s? Biased?

Slide3

Conclusion

Why bother with DAGs?

DAGs help in identifying the status of the covariates in a statistical

model (=confounders, mediators & colliders)Variables that needs to be adjusted for, and unintended consequences of adjustment

Consequence of adjustment for variables affected by prior exposure Time dependent bias (not a topic today)Encourages more transparent researchState your estimand (“What you seek”)

E.g. The true difference in outcome due to exposureState your estimator (“How you will get there”)E.g. GLMsState you estimate (What you get”)The estimated difference in outcome from model coefficient

Slide4

Conclusion

Why bother with DAGs?

DAGs don’t showDirection of effect or “strength” of effect

Interaction, synergism, antagonism

Slide5

Agenda

Conclusion

& BackgroundDefinitions & terminologyDAG concepts

Paths, causal & non-causalConfounder, mediator & collider (proxy confounder, competing exposure)Drawing and interpreting DAGsExercises (entry level) Introduction

to DAGitty

Slide6

Examples & Exercises

Courtesy of

Hein Stigum (Norwegian Institute of Public Health)

Jon Michael Gran (UiO)Articles by: Shrier & Platt 2006Fleischer et al 2008Platt et al 2009

Schisterman et al. 2009Williamson et al 2014Rohrer 2018Lectures available on www by:Schipf, Hardt

& Knuppel de Stavola et al Judea Pearl Arnold KF Tennant PWG

Judea Pearl. «Causality - Models, Reasoning and Inference, 2009»www.dagitty.net (learning module)

Projects in cooperation with:Pål Haugen, June Utnes Høgli, Dina

Stensen, Kristian SvendsenDiscussions with Per-Jostein Samuelsen (RELIS)

Slide7

Models in examples & exercises

May be:

UnrealisticOver simplifiedBadly chosen

WrongHowever – I hope they can serve for the sake of exemplificationIn the real world – models should be simple enough to be useful, and complex enough to be realistic Missing arrows in a non-causal path will often be included in a closed path Moving out along the causal chain tend to weaken associations with the outcome

Slide8

Background

Data driven analysis

- examples

Step-wise backward selection of covariates Based

on p-values Change in estimate

Omission of a variable in a model changes the estimated

exposure effect more than a prespecified threshold

Or more advanced tools for model selectionTrade-off between complexity of a model and goodness of fit

Using these analytical strategies alone can increase rather than decrease bias

The

direction and the level of bias can be unknown

Slide9

BackgroundData driven analysis

DAGs = non-parametric models that consists of nodes (=variables) and directed arrows

Assume this model on E(

xposure) & D(isease). The pointed arrow shows that E precedes D

E is part of the function that we use to assign a value to D

E

D

By introducing an arrow between E&D we have made an assumption on causality, and that a change in E causes a change in D

Slide10

BackgroundData driven analysis

DAGs = non-parametric models that consists of nodes (=variables) and directed arrows

Assume this model on E(

xposure) & D(isease). (Arrow shows that E precedes D)

Building blocks of a DAGChain: E  B  DFork: E 

B  D Collider: E  B 

DE

D

By introducing an arrow between E&D we have made an assumption on causality, and that a change in E causes a change in D

The presence of either may affect the association of interest, and inclusion in regression may change the effect estimates

B

Slide11

Definitions & terminology

A node

has at least two valuesPath = any trail from E to D with out repeating itself (= “acyclic”)

What would be the interpretation of a circular path?A logic consequence - a path cannot pass twice through the same nodeBut different paths can pass through the same node

Variables connected with an arrow (or several variables with arrows in the same direction) = a causal pathAlmost any causal definition will workVariables connected with arrows in different directions =

a non-causal pathNo path = independencyThe dose response can be linear, threshold, U-shaped or any other (DAGs are non-parametric

)

Slide12

Definitions & terminology

A path can be open or closed

Conditioning on a variable (=adjusting, stratifying or restricting) is denoted by a parenthesis (or a box) in

a diagramE  [B] 

DConditioning may close or open a pathSequence of connected variables

Parent to child E  DAncestors  

DescendantsExogenous variables = variables with no parents

See references for a more comprehensive overview of terminologyE.g. “back doors”, “front doors”, “d-separation”

Slide13

Identifying

causal effects from

observational data

Three general causal assumptionsExchangability

A positive probability for receiving the intervention for everyone

in the populationA well defined intervention

(e.g. not multiple versions of treatment). If not met, the magnitude

of effect will

depend on

the

proportion

receiving

each

version

of

the

intervention

Slide14

Causal diagrams

Directed Acyclic

Graphs (DAGs)For

a diagram to represent a causal system, all common causes of any pair of variables must be included i

n the diagramThis is huge undertaking!!!It can be difficult

to identify «the correct model»Divergent

information on causal relationships between variables (i.e.

what is the direction

of an arrow)Consequence

: Draw and run

several

models

!

Slide15

Definitions & terminology

In statistical modeling

A causal path will not induce bias – keep openA non-causal path will induce bias – try to closeAdjusting, stratifying or restricting (= Conditioning in DAG terminology) on a variable can close or open a path depending on the status of the variable

What

is «the status of the variable» in a

statistical model?

Slide16

Example Association and cause - basics

A common cause

Condition on smoking

Smoking

Smoking

YF

LC

+

+

+

YF

LC

A confounder induces an association between its effects

Conditioning

(= restrict

, stratify, adjust

) on

a confounder removes the

association

+

+

Slide17

Example Association and cause - basics

M

ediating variable. A part of the effect of DM on MI is caused by the effect of DM on CHLAssessing the total effect of DM on MI = No adjustment

Assessing the direct effect of DM on MI = Adjust for CHL

Slide18

Example Association and cause - basics

Collider variable (two parents of one variable on the same path)

Adjusting for e.g. age among those with erectile dysfunction opens a path between CCI and alcoholism, induces spurious correlations and bias

True also if you condition on any children of the colliderConditioning on a collider is considered a rudimentary analytical mistake

Slide19

Four simple rules

(From Stigum)

A causal path =

all arrows in the same

direction:

E



D (Open path)

A non-causal path = arrows in different directions

Confounder: 

C (Open path)

Collider: 

K

(

Closed

path

)

Conditioning

on a non-collider closes the path: 

[M] or [C]

Conditioning

on a collider (or a descendant) opens the path:

[K] (=bias)

Slide20

DAG – example & comments

(Example from Stigum)

Is the total effect of E on D biased?

Should we adjust for C?

What happens if C also has a direct effect on D?

Is it a problem if U is unmeasured?

2 min

Slide21

DAG – example & comments

Is the total effect of E on D biased?

Should we adjust for C?

What happens if C also has a direct effect on D?

Path

Type

Status

Consequence

E

D

Causal

Open

E

C

U

D

Non-causal

Open

Bias

E

C

D

Non-causal

Open

Bias

Adjusting

for C

E

D

Causal

Open

E

[C]

U

D

Non-causal

Closed

No bias

E

[C]

D

Non-causal

Closed

No bias

?

Slide22

DAG – example & comments

Is it a problem if U is unmeasured?

Path

Type

Status

Consequence

E

D

Causal

Open

E

C

U

D

Non-causal

Open

Bias

E

C

D

Non-causal

Open

Bias

Adjusting

for C

E

D

Causal

Open

E

[C]

U

D

Non-causal

Closed

No bias

E

[C]

D

Non-causal

Closed

No bias

Slide23

Example

Association and cause – more advanced concepts

(X=Exposure & Y=Outcome in all examples

) (DAGitty – learning module)Proxy confounders are covariates that are not themselves confounders, but lie "between" confounders and the exposure or outcome in a causal chain

A proxy confounder is a descendant of a confounder and an ancestor of either the exposure or the outcome but not both; else it would be a confounderAdjustment on proxy confounders depends on whether you will analyze direct (=adjust) or total effect (=not adjust)

Example: A & M are proxy confounders

Slide24

Example Association and cause – more advanced concepts

Competing exposure

is an ancestor of the outcome that is not related with the exposure - it is neither a confounder, nor a proxy confounder, nor a

mediator Including competing exposures in a regression model will not affect bias, but may improve precision

Slide25

Drawing DAGs - Direction of arrow?

(From

Stigum

)

25

D

Diabetes 2

E

Phys. Act.

C

Smoking

D

Diabetes 2

E

Phys. Act.

C

Smoking

H

Health con.

?

Does physical activity reduce smoking,

or

does smoking reduce physical activity?

Maybe

another

variable

(health consciousness)

is causing both?

Slide26

HC

use

and nasal

carriage of S. aureus

Slide27

Exercise

Tea and depression (

Example from Stigum)

27

Write the paths

You want the

total effect

of tea on depression. What would you adjust for?

You want the

direct effect

of tea on depression. What would you adjust for?

Is caffeine a mediator or a confounder?

5

minutes

Slide28

Exercise (direct & indirect effects, intermediate variables)

Tea

and depression

28

See table

Total effect: adjust for ODirect effect: adjust for C & OThe status of a variables is defined by its path. Caffeine is

both a mediator and a proxy confounder (the proportion of caffeine coming from coffee)

Path

Type

Status

E→D

Causal

Open

No bias

E→C→D

Causal

Open

No bias

E←O→C→D

Non-

causal

Open

Bias

Slide29

29

Exercise

Statin

use

and CHD

(Example from Stigum

)

Write the paths

You want the total effect of statin on CHD. What would you adjust for?

If lifestyle is unmeasured, can we estimate the direct effect of statin on CHD (not mediated through cholesterol)?

Is cholesterol a mediator or a collider?

5

minutes available

E

statin

D

CHD

C

cholesterol

U

lifestyle

Slide30

30

Exercise

(direct & total effect)

Statin and CHD (Example of collider stratification bias)

See tables

Total effect: no adjustments

Direct effect: impossible

C is an intermediate variable in path 2

and

collider in path 3

Path

Type

Status

1

E→D

Causal

Open

No bias

2

E→C→D

Causal

Open

No bias

3

E→C←U→D

Non-

causal

Closed

No bias

Adjusting

on

C

Path

Type

Status

1

E→D

Causal

Open

No bias

2

E→[C]→D

Causal

Closed

Bias (total

effect

)

3

E→[C]←U→D

Non-

causal

Open

Bias (

direct

effect

)

Slide31

Summary on total and direct effects

Total effect

no unmeasured U1

no unmeasured U231

+

Direct and total effectsno unmeasured U3

Estimating direct effect increase complexity and requires more prior assumptions than a total model

E

D

M

U2

U3

U1

Slide32

Exercise

Diabetes and

Fractures

(From

Stigum)

32

Draw the paths

Is B a collider?

Estimate

total effect

of E

on fractures. Adjusting?

What happens if P has an

effect on V?

5

minutes

Slide33

Exercise

(confounders, colliders & mediators)

Diabetes and Fractures

33

Unconditional


Path

Type

Status

1

E→D

Causal

Open

2

E→F→D

Causal

Open

3

E→B→D

Causal

Open

4

E←V→B→D

Non-causal

Open

5

E←P→B→D

Non-causal

Open

Mediators

Confounders

See table

No – there is no single path where B is a collider

Adjust for V and P

Already adjusted

for V

Slide34

34

Exercise

Survivior

bias

(Example from

Stigum

)

We want to study exposure early in life (E) on later disease (D) among survivors (S)

Early exposure decreases survivalA risk factor (R) increases later disease (D) and reduces survival (S)

Only survivors are available for analysis

Draw the DAG

What is the effect of adjusting on survivors?

Is it possible to give a non-biased estimate on effect of E on D?

5

minutes

Slide35

Exercise

Survivor bias

S

E

D

See figure

See table. BiasYes. Adjust for R

E→D

Causal

Open

No bias

E→S→D

Causal

Open

No bias

E→[S]

R→D

Non-

causal

Open

Bias

E→[S]

←[

R]→D

Non-

causal

Closed

No bias

R

(-)

(+)

(-)

Slide36

Overadjustment

Inconsistent

definition of

«overadjustment»The Dictionary of epidemiology: «Statistical adjustment

of an excessive number of variables….. It can

obscure a true effect or create an apperant effect

when none exist»Rothman & Greenland: «Intermediate variables,

if controlled in an

analysis, would usually

bias

results

towards

the

null….

Such

control

of

an

intermediate

may

be

viewed

as a form

of

overadjustment

Slide37

Overadjustment &

unnecessary adjustment

(Schisterman et al 2009)

Causal diagrams Can distinguish overadjustment

bias from confounding, selection bias and unnecessary adjustment

Definition (from Schisterman et al)Overadjustment biasControl for a mediator (or a

descending proxy for a mediator) on a causal

path from exposure to

outcomeUnnecessary adjustment

Control for a variable

whose

control

does

not

affect

the

expectation

of

the

estimate

of

the

total

causal

effect

between

exposure

and

outcome

(

but

may

affect

precision

)

Slide38

Overadjustment bias (

Schisterman et el 2009)

The simplest form of

overadjustment bias E [M] D

E =

Prepregnancy

BMIM = Triglycerides

D = Preeclapsia

In

this

scenario

you

can

estimate

the

total

effect

of E

on

D

using

common

regression

techniques

by

ignoring

M (M =

mediator

)

However

adjusting

for M

can

provide

an estimat of

the

direct

effect

of E

on

D under

certain

assuptions

Slide39

Overadjustment bias (

Schisterman et el 2009)

Another

example of overadjustment bias E U D

[M]

E = Smoking

U =

Abnormality

of the endometrium

(

Typically

unmeasured

)

M = Prior

history

of

spontaneous

abortion

(

Descending

proxy

of U, or an

event

caused

by U)

D =

Current

spontaneous

abortion

In

this

scenario

you

can

still

estimate

the

total

effect

of E

on

D

using

common

regression

techniques

by

ignoring

M

However

adjusting

for M

cannot

provide

an estimate of the direct effect of E on D without bias. Leaves an partially open path from E  [U  D

Slide40

Overadjustment bias (

Schisterman et el 2009)

Another

example of overadjustment bias E U D

[M]

E = Smoking

U =

Abnormality

of the endometrium

(

Typically

unmeasured

)

M = Prior

history

of

spontaneous

abortion

(

Descending

proxy

of U, or an

event

caused

by U)

D =

Current

spontaneous

abortion

In

this

scenario,

conditioning

on

M

will

not

block

the

path

from E to

U to D

, and (

no

bias from M =>

ascending

proxy

to U)

Slide41

Overadjustment bias (

Schisterman et el 2009)

Generalization of

previous DAG#2. Illustrates a general problem with control of

variables affected by exposure such as U and M

E U D M V

E = Smoking

U =

Abnormality

of

the

endometrium

(

Typically

unmeasured

)

M = Prior

history

of

spontaneous

abortion

(

Descending

proxy

of

U)

D =

Current

spontaneous

abortion

V =

Unmeasured

common

cause

of

M and D

causes

additional

bias in

the

association

between

E and D for

levels

of

M.

Adjusting

on

the decending proxy M will cause collider-stratification bias

Slide42

Overadjustment bias (

Schisterman et el 2009)

Maternal smoking and neonatal

mortality E U D

M V

E =

Pregnancy maternal smoking

U = Unmeasured fetal

development during pregnancy

M =

Birth

weigth

(

Decending

proxy

of U)

D = Neonatal

mortality

V =

Unmeasured

common

cause

of U and D

Slide43

Overadjustment bias (

Schisterman et el 2009)

Maternal smoking and neonatal

mortality E U D

M V

E =

Pregnancy maternal smoking

U = Unmeasured fetal

development during pregnancy

M =

Birth

weigth

(

Decending

proxy

of U)

D = Neonatal

mortality

V =

Unmeasured

common

cause

of U and D

Including

M in

the

model

would

not be

overadjustment

Slide44

The effect

of maternal smoking and neonatal mortality

(Schisterman et al 2009)

Including 10,035,444 live births in the USA from 1999-2001

Unadjusted risk ratio for the association between maternal smoking and neonatal mortality

: 2.49 (95% CI 2.41-2.56)Adjustment for birth weight: 2.03 (95 % CI 1.97-2.09)This difference is

probably because smoking causes changes in U that

affects birth

weight and neonatal mortality separately

Slide45

Unnecessary

adjustment(

Schisterman et al 2009)

Unnecessary

adjustment occurs in 4 situations:C1: A variable

outside the system of interestC2: A variable that

causes the exposure onlyC3: A decendant

of E not in the causal

pathwayC4&C5: A cause or a

decendant

of

the

outcome

alone

The

result

of

adjustment

on

such

variables: The total

effect

of

exposure

on

outcome

will

remain

unchanged

Slide46

Summing up so far……

Data driven analyses

of observational data is not enough – we need (causal) information from outside the data

DAGs visualize this information and guide the planning of a study and the analysisDAGs visualize the concepts of confounding, mediation & colliding, and highlights possible adjusting strategies

Increases transparency!!

46

Slide47

Selection bias

C

ommon consequence The association between exposure and outcome among those selected for

analysis differs from the association among those eligibleVisualizing selection biasDo the heterogeneous types of selection bias share a common underlying causal structure?

47

Slide48

Selection bias

Concept 1: Assume selected are different from unselected

Prevalence (D)

Old have higher prevalence than young

Old respond less to survey (=selection) Selection bias: prevalence underestimatedEffect (E→D

)Old have lower effect of E than

youngOld respond less to surveySelection bias:

Effect overestimated

48

Slide49

Selection

bias (from Stigum

)Concept 1. Assume selected are different from unselected

age

smoke

CHD

S

Properties

Need smoke-age interaction

Cannot

be adjusted

for (but

stratum effects

OK)

True RR=weighted average of stratum effects

RR in “natural

range

(2.0-4.0)

Scale dependent (linear vs. multiplicative model)

Normally, selection variables unknown

Paths

Type

Status

smoke

®

CHD

Causal

Open

49

Slide50

Selection bias

Concept 2: Distorted E - D distributions

In DAG terminology

Collider biasIn wordsSelection by sex and/or

ageDistorted sex-age distributionOld have more diseaseMen are more

exposedDistorted E - D distribution

50

Slide51

Selection bias

Concept 2: Distorted E-D distributions

smoke

CHD

age

S

sex

Paths

Type

Status

smoke

®

CHD

Causal

Open

smoke

¬

sex

®[

S

age

®

CHD

Non-causal

Open

Properties:

Open non-causal path (collider)

Independent of interaction

Can be adjusted

for (sex or age)

Not in “natural” range

(“surprising bias”)

Name:

Collider

stratification

bias

Ref:

Hernan

et al, A structural approach to selection bias, Epidemiology 2004

Selection bias types:

Berkson’s

, loss to follow up, nonresponse, self-selection, healthy worker

51

Slide52

Exercise

E

D

A

B

Show the paths

Should we adjust for C?

If the design implies a selection on C, what would you call the resulting

bias?

C

2

minutes

52

Slide53

Exercise

E

D

A

B

Show the

paths (See table)

Should we adjust for C

? (No)

If the design implies a selection on C, what would you call the resulting

bias? (Selection on C will open the non-causal path and introduce Collider bias)

C

E

D

Causal

Open

E

A

C

B

D

Non-causal

Closed (C=collider)

53

Slide54

Exercise: Dust and COPD

(from Stigum)

Assume a

cross-sectional study on workers in metal melt halls to investigate the effect of dust exposure on COPDOnly workers currently in the melt hall are studied. Include a variable called “Current Worker”.

AssumptionsWorkers who are sensitive to dust are more likely to abandon melt hall work. Subjects with general good health (genes) are more likely to keep the job, and less likely to develop lung disease.

COPD risks

54

Slide55

Exercise: Dust and COPDChronic Obstructive Pulmonary Disease

Calculate the effect of dust on COPD in good and poor health groups.

Write the paths.

What would you adjust for?Suppose the true effect of dust on COPD is RR=2 and the crude effect is RR=0.7. What do you call this bias?

Could the concept 1 (interaction based) selection bias work here?

10

minutes

COPD risks

55

Slide56

Exercise: Dust and COPDChronic Obstructive Pulmonary Disease

RR = 2 in both health groups

See table

HSuppose the true effect of dust on COPD is RR=2 and the crude RR=0.7. What do you call this bias?

Healthy worker effectCould the concept 1 (interaction based) selection bias work here? No. RR cannot be the same in both health groups. This means there is no interaction between dust & health

E

cur. dust

D

COPD

S

c

ur. worker

H

health

E

0

prior dust

D

0

diseases

COPD risks:

E→D

Causal

Open

No bias

E←E

0

→D

0

→[S] ←H→D

Non-

causal

Open

Bias

E←E

0

→D

0

→[S] ←[H]→D

Non-

causal

Closed

No bias

56

Slide57

57

Recommended reading

Books

Hernan

, M. A. and J. Robins.

Causal Inference

. What if? (2020)

Rothman, K. J., S. Greenland, and T. L. Lash.

Modern Epidemiology

(2008)

Morgan and

Winship

,

Counterfactuals and Causal Inference (

2009)

Pearl J,

Causality – Models, Reasoning and Inference (

2009)

Veierød

, M.B.,

Lydersen

, S.

Laake,P

. Medical

Statistics (2012)

Papers

Greenland, S., J. Pearl, and J. M. Robins.

Causal diagrams for epidemiologic research,

Epidemiology 1999

Hernandez-Diaz, S., E. F.

Schisterman

, and M. A.

Hernan

.

The birth weight "paradox" uncovered?

Am J

Epidemiol

2006

Hernan

, M. A., S. Hernandez-Diaz, and J. M. Robins.

A structural approach to selection bias,

Epidemiology 2004

Weinberg, C. R.

Can DAGs clarify effect modification?

Epidemiology 2007

Schisterman

EF et al. Epidemiology 2009;20(4):488-95

Williamson EJ et al.

Respirology

2014;19:303-11

Hernan MA et al.

the Simpson’s

paradox unraveled

.

J

Int

Epidemiol

2011

Slide58

References

Greenland S &

Brumback B. An overview of relations among causal modeling methods. Int

J Epidemiol 2002Hernan MA, Hernandez-Diaz S & Robins JM. A structural approach to selection bias. Epidemiology 2004

Hernan MA & Cole RS. Causal diagrams and measurement bias. Am J Epidemiol 2009VanderWeele TJ & Robins JM. Directed acyclic graphs, sufficient causes, and the properties of conditioning on a common effect. Am J

Epidemiol 2007VanderWeele TJ, Hernan MA & Robins JM. Causal directed acyclic graphs and the direction of unmeasured confounding bias. Epidemiology 2008VanderWeele

TJ. The sign of the bias of unmeasured confounding. Biometrics 2008Hernan, M. A. and J. Robins. Causal Inference. What if? (2020)

58