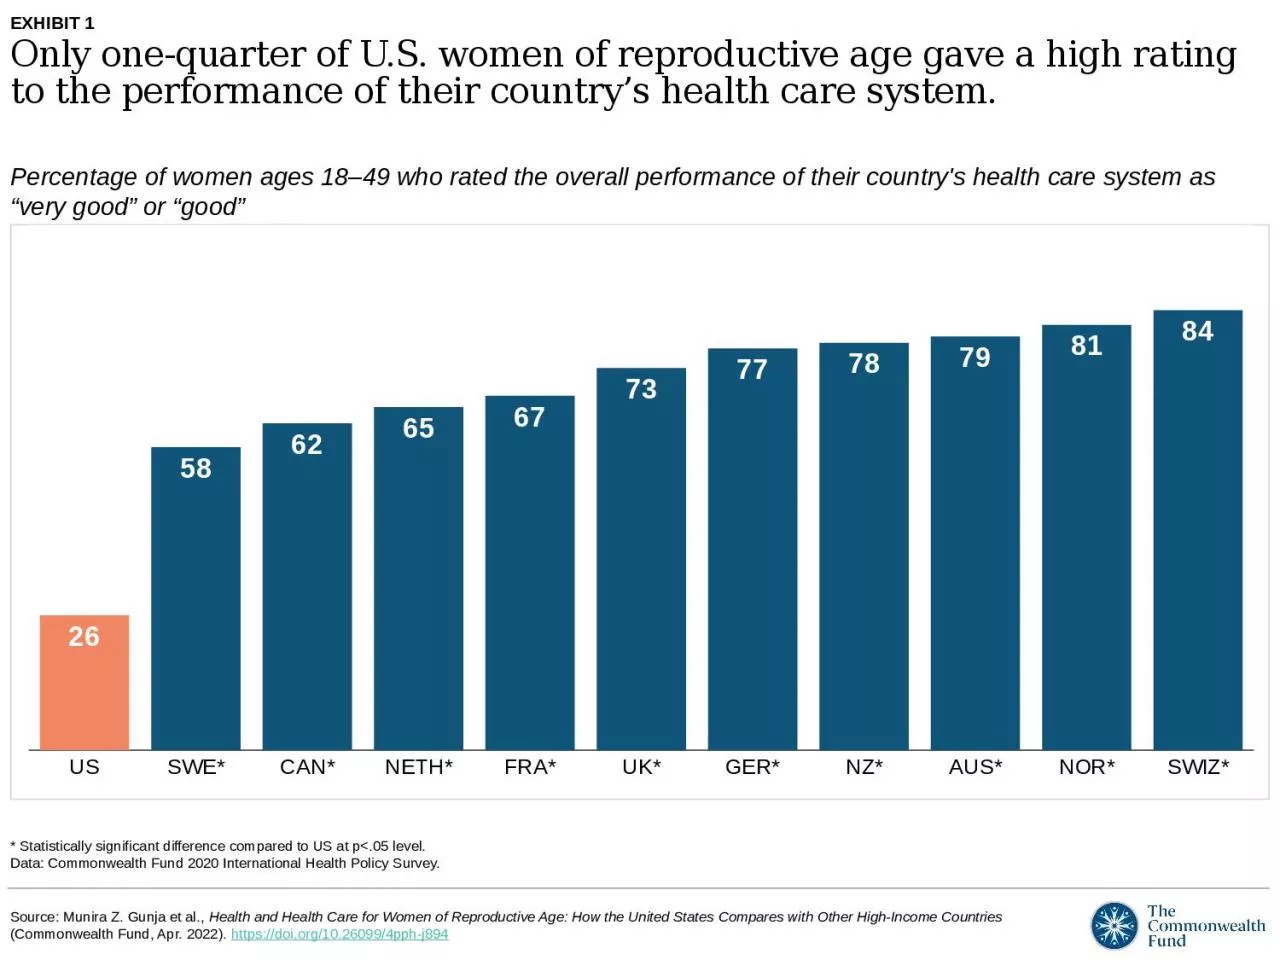
/
Percentage of women ages 18–49 who rated the overall performance of their country's Percentage of women ages 18–49 who rated the overall performance of their country's

Percentage of women ages 18–49 who rated the overall performance of their country's - PowerPoint Presentation

Soulreaver
Soulreaver . @Soulreaver
Follow
342 views
Uploaded On 2022-08-03

Percentage of women ages 18–49 who rated the overall performance of their country's - PPT Presentation

very good or good Statistically significant difference compared to US at plt05 level Data Commonwealth Fund 2020 International Health Policy Survey EXHIBIT 1 Only onequarter of US women of reproductive age gave a high rating to the performance of their countrys health c ID: 933920

health data 2020 women data health women 2020 exhibit percentage medical compared survey policy international fund commonwealth level significant

Share:

Link:

Embed:

Download Presentation from below link

Download Presentation The PPT/PDF document "Percentage of women ages 18–49 who rat..." is the property of its rightful owner. Permission is granted to download and print the materials on this web site for personal, non-commercial use only, and to display it on your personal computer provided you do not modify the materials and that you retain all copyright notices contained in the materials. By downloading content from our website, you accept the terms of this agreement.


Presentation Transcript

Slide1

Percentage of women ages 18–49 who rated the overall performance of their country's health care system as “very good” or “good”

* Statistically significant difference compared to US at p<.05 level.Data: Commonwealth Fund 2020 International Health Policy Survey.

EXHIBIT 1

Only one-quarter of U.S. women of reproductive age gave a high rating to the performance of their country’s health care system.

Slide2

Percentage of women ages 18–49 who reported having a regular doctor or regular place of care

* Statistically significant difference compared to US at p<.05 level.Data: Commonwealth Fund 2020 International Health Policy Survey.

EXHIBIT 2

It is less common for women of reproductive age in the U.S., Sweden, Canada, and Australia to have a regular doctor or place of care.

Slide3

Percentage of women ages 18–49 with out-of-pocket costs of $2,000 or more†

† Percentage of respondents who reported that their annual (past year) family out-of-pocket spending for medical treatments or services that were not covered by public or private insurance was $2,000 or more.* Statistically significant difference compared to US at p<.05 level. Respondents in Sweden were not asked this series of questions.

Data: Commonwealth Fund 2020 International Health Policy Survey.

EXHIBIT 3

Women of reproductive age in the U.S. and Switzerland spend more out of pocket on health care than women in other high-income countries.

Slide4

Percentage of women ages 18–49 with at least one cost-related access problem

Note: Cost-related access problems include any of the following in the past year: 1) had a medical problem but did not visit a doctor; 2) skipped a medical test, treatment, or follow-up recommended by a doctor; or 3) did not fill or collect a prescription for medicine, or skipped doses of medicine, because of the cost in the past 12 months.* Statistically significant difference compared to US at p<.05 level.

Data: Commonwealth Fund 2020 International Health Policy Survey.

EXHIBIT 4

Women of reproductive age in the U.S. are the most likely to skip or delay needed care because of costs.

Slide5

Percentage of women ages 18–49 with at least one medical bill problem

Note: Medical bill problems include any of the following in the past year: 1) had serious problems paying or were unable to pay medical bills; 2) spent a lot of time on paperwork or disputes related to medical bills; or 3) were denied insurance payments or were paid less than expected.* Statistically significant difference compared to US at p<.05 level.

Data: Commonwealth Fund 2020 International Health Policy Survey.

EXHIBIT 5

U.S. women of reproductive age are the most likely to have problems paying

medical bills.

Slide6

Avoidable mortality deaths per 100,000 females

Notes: 2016 data for FRA, NZ, NOR, and UK; 2017 data for CAN, SWIZ, and US; 2018 data for AUS, NETH, and SWE; 2019 data for GER. The list of deaths considered “avoidable” is from: Organisation for Economic Co-operation and Development,

Avoidable Mortality: OECD, Eurostat Lists of Preventable and Treatable Causes of Death

(OECD, Jan 2022), p. 11.Data: OECD Health Data, 2021.

EXHIBIT 6

U.S. women have the highest rate of avoidable deaths.

Slide7

Notes: The maternal mortality ratio is defined by the World Health Organization as the death of a woman while pregnant or within 42 days of termination of pregnancy, irrespective of the duration and site of the pregnancy, from any cause related to or aggravated by the pregnancy or its management but not from accidental or incidental causes. 2015 data for FRA; 2017 data for NZ and UK; 2018 data for SWIZ; 2019 data for AUS, CAN, GER, NETH, NOR, and SWE; 2020 data for US.

Data: Data for all countries except US come from OECD Health Data 2021. Data for US come from Donna L. Hoyert,

Maternal Mortality Rates in the United States, 2020 (National Center for Health Statistics, Feb. 2022).

Deaths per 100,000 live births

EXHIBIT 7

The maternal mortality rate is highest in the U.S.

Slide8

Percentage of women ages 18–49 who have had two or more chronic conditions

Note: Having a chronic condition is defined as ever having been diagnosed by a doctor as having two or more of the following: asthma or chronic lung disease; cancer; depression, anxiety, or other mental health condition; diabetes; heart disease, including heart attack; or hypertension or high blood pressure.

* Statistically significant difference compared to US at p<.05 level.Data: Commonwealth Fund 2020 International Health Policy Survey.

EXHIBIT 8

The U.S. and Canada are the two high-income countries where women of reproductive age are the most likely to have multiple chronic conditions.

Slide9

Percentage of women ages 18–49 who had a mental health need

Note: Having a mental health need is defined as responding yes to the any of the following: “Have you ever been told by a doctor that you have depression, anxiety, or other mental health condition?”, “Since the coronavirus outbreak started, have you experienced stress, anxiety, or great sadness that you found difficult to cope with by yourself?”, “In the past 12 months, was there ever a time when you wanted to talk to a doctor or other health professional about your mental health?”.* Statistically significant difference compared to US at p<.05 level.

Data: Commonwealth Fund 2020 International Health Policy Survey.

EXHIBIT 9

Mental health care needs were highest among women of reproductive age in the U.S., Australia, and Canada.