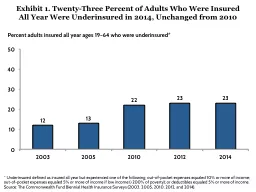
All Year Were Underinsured in 2014 Unchanged from 2010 Underinsured defined as insured all year but experienced one of the following outofpocket expenses equaled 10 or more of income outofpocket expenses equaled 5 or more of income if low income lt200 of poverty or deductibles ID: 640820
Download Presentation The PPT/PDF document "Exhibit 1 . Twenty-Three Percent of Ad..." is the property of its rightful owner. Permission is granted to download and print the materials on this web site for personal, non-commercial use only, and to display it on your personal computer provided you do not modify the materials and that you retain all copyright notices contained in the materials. By downloading content from our website, you accept the terms of this agreement.
Slide1
Exhibit 1. Twenty-Three Percent of Adults Who Were Insured All Year Were Underinsured in 2014, Unchanged from 2010
* Underinsured defined as insured all year but experienced one of the following: out-of-pocket expenses equaled 10% or more of income; out-of-pocket expenses equaled 5% or more of income if low income (<200% of poverty); or deductibles equaled 5% or more of income. Source: The Commonwealth Fund Biennial Health Insurance Surveys (2003, 2005, 2010, 2012, and 2014).
Percent adults insured all year ages 19–64 who were underinsured*Slide2
Exhibit 2. Underinsured Rates Among Adults Who Were Insured All Year by Source of Coverage at the Time of the Survey Percent adults insured all year ages 19–64 who were underinsured*
2003
2005
2010
2012
2014Total12%13%22%23%23%Insurance source at time of survey**Employer-provided coverage10%12%17%20%20%Individual coverage^17%19%37%45%37%Medicaid22%16%32%31%22%Medicare (under age 65, disabled)39%24%45%32%42%Firm size (Base: Full- or part-time workers with coverage through their own employer)<100 employees12%14%17%25%27%100 employees or more8%11%16%16%14%
* Underinsured
defined as insured all year but experienced one of the following: out-of-pocket expenses equaled 10% or more of income; out-of-pocket expenses equaled 5% or more of income if low income (<200% of poverty); or deductibles equaled 5% or more of income
. ** Adults with coverage through another source are not shown here. Respondents may have had another type of coverage at some point during the year, but had coverage for the entire previous 12 months. ^ For 2014, includes those who get their individual coverage through the marketplace and outside of the marketplace.
Source
: The Commonwealth Fund
Biennial Health Insurance Surveys (2003, 2005,2010, 2012, and 2014). Slide3
Exhibit 3. About Three of 10 Adults Who Were Insured All Year in Florida and Texas Were Underinsured in 2014
* Underinsured defined as insured all year but experienced one of the following: out-of-pocket expenses equaled 10% or more of income; out-of-pocket expenses equaled 5% or more of income if low income (<200% of poverty); or deductibles equaled 5% or more of income
. Source: The Commonwealth Fund Biennial Health Insurance
Survey (2014).
Percent adults insured all year ages 19–64 who were underinsured*Slide4
Exhibit 4. More Privately Insured Adults Have Deductibles and They Have Grown in Size
Percent privately insured adults ages 19–64^
^ Base: Those who
specified deductible.
Source: The Commonwealth Fund Biennial Health Insurance Surveys
(2003, 2005, 2010, 2012, and 2014).Slide5
Exhibit 5. Deductibles Have Become a Growing Factor in Underinsurance RatesIndicators of underinsurance among adults ages 19–64 who were insured all year
2003
2005
2010
2012
2014Out-of-pocket costs were 10% or more of income or 5% of more of income if low-income^14 million14 million 25 million23 million24 millionDeductible equals 5% or more of income4 million4 million8 million11 million14 millionNet increase in millions underinsured because of high deductible2 million2 million5 million6 million7 millionUnderinsured*16 million16 million29 million30 million31 million^ Low income refers to those with incomes below 200 percent of the federal poverty level.* Underinsured defined as insured all year but experienced one of the following: out-of-pocket expenses equaled 10% or more of income; out-of-pocket expenses equaled 5% or more of income if low income (<200% of poverty); or deductibles equaled 5% or more of income. Source: The Commonwealth Fund Biennial Health Insurance Surveys (2003, 2005,2010, 2012, and 2014). Slide6
Exhibit 6. High Deductibles Relative to Income by Coverage Source at the Time of the Survey Percent with deductibles that are 5% or more of income, adults ages 19–64 who were insured all year
2003
2005
2010
2012
2014Total3%3%6%8%11%Insurance source at time of survey^Employer-provided coverage2%2%6%8%11%Individual coverage†7%12%17%30%24%Firm size (Base: Full- or part-time workers with coverage through their own employer)<100 employees5%4%7%14%20%100 employees or more1%1%5%6%8%^ Respondents may have had another type of coverage at some point during the year, but had coverage for the entire previous 12 months. † For 2014, includes those who get their individual coverage through the marketplace and outside of the marketplace. Source: The Commonwealth Fund Biennial Health Insurance Surveys (2003, 2005,2010, 2012, and 2014). Slide7
Exhibit 7. The Share of Adults
with Lower Incomes Who Are Underinsured Has Declined Slightly Since 2010
Notes: FPL refers to federal poverty level.
Income
levels are for a family of four in
2013. * Underinsured defined as insured all year but experienced one of the following: out-of-pocket expenses equaled 10% or more of income; out-of-pocket expenses equaled 5% or more of income if low income (<200% of poverty); or deductibles equaled 5% or more of income. ^ Respondent has at least one of the following health conditions: hypertension or high blood pressure; heart disease; diabetes; asthma, emphysema, or lung disease; or high cholesterol.Source: The Commonwealth Fund Biennial Health Insurance Surveys (2003, 2005, 2010, 2012, and 2014).Percent adults insured all year ages 19–64 who were underinsured*(<$47,100)($47,100+)Slide8
Exhibit 8. Underinsured Adults Report Medical Bill Problems at Twice the Rate as Insured Adults Who Are Not Underinsured
* Underinsured defined as insured all year but experienced one of the following: out-of-pocket expenses equaled 10% or more of income; out-of-pocket expenses equaled 5% or more of income if low income (<200% of poverty); or deductibles equaled 5% or more of income.Source: The Commonwealth Fund Biennial Health Insurance Survey (2014).
Percent adults ages 19–64Slide9
Exhibit 9. Adults with Medical Bill Problems Had Lingering Financial Problems Because of Their Medical Bills^ Base: Had problems paying medical bills, contacted by a collection agency for unpaid bills, had to change way of life in order
to pay medical bills, or has outstanding medical debt. * Underinsured defined as insured all year but experienced one of the following: out-of-pocket expenses equaled 10% or more of income; out-of-pocket expenses equaled 5% or more of income if low income (<200% of poverty); or deductibles equaled 5% or more of income.
Source: The Commonwealth Fund Biennial Health Insurance Survey (2014).
Percent
adults
ages 19–64 with medical bill problems or accrued medical debt^Slide10
Exhibit 10. More Than Two of Five Adults Who Are Underinsured Reported Problems Getting Needed Care Because of Cost
* Underinsured defined as insured all year but experienced one of the following: out-of-pocket expenses equaled 10% or more of income; out-of-pocket expenses equaled 5% or more of income if low income (<200% of poverty); or deductibles equaled 5% or more of income.Source: The Commonwealth Fund Biennial Health Insurance Survey (2014).
Percent adults ages 19–64Slide11
Exhibit 11. Underinsured Adults with Health Problems Struggled to Care for T
heir ConditionsPercent adults ages 19–64 with a health problem or condition^
^ Respondent has at least one of the following health conditions: hypertension or high blood pressure; heart disease; diabetes; asthma, emphysema, or lung disease; or high cholesterol.
*
Underinsured defined as insured all year but experienced one of the following: out-of-pocket expenses equaled 10% or more of income; out-of-pocket expenses equaled 5% or more of income if low income (<200% of poverty); or deductibles equaled 5% or more of income.Source: The Commonwealth Fund Biennial Health Insurance Survey (2014).