/
The Changing Landscape of Acquiring Local Food—and What It Means for You The Changing Landscape of Acquiring Local Food—and What It Means for You

The Changing Landscape of Acquiring Local Food—and What It Means for You - PowerPoint Presentation

aaron
aaron . @aaron
Follow
343 views
Uploaded On 2019-06-21

The Changing Landscape of Acquiring Local Food—and What It Means for You - PPT Presentation

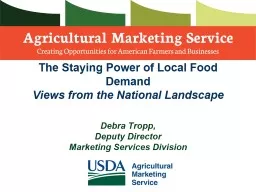
Carlos Coleman and Debra Tropp Local Food Research and Development Marketing Services Division March 14 2018 Contents of presentation How do we USDA AMS MSD support local food work ID: 759624

Share:

Link:

Embed:

Download Presentation from below link

Download Presentation The PPT/PDF document "The Changing Landscape of Acquiring Loca..." is the property of its rightful owner. Permission is granted to download and print the materials on this web site for personal, non-commercial use only, and to display it on your personal computer provided you do not modify the materials and that you retain all copyright notices contained in the materials. By downloading content from our website, you accept the terms of this agreement.


Presentation Transcript

Slide1

The Changing Landscape of Acquiring Local Food—and What It Means for You

Carlos Coleman and Debra TroppLocal Food Research and DevelopmentMarketing Services DivisionMarch 14, 2018

Slide2

Contents of presentation:

How do we (USDA AMS

MSD) support

local food work

?

What

do

the FM Directory and Manager Survey Data reveal

?

What can FMs learn from recent CSA experiences

?

Overview of emerging food preferences

Slide3

Legislative Authority Supports USDA/AMS Interest in Local Food Marketing

Ag. Marketing Act of 1946:

USDA/AMS is mandated to:

Support the development and creation of

shorter food supply chains

Work toward ensuring that food producers receive a

greater share of the final retail price

Support profitable marketing of all American farmers at

all scale levels

Direct to Consumer Marketing Act of 1976

Promote direct marketing of farm products where it provides

mutual benefit

to farmers and consumers

Slide4

AMS Marketing Services Division: How Do We Help?

Through

market research, analysis, data products and other tools

, we help stakeholders better understand trends in the rapidly evolving direct to consumer marketplace.

Three areas of concentration:

Local Food Directories and Surveys

Local Food Systems Research and Technical Assistance

Food Market Facility Design

Slide5

Local Food Directories and Surveys

Administers voluntary Farmers Market Manager SurveyNearly 1,400 farmers market managers participated in the 2014 surveyMaintains four national directories on local food at www.usdalocalfooddirectories.comFarmers Markets (8,716)CSAs (799)Food Hubs (215)On-Farm Markets (1,463)

Slide6

Moving

Food Along the Value Chain: Innovations in Regional Food Distribution (March 2012)Regional Food Hub Resource Guide Food hub impacts on regional food systems, and the resources available to support their growth and development (April 2012)

MSD Reports on Local Food Systems

Slide7

Food Value Chains

:Creating Shared Value to Enhance Marketing Success (May 2014)Building a Food Hub from the Ground Up:A Facility Design Case Study of Tuscarora Organic Growers(February 2015)

MSD Reports on Local Food Systems

Slide8

MSD Reports on Local Food Systems

Evaluating the Economic Impacts of Local & Regional Food Systems: A Toolkit to Guide Community Discussions, Assessments and Choices (February 2016)Community Supported Agriculture: New Models for Changing Markets Results of national survey and focus group interviews in six states(April 2017)

Slide9

MSD Reports on Local Food SystemsHarvesting Opportunity: The Power of Regional Food System Investments to Transform Communities (August 2017)Federal Reserve, USDA/AMS and USDA/RDhttps://www.stlouisfed.org/community-development/publications/harvesting-opportunity Highlights successful models of collaboration in regional food systems between policymakers, practitioners and the financial community, and discusses potential ways to address existing gaps in research, policy and resources

Slide10

What is Local Food Anyway?

A food product that is

raised, produced, aggregated, stored, processed, and distributed

in the locality or region in which the final product is marketed.

No official national designation

, though some individual USDA programs use a broad (maximum) definition:

Less than 400 miles

from the origin of the product, or

Within the State

in which the product is produced.

Slide11

What is Local Food Anyway?

USDA statistical tabulations on local food include both

direct-to-consumer sales AND intermediated sales

by distributors/food hubs that

preserve local product identity

To restaurants, grocery stores, schools/universities, hospitals, et.

al.

Slide12

What’s Happening at Markets Across the Country?

Slide13

National Farmers Market Directory and Manager Survey

Directory:

Voluntary Listing of Market Products, Location, Time and Contact Information

Excel Export and API Functionality

Continuously Updated (Posts within 2 business days)

Manager Survey:

Voluntary Questionnaire about farmers market trends and activities

Automated and Data-Driven (respondents see only what is relevant to them)

Reflects the Directory Population at the Regional and Divisional Level

Slide14

Source: USDA-AMS-Marketing Services Division

2.3%

Increase

Farmers Market information is voluntary and self-reported to USDA-AMS-Marketing Services Division

Slide15

Competition?

Market managers should complement market-sponsored events/programming with vendor and customer education that take advantage of increased attendance and community support from event hosting – greater attendance does not equate to greater sales. The lack of association between event sponsorship and sales performance means that a more festive market place that attracts more foot traffic may not necessarily result in increased sales for market vendors. Just as health programming aims to educate customers on how to prepare and consume farmers market produce, vendor trainings on merchandizing and customer service could help vendors take advantage of greater customer traffic.

Slide16

Public Investment (e.g., Farmers Market Promotion Program (FMPP))


Non FMPP Recipients

FMPP Recipients

Sales***

2.50

2.72

Customers**

2.53

2.66

Repeat Customers***

2.58

2.75

Producers/Vendors

2.41

2.48

Vendor Retention

2.21

2.28

Vendor Recruitment***

2.43

2.61

Diversity of Products

2.53

2.58

Community / Civic Contributions / Outreach

2.39

2.30

Community Support

2.55

2.52

Financial Health

2.34

2.42

Responses

1,217

104

*** -- Statistically significant difference at 1% level.

** -- Statistically significant difference at 5% level.

Slide17

Slide18

Slide19

Attract Customers and Train Vendors

Market managers should complement market-sponsored

events and programming

with vendor and customer education that

takes

advantage of increased attendance and community support from event hosting –

greater attendance does not equate to greater sales.

Slide20

Beware of the Infrastructural Performance Shock

Market planners should exercise caution when using infrastructural improvements to bolster market performance. Study findings show that market infrastructural expansion and improvements are associated with each performance category; however, greater context will show other contributing factors in addition to improvements.

Slide21

Working Relationships with Community Groups

It is also important that market organizers carefully consider how to meaningfully incorporate community groups in market programming and events. Community groups develop trust and connections with community residents who are encouraged to partake in the full market experience

Slide22

Provide Opportunity to Ag. Businesses

Market planners and managers should continue to look for ways to offer business incubator services/facilities and additional marketing outlets as a way to retain vendors.

Slide23

Hosting Additional Marketing Channels

Slide24

Slide25

What Can Farmers Markets Learn From The CSA Experience?

Slide26

Background on CSA Study:New Models for Changing Markets

USDA/AMS cooperative research agreement with Dr. Tim Woods at the University of Kentucky (published 2017). Examined:Recent changes in CSA business practicesMotivation behind shift in business scopePerceived impact of changing practices on business performance and competiveness

Slide27

Emerging trends shaping the CSA industry

Focus on risk management

shifts attention to consumer preference, convenience and affordability

Highlights:

Multi-season operations

Emphasis beyond fresh produce

Multi-channel collaboration

Exploration of incentives

tied to health insurance

More affordable pricing

structures (including partial share, sliding scale and SNAP redemption options)

Possible plateauing of organic interest

in some regions (as range of local food customers expands beyond traditional core customers)

Slide28

Regional Breakdown of Key CSA Characteristics

Notable observationsMixed views of future sales prospects, more negative in NEPossible relationship to high shareholder size, older CSAs?High degree of urbanicityTepid interest in USDA certified organic productionDeparture from early 2000s data: 46% certified organic (Lass, et. al.)

Region*

Northeast North CentralSoutheastWestOverallAverage CSA Size (shareholder # estimated for 2014)203.8154.5105.9125.7144.8Age of CSA (years)7.86.56.06.86.8Certified Organic (%)28.0%22.7%19.5%32.8%27.2%Share in Urban Locations54.7%54.7%67.1%56.5%57.4%Expect Increasing CSA Sales Next 2 Years39.0%59.7%52.9%51.3%51.1%N10011987189495

* Regional designations of various states in this study follow those made by USDA – Northeast, North Central, Southeast, and West.

Slide29

Moving from Producer-Centric to Consumer-Centric

Overarching challenge for CSA industry:

how to compete successfully in an increasingly crowded local food marketplace while maintaining a distinct identity

Neil Stauffer, former General Manager for Penn’s Corner Farm Alliance in Pittsburgh, PA:

When CSAs were first around, it seems like it was more like customers saying, ‘We really believe in you, the farmer, and how can we make this work for you?”

“Now, it seems like it has shifted and the farmers are saying, ‘

How can we make the CSA work better for you, the customer

?’” -

Slide30

CSAs responding to changing customer preferencesNew income opportunities:Expanded product mix – meat, dairy, eggs, as well as value-added and processed products coming from the farm – extend marketing season Season-specific, partial and optional add-on shares (e.g., eggs, meat, flowers) contribute to income and cash flow stabilityAided by widespread adoption of season extension technologiesMay have driven move toward multi-farm cooperation

It’s not just about seasonal produce anymore

Slide31

Case study example: Penn’s Corner Farm Alliance

Key

season-extension initiatives

have included:

New bi-monthly winter CSA

, with 237 shares sold during the winter of 2012-13.

Sales of #2 tomatoes for processing

. The co-op recently started outsourcing processing of its #2 tomatoes to

Stello

Foods, a specialty food manufacturer founded in 1990 in Punxsutawney, PA. Prior to this, many growers had no market for #2 tomatoes, and simply composted them.

Slide32

Case study example: Penn’s Corner Farm Alliance

PCFA’s *profit* from selling processed products from mostly #2 tomatoes exceeded $10,000 in 2012.

PCFA’s product line during the first year of production included:

3,650 pounds of chopped tomatoes in quart jars

3,076 pounds of tomato juice in 10-pound cans for restaurants

2,508 pounds of tomatillo salsa in small jars for CSA shares

Slide33

Case study example: Penn’s Corner Farm Alliance

Inclusion of processed products to their CSA product line

has been a convenient way for PCFA to

boost grower income

,

provide less perishable product

to shareholders,

complement their existing product mix

, and

enable small producers to offer new items to the Pittsburgh market at relatively low additional cost.

Expanding product scope AND marketing windows

PCFA recently added on an

egg share option and a flower share

In 2013, they introduced an

every-other-week

share during the regular season.

Slide34

Most CSAs farmers are active participants in other local food marketing channels

Traditional channel boundaries starting to blur

Current use of marketing channel

Number

yes

Share

yes

Near

large city

Near small city

Small

town

Countryside

Farmers

markets

304

65

%

60%

69%

69%

68%

Wholesale

to

Restaurants

258

55

%

58%

61%

54%

47%

On

-farm retail

194

41

%

47%

37%

35%

56%

Wholesale to Grocery

180

38

%

32%

38%

44%

43%

Wholesale

to

Schools/

Institutions

92

20

%

19%

17%

26%

19%

Contracts with processors

17

4

%

3%

5%

4%

3%

Auction

markets

12

3

%

4%

2%

4%

3%

Slide35

Market diversification expected to ramp up

Current use of marketing channel

Decrease

About the same

Increasing

N

Farmers

markets

33

123

175

331

Wholesale

to

Restaurants

31

92

182

305

On

-farm retail

8

78

158

244

Wholesale to Grocery

24

72

132

228

Wholesale

to

Schools/

Institutions

6

33

98

137

Contracts with processors

4

16

23

43

Auction

markets

5

8

5

23

Slide36

Finding New CSA Customers Beyond the Traditional Shareholder Base

Ginger Turner

CSA Manager for Farmer

Daves

(Dave

Demaresq

), Dracut, MA

Slide37

Farmer Dave’s/Many Hands Organic Farm

Partnering with urban community development agencies and others to reach lower income, inner-city shareholders

Collaborators include:

Harvard Medical School

Boston Housing Authority

Madison Park Development Corporation

East Boston Neighborhood Health Center

Northeast Organic Farming Association

Incorporates seafood CSA

, “Community Supported Fishery,” extending the distribution model to a greater range of products

Slide38

Partners share responsibility for coordinating:Shareholder recruitmentSNAP and other subsidy facilitationPeer shareholder leadershipCooking classesCommunity health programsFood consumption behavioral studies

How Do They Do It?

Elizabeth Gonzalez Suarez

Trinity Property Management

Slide39

Madison Area Community Supported Agriculture Coalition (MACSAC), now called FairShare CSA Coalition, and Physicians Plus, one of Madison’s three Health Maintenance Organizations (HMOs) developed the Eat Healthy Rebate programCoordinated between HMO and employer wellness programsEmployers offer rebate voucher based on household sizeVoucher covers portion of CSA share cost on reimburseable basis. Area’s healthcare system had low penetration of national providers – agility enabled launch of community-based program

Tapping Into the Workplace CSA Market

2005

2006

2007

2008

2009

2010

2011

2012

Estimated total rebates issued

96

972

1,282

3,550

6,100

6,800

7,300

7,200

Approximate # of total shares

available via FS farms

2,000

2,800

3,500

4,500

6,950

8,650

8,733

9,700

Slide40

What Do We Know About U.S. Consumer Demand for

Local Food?

Slide41

News Headlines Are Changing Public Perception

International Food Information Council Foundation, 2016 Food and Health Survey:

Nearly a third of Americans

have changed their mind about nutrition issues in the past year.

News articles are a top driver of this change.

Nearly half of Americans

have read an article or book, or watched a documentary about the food system in the past year...and

about half of them

have changed their food purchases as a result.

Slide42

Connection between consumer food preferences and rise in local food demand

Phil Lambert, “Supermarket Guru”, 2013:

People are choosing their foods more holistically based on

multiple “food factors”:

Taste

Ingredients

Source

Nutritional composition

Asking who is making their foods

Understanding impact on environment & animal welfare

All of the above factors –

quality, promotion of personal health

,

transparency, trust, and social/environmental values

– contribute to steady growth in local food demand

Slide43

Food and Health Survey 2016, International Food Information Council Foundation

Slide44

Opinions about modern agriculture & sustainability

Slide45

Shoppers intentionally seek out local foods…even at higher price points

One-third of consumers

claim they consciously purchase locally grown or locally produced foods

at least once a week.

Nearly half of the respondents

agreed they were willing to pay up to 10 percent more for locally grown or produced foods

Almost one in three

said they would pay up to 25 percent more

.

Packaged Facts national survey, Shopping for Local Foods in the U.S., November 2014:

Slide46

Willingness to Pay More Spans Income Spectrum

Slide47

Local Foods Still Dominate Chefs’ Preferences

2016 “What’s Hot” Locally sourced meats and seafoodChef-driven fast casual conceptsLocally grown produceHyper-local sourcingNatural ingredients/minimally processed foodEnvironmental sustainabilityHeathful kids’ mealsNew cuts of meatSustainable seafoodHouse-made/artisanal ice cream

2017 “What’s Hot”Hyper-local sourcingChef-driven fast casual conceptsNatural ingredients/”clean” menusEnvironmental sustainabilityLocally grown produceLocally grown meats and seafoodFood waste reductionMeal kitsSimplicity/back to basicsNutrition

Source

: National Restaurant Association

Slide48

2015 Supermarket Guru/NGA Consumer Survey:

28 percent want minimal processing25 percent want a shorter list of ingredients. Int’l Food Information Council 2016 Food & Health Survey:36 percent worry about chemicals in their foodsFoods labeled with a health attribute experienced a sales increase of 13 percent in the past year vs. flat sales FMI U.S. Grocery Shopper Trends 2016:22 percent worry the food they eat isn’t nutritious enough26 percent seek products ENHANCED for nutritional reasons (e.g., vitamins, antioxidants, calcium)

Shoppers Are Looking for More Natural, Nutritionally-Rich Foods

Slide49

Why Are Shoppers Demanding Local Food?

They

perceive

local food as possessing superior quality or nutritional attributes, and they want to improve the quality of their diets

60 percent of consumers

say they purchase local food because the products are fresher

44 percent

say they taste better

Roughly one-third

believe that local products are healthier

Slide50

Shopper Concerns About Food Nutritional Content

FMI U.S. Grocery Shopper Trends, 2016

Slide51

Self-Assessment of Food Purchases for At-Home Eating: Room for Growth?

FMI U.S. Grocery Shopper Trends, 2016

Slide52

Fruit and Vegetables Take Center Stage

Between 2010-2014:

U.S. supermarket produce sales

rose 21.7 percent

Supermarket sales overall

rose only 9.3 percent

Produce share of supermarket sales

rose from 10.4% to 11.6%

Baby Boomers eat an average of

4.43 servings

of fruits and vegetables a day.

Generation X members eat an average of

4.71 servings

of fruits & vegetables a day

Millennials eat an average of

5.12 servings

of fruits & vegetables per day

Slide53

Why Are Shoppers Demanding Local Food?

They want to have

trust in the source and integrity

of the food they purchase

They seek

authentic

food products

They seek

clarity and transparency

in food labeling

(Phenomenon is strongest among younger consumers)

Watershed Communications,

2016 food &

beverage survey

Interviewed ~400 Millennials about food and beverage preferences

Every

single respondent

indicated that he or she

frequently

purchased foods and beverages

based on the brand’s reputation for authenticity.

Slide54

Why Are Shoppers Demanding Local Food?

Factors that were most frequently attributed to creating an authentic brand included:

1.

CLEAN INGREDIENTS

Real. All Natural. Fresh. Organic.

What was once niche is the new normal. It's expected and demanded

.

2.

QUALITY PRODUCT/ GREAT TASTING

Authentic food and beverages must still be quality products.

Top-shelf ingredient and great flavor are non-negotiable!

3.

TRUE TO MISSION

Know your brand's true north and stick to it. Having a mission is half the battle.

Brands must stay true to their claims and their own slogans

.

Slide55

Why Are Shoppers Demanding Local Food?

Factors that were most frequently attributed to creating an authentic brand included:

4.

CULTURALLY ACCURATE

Millennials have been exposed to global flavors since birth. They

appreciate brands that genuinely honor cultural heritage

5.

TRANSPARENCY

No fine print, please.

Be upfront in BIG bold letters. Food and beverage packaging should expressly state what is in the product and why

Generation Z consumers – under 18 – are also said to place a high value on authenticity and transparency when purchasing food products and developing brand loyalty

Slide56

Trust in Food Stores’ Ability to Deliver Local Food

Slide57

Why Are Shoppers Demanding Local Food?

They seek to direct their food expenditures in a way that advances social and environmental goals

Dr. Ion

Vasi

, Department of Sociology and

Tippie

College of Business at the University of Iowa:

The local food market is a

moralized market

where

people

combine economic activities with their social value

It’s a relational and ideological exchange

in addition to an economic one

Vasi

discovered that local food markets were more likely to develop in areas

where residents had a strong commitment to civic participation, health, and the environment

Slide58

Food purchases motivated by social/environmental mission

FMI U.S. Grocery Shopper Trends, 2016

29 percent

of all surveyed shoppers prefer shopping in food stores that they believe

support the local economy

21 percent

prefer shopping in grocery stores that

procure meat from sources that treat animals humanely

14 percent

look for organic certification

Slide59

February 2017: Acosta “Back to Our Roots” report on natural /organic food shoppers

Slide60

Retail preferences for natural/organic foods,

by age cohort

Slide61

Store Loyalty Has Become More Fickle; Supermarkets No Longer Dominant

Slide62

Everything Old…Is New Again?

Food shoppers aspire to a more natural [and sometimes romanticized] past--

“My husband comes from an Italian family who cooked and ate together. My mom was young with lots of kids.

She did what was easy and cheap. We ate out of boxes and cans. Food was not good growing up.

I don’t want that for my kids”

FMI: 2016, US Grocery Shopper Trends

Slide63

Debra Tropp, Deputy DirectorCarlos Coleman, Agricultural Marketing Specialist Marketing Services DivisionMain Phone: (202) 720-8317Email addresses: Debra.Tropp@ams.usda.gov and CarlosP.Coleman@ams.usda.govWebsite: www.ams.usda.gov/services/local-regional

Contacts for AMS Market Research and TA