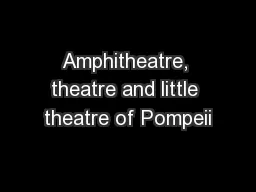
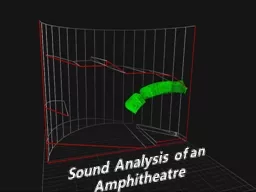
/
Sound Analysis  of an  Amphitheatre Sound Analysis  of an  Amphitheatre

Sound Analysis of an Amphitheatre - PowerPoint Presentation

agentfor
agentfor . @agentfor
Follow
352 views
Uploaded On 2020-06-15

Sound Analysis of an Amphitheatre - PPT Presentation

Importing Model to Ecotect Anaysis 3ds geometry Ecotect 3ds geometry Ecotect Conclusion Analysis will retard or take long time Revit and Ecotect Tag the object carefully in ID: 777746

30m dia analysis 12m dia 30m 12m analysis nrc trial material ecotect geometry sound acoustical adding default ceiling conclusion

Share:

Link:

Embed:

Download Presentation from below link

Download The PPT/PDF document "Sound Analysis of an Amphitheatre" is the property of its rightful owner. Permission is granted to download and print the materials on this web site for personal, non-commercial use only, and to display it on your personal computer provided you do not modify the materials and that you retain all copyright notices contained in the materials. By downloading content from our website, you accept the terms of this agreement.


Presentation Transcript

Slide1

Sound Analysis

of an

Amphitheatre

Slide2

Importing Model to Ecotect

Anaysis.

Slide3

.3ds geometry--

Ecotect

Slide4

.3ds geometry--

Ecotect

Slide5

Conclusion: Analysis will retard or take long time.

Slide6

Revit and Ecotect

Tag the object carefully in

Revit

for

gbxml

filetype

!

Slide7

Revit

model tagged as shaded part and untagged as un-shaded part.

To import

gbxml

format from

revit

for analysis, whole part should be completely tagged

Slide8

Conclusion: Analysis will work but cylindrical geometry will be a mess as

ecotect

converts it into triangular components.

Slide9

Cylinder computed by

Ecotect

becomes more complex triangular geometry

Avoid Complex Geometry as far as possible.

Slide10

Carefully deleted the outer cylindrical from imported xml file and created cylinder surface on

ecotect

so that analysis is done smoothly.

More Simplified geometry for

Ecotect

Model

Slide11

Acoustical Analysis

Slide12

Set Sound Source and Reflectors (ceilings)

Slide13

Generate Rays

Slide14

Reflector position and orientation calculation

Acoustical Analysis

Slide15

Trial 1

Default

Slide16

Trial 1

12m

dia

=30m

Slide17

Trial 1

Default

12m

dia

=30m

Slide18

Trial 1

Default

12m

dia

=30m

Slide19

Trial 1

Default

dia

=30m

12m

Slide20

Conclusion of Trial 1

More REVEB sound was detected.

Hence need to modify

-Geometry

-Orientation (incident angle etc.)

Material quality is kept as default.

Hence parameters to control in the analysis are Reflectors (ceilings) property.

Slide21

Trial 2

Lowering ceiling

Decreased by 3m

9m

dia

=30m

Slide22

Trial 2

Lowering ceiling

Decreased by 3m

9m

dia

=30m

Slide23

Decreased by 3m

Trial 2

Lowering ceiling

9m

dia

=30m

Slide24

Trial 3

Increased by 3m

15m

dia

=30m

Slide25

Trial 3

15m

dia

=30m

Slide26

Conclusion of Trials 2 and 3

As we change the heights of the ceiling, just above the stage, quality changes drastically

As we lower more noise is observedAs we higher the ceiling good quality is observed for same directed ray generated.

Slide27

Material

assignment to the Reflectors

at height of 12m

Acoustical Analysis

Slide28

Assigning all reflectors as

Acoustical Tile.

Slide29

Table to feed different NRC Values

Slide30

Feeding different Absorptive value for different frequency

.

Slide31

Adding Material-NRC.03

dia

=30m

12m

Slide32

Adding Material-NRC.03

12m

dia

=30m

Slide33

Adding Material-NRC.61

dia

=30m

12m

Slide34

Adding Material-NRC.85

dia

=30m

12m

Slide35

Conclusion of different NRC Values

For Higher Noise Reduction Coefficients (NRC 0.6 and above) most of the sound waves are observed that leads to Dryness of Sound which seems to be bad of an amphitheatre.

For lower NRC(0.3) we have variety of sound variation which is not desired

Hence selected NRC 0.56 which is 12 mm Mineral Fiber Material which is also fire resistant.

Slide36

Adding Material-NRC.56

12m

dia

=30m

Slide37

Adding Material-NRC.56

12m

dia

=30m

Slide38

Results or Output from

Ecotect

Analysis.

Acoustical Analysis

Slide39

Acoustical Response

Slide40

Sound Decay for different frequency

Slide41

Reverberation Graph

TOTAL SABINE NOR-ER MIL-SE

FREQ. ABSPT. RT(60) RT(60) RT(60)

------- -------- ------- ------- -------

63Hz: 104.349 3.35 2.80 4.87

125Hz: 110.039 3.21 2.70 1.70

250Hz: 206.346 1.53 1.39 1.13

500Hz: 519.030 0.86 0.68 0.57

1kHz: 579.543 0.80 0.60 0.49

2kHz: 485.506 0.86 0.71 0.62

4kHz: 390.240 1.04 0.90 0.82

8kHz: 390.551 1.02 0.90 0.82

16kHz: 308.554 1.14 1.07 0.99

Slide42

STATISTICAL ACOUSTICS - 18 Room

Volume: 4070.390 m3

Surface Area: 761.794 m2Occupancy: 680 (850 x 80%)Optimum RT (500Hz - Speech): 0.99 s

Optimum RT (500Hz - Music): 1.65 s

Volume per Seat: 4.789 m3

Minimum (Speech): 5.329 m3

Minimum (Music): 9.129 m3

Most Suitable: Norris-

Eyring

(Highly

absorbant

)

Selected: Sabine (Uniformly distributed)