/
Barry Tolchard Addiction Therapy-2014 Barry Tolchard Addiction Therapy-2014

Barry Tolchard Addiction Therapy-2014 - PowerPoint Presentation

alexa-scheidler
alexa-scheidler . @alexa-scheidler
Follow
359 views
Uploaded On 2018-11-08

Barry Tolchard Addiction Therapy-2014 - PPT Presentation

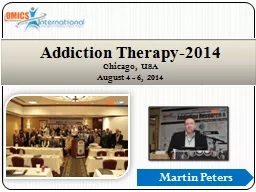
Chicago USA August 4 6 2014 Attitudes towards Gambling in Ghanaian Adolescents Dr Barry Tolchard University of New England amp University of Essex Franklin Glozah amp David Pevalin ID: 722537

higher gambling correction adolescent gambling higher adolescent correction teachers atg positive perceived frequency participation relationship sports family social adolescents significantly boneferroni disturbing

Share:

Link:

Embed:

Download Presentation from below link

Download Presentation The PPT/PDF document "Barry Tolchard Addiction Therapy-2014" is the property of its rightful owner. Permission is granted to download and print the materials on this web site for personal, non-commercial use only, and to display it on your personal computer provided you do not modify the materials and that you retain all copyright notices contained in the materials. By downloading content from our website, you accept the terms of this agreement.


Presentation Transcript

Slide1

Barry Tolchard

Addiction Therapy-2014Chicago, USAAugust 4 - 6, 2014Slide2

Attitudes towards Gambling in Ghanaian AdolescentsDr Barry TolchardUniversity of New England & University of EssexFranklin Glozah & David PevalinUniversity of EssexSlide3

Gambling in AfricaGambling varies across the continentSouth Africa, Nigeria and Kenya biggest marketsGhana3 land based Casinos, 2 in Accra (La Palm Casino & The Millionaires Casino), 1 in Kumasi (Golden Tulip Kumasi City, Hotel & Casino); lotteries and horse racing; sports bettingOnline gambling is legalSlide4

The Gaming Commission of Ghana (GCG)Responsible: regulation, controlling, monitoring and supervision of games of chance; licencing; promotionsGaming Act 721 (2006)Slide5

Behav Brain Sci. 2010 Jun;33(2-3):61-83; discussion 83-135. doi: 10.1017/S0140525X0999152X. Epub 2010 Jun 15.The weirdest people in the world? Henrich J, Heine SJ, Norenzayan A.Behavioral scientists routinely publish broad claims about human psychology and behavior in the world's top journals based on samples drawn entirely from

Western, Educated, Industrialized, Rich, and Democratic (WEIRD) societies. Researchers - often implicitly - assume that either there is little variation across human populations, or that these "standard subjects" are as representative of the species as any other population. Are these assumptions justified? Here, our review of the comparative database from across the behavioral sciences suggests both that there is substantial variability in experimental results across populations and that WEIRD subjects are particularly unusual compared with the rest of the species - frequent outliers. The domains reviewed include visual perception, fairness, cooperation, spatial reasoning, categorization and inferential induction, moral reasoning, reasoning styles, self-concepts and related motivations, and the heritability of IQ. The findings suggest that members of WEIRD societies, including young children, are among the least representative populations one could find for generalizing about humans. Many of these findings involve domains that are associated with fundamental aspects of psychology, motivation, and behavior

- hence, there are no obvious a priori grounds for claiming that a particular behavioral phenomenon is universal based on sampling from a single subpopulation. Overall, these empirical patterns suggests that we need to be less cavalier in addressing questions of human nature on the basis of data drawn from this particularly thin, and rather unusual, slice of humanitySlide6

The studyA cross-sectional survey design of 770 second-year and third-year Senior High School (SHS) students between 14 and 21 years (504 boys, 266 girls) in AccraRepresentative sampleSchools recruited via the permission of the head teacher and classes were randomly selected within each schoolA study description and consent form was provided to individual students within the schools that agreed to participate and the classes randomly selectedParents/guardians of students below 18 years of age were also required to provide consent before questionnaire completion which took place in the respective classrooms of the participants.

Research ethics approval was obtained from the University of Essex, UKSlide7

MeasuresThe Attitudes towards Gambling (Delfabbro & Thrupp, 2003)Nine item measure of an adolescent’s economic perception of gambling ‘Gambling is a risky activity’, ‘You can lose all your money gambling’, ‘Gambling is a waste of money’, ‘Gamblers usually lose in the long-run’, ‘To gamble is to throw away money’, ‘You can make a living from gambling’, ‘Gambling is a good way to get rich quickly’, ‘Gambling is a better way to make money than working’, and ‘Gambling can give high returns’Agreement

on a 5-point from ‘strongly agree’ to ‘strongly disagree’. The last four items are reversed so that higher scores represented a less positive attitude towards gamblingAll items are added to give a total scoreA lower score indicates a more positive attitude to gamblingThe scale had good internal reliability, α = .78 with this sampleSlide8

MeasuresGeneral Health Questionnaire - GHQ-12 (Goldberg, 1972)General wellbeingSchool Success Profile - SSP (Bowen and Richman, 1995, 2008)Self-report somatic symptomatologyPerceived Social Support from Family (PSS-FA) and Friends (PSS-FR) scales (Procidano and Heller, 1983) and teachers scale - SSP (Bowen and Richman, 1995,

2008)Perceived social supportAdolescent Stress Questionnaire - ASQ (Byrne et al., 1995) Perceived stressPersonal Lifestyle Questionnaire - PLQ (Muhlenkamp and Brown, 1983; Mahon et al., 2003)behavioural health or positive health practicesSlide9

Results: Gambling participationMale vs. female adolescent  participation on all forms of gamblingYounger students had  sports betting participationAttending a mixed gender school led to  participation in card games Slide10

Relationship between participation and perceived social difficultieshome (arguments at home, disagreements between your parents, disagreements between you and your mother, disagreements between you and your father, lack of understanding by your parents, abiding by petty rules at home, living at home, not being taken seriously by your parents, little or no control over your life, lack of trust from adults, parents expecting too much from you, parents disturbing you about the way you look), peer (pressure to fit in with peers, being hassled for not fitting in, peers disturbing you about the way you look, being judged by your friends, disagreements between you and your peers), personal

(satisfaction with how you look, changes in your physical appearance with growing up) and, school (lack of respect from teachers, not being listened to by teachers, getting along with your teachers, disagreements between you and your teachers, teachers disturbing you about the way you look, abiding by petty rules at school) factors.Slide11
Slide12

Relationship between participation and perceived social difficultiesCard GamesPositive response*‘disagreements between you and your father’where, there were frequent arguments, more adolescents stated they sometimes gambledNegative response*‘lack of respect from teachers’‘

not being listened to by teachers’,‘disagreements between you and your teachers’ ‘teachers disturbing you about the way you look’ where the adolescent did not believe this statement had significantly higher card playOverall, adolescent card gamblers who were having few problems at home or school were higher frequency playersPost-hoc analysis; Bonferroni

correction p < .05Slide13

Relationship between participation and perceived social difficultiesSports betting‘living at home’adolescent who lived at home only some of the time were significantly more likely to gamble on sports‘lack of trust from adults’where the adolescent sometimes believed this statement they had significantly higher sports

betting‘teachers disturbing you about the way you look’where the adolescent did not believe this statement they had significantly higher sports betting‘abiding by petty rules at school’where the adolescent sometimes believed this statement they had significantly higher sports bettingAdolescent sports bettors experienced higher frequency participation where they had some difficulties at home and school

Post-hoc analysis; Bonferroni correction p < .05Slide14

Relationship between participation and perceived social difficultiesLotteries‘parents disturbing you about the way you look’ where the adolescent often believed this statement they had significantly higher lottery participation‘teachers disturbing you about the way you look’ where the adolescent often believed this statement they had significantly higher lottery play

Adolescents who participated in lotteries had higher frequency play when experiencing difficulties regarding parent/teacher views of their appearance Post-hoc analysis; Bonferroni correction p < .05Slide15

Relationship between participation and perceived social difficultiesSlot machines‘disagreements between you and your peers’where the adolescent often believed this statement they had significantly higher slot machine play ‘teachers disturbing you about the way you look’where the adolescent did not or sometimes believed this statement they had significantly higher

slot machine playAdolescents playing poker machines had higher participation when they experience peer problemsSlide16

Gambling participation and perceived social protective factorsCards & Sports bettingNegative response*‘ teachers give me lots of encouragement’

Adolescent experience higher participation in sports bettingNo differences emerged with card play*All significant at < .05; Bonferroni correction p < .05 Slide17

Gambling participation and perceived social protective factorsLotteriesNegative response to item*‘I’ve recently gotten a good idea about how to do something from a friend’,‘family provide moral support’, ‘families are interested in what they think

’,‘my teachers care about me’These items could be considered as being given positive regard and as such where the adolescent does not receive this, they are more prone to gamble Positive response*‘relying on their family for emotional support’‘there is a member of my family I can go to when I feel down…’ ‘my family is sensitive to my needs’‘a deep sharing relationship with a number of members of my family’‘

relationship between me and my family is better than my friends’ relationship with their family’Having strong family connections and believing their emotional needs are being met would indicate a lower need to participate in the lotteries*All significant at < .05; Bonferroni correction p < .05 Slide18

Gambling participation and perceived social protective factorsSlot machinesPositive response*‘friends enjoy hearing about what I think’Adolescent experience higher participationNegative response*‘friends

are good at helping me solve problems’‘deep sharing relationship with a number of friends’‘Family gives me the moral support I need’‘teachers care about me’‘Teachers listen to what I have to say’‘My teachers show me respect’ Adolescent experience higher participationHaving unsupportive interpersonal relationships appears to be linked to an increase in gambling in

slot machine players*All significant at < .05; Bonferroni correction p < .05 Slide19

Attitudes towards GamblingDemographics

Gambling

typeSignificant differences found between non-gamblers and high frequency gamblers on all gambling types with all high frequency gamblers considering gambling to be a positive activitySlide20

Relationship between ATG scale and perceived social difficulties‘satisfaction with how you [the adolescent] looked’In this case there was significant difference between those very often concerned about the way they looked experienced lower scores on the ATG scale (Bonferroni correction p < .05). Adolescent comfortable with the way they looked see gambling as less positive‘abiding by petty rules at school’

where an adolescent believed very often that this was true experienced higher ATG scoresThis may indicate more obedient adolescents were less likely to participate in gambling activitiesSlide21

Relationship between ATG scale and perceived social protective factorsNo main effects found for positive relationships with friendsSignificant differences emerged in family relationships‘My family is sensitive to my personal needs‘I have a deep sharing relationship with a number of members of my family’With positive family relationships, adolescents saw gambling as more harmfulFinally, strongly disagreeing with ‘My teachers show me

respect’perceived lower level of respect was associated with higher gambling riskSlide22

Cigarettes/alcoholSlide23

Substance use/ATGCigarettes (F(4, 975) = 4.38, p <.01; Boneferroni correction < .05)

Alcohol (F(4, 992) = 6.23, p <.001; Boneferroni correction < .05)‘never smoked’ (ATG: M = 31.87, SE = 1.22) and ‘sometimes smoked’

(ATG: M = 24.94, SE = 1.93). Alcohol (F(4, 975) = 6.23, p <.001; Boneferroni correction < .05) ‘never drinks alcohol daily’ (ATG: M = 33.52, SE = 1.34) and ‘infrequent drinkers’ (ATG: not often (M = 31.41, SE = 1.40) sometimes (M = 29.40, SE = 1.37)). Slide24

Other behavioral issuesNutritionlottery players‘never’ bought tickets (M = 4.00, SE = .16)‘not often’ bought tickets (M = 3.37, SE = .23). Adolescents who did not buy lottery tickets had a better healthy intake (F(4, 1008) = 3.99, p <.01; Boneferroni correction < .05).

Card playersnever’ played cards (M = 2.13, SE = .1923)‘sometimes played’ (M = 2.65, SE = .20). Adolescents using less salt did no play cards(F(4, 1002) = 4.22, p <.01; Boneferroni correction < .05). ‘very often’ (M = 3.05, SE = .29)‘never’ (M = 1.97, SE = .17).

Adolescents who ‘eat junk food daily’ (F(4, 990) = 7.19, p <.001; Boneferroni correction < .05)ATGeats regularly (F(4, 992) = 2.77, p <.05; Boneferroni correction < .05). This related to those who had very disrupted eating patterns had a stronger positive attitude to gambling being a good thingA significant difference was observed in response to eating ‘junk’ food daily (F(4, 968) = 4.39, p <.01; Boneferroni correction < .05)‘never eat junk food daily’ (ATG: M = 36.36, SE = .44)‘always eat junk food daily’ (ATG: M = 33.18, SE = .97)Slide25

Nutrition—‘eat at regular times during the day’


M(SD)Inferential statisticsSports Betting    Never3.11(.18)  Often2.17(.09)F(4, 1005) = 4.02, p <.01Lotteries  

  Never3.57(.15)  Sometimes2.92(.22)F(4, 1005) = 2.36, p <.05Sports bettors who ‘often gambled’ were significantly lesss likely to have regular meal times than those who ‘did not’ bet on sports at allLottery gamblers who

‘sometimes’ bought lottery tickets compared to those who ‘did not’ buy lottery tickets at allSlide26

Exercise—play sports…at least three times weekly and ‘gets daily exercise’Increased frequency of sports betting also indicated higher levels of sports playing (F(4, 1005) = 21.47, p <.001; Boneferroni correction < .

05)Took regular exercise (F(4, 1005) = 7.59, p <.001; Boneferroni correction < .05)A

multiple regression analysis where both exercise variables were computed with sports betting revealed a strong linear relationship (F(2, 1023) = 56.77, p <.001). Slide27

Psychological distress and attitudes to gambling in Ghanaian adolescentsAs with overall attitudes to gambling; positive belief in gambling was related to gender and residential status and overall lower wellbeingSlide28

GHQ-12/ATGSlide29

ConclusionMales were more likely to view gambling as a positive activity and were higher frequency players on all forms of gamblingNone boarding students also had a more positive attitude to gambling and experienced lower wellbeingSlide30

Conclusion Card playersBetter adjusted than other gamblersMay be a family social eventSports bettorsAdolescents who experience some disharmony at home and school have higher frequency playgenerally high risk/impulsive groupLotteriesParent/teacher negative views of the adolescents appearance led to higher lottery participationLarge payout may be a way to change appearanceSlot machinesNegative peer issues reflected higher participation

Used as a means of escapeSlide31

ConclusionSocial difficultiesSelf confidence and obedient adolescents perceived gambling as a negative activitySocial protective factorsEmotionally stable family relationships and positive relationships with teachers indicated less positive attitudes to gambling Slide32

Risk behaviorGeneral risky behavior associated with both higher frequency gambling and lower ATG scoresSlide33

Brief comparisonAustralia/Ghana

Cards/sports/slots: Ghana adolescents  GHQ-12/ATG scores at higher frequency of play (

p < .001)Lottery: Australian adolescents  GHQ-12/ATG scores at higher frequency of play (p < .001)Frequency: Ghana adolescents  Frequency  gambling risk/wellbeingSlide34

Gambling severityVGSSlide35

Addiction Therapy – 2015 Website:

addictiontherapy.conferenceseries.comMeet the eminent gathering once again at

Addiction Therapy-2015Florida, USAAugust 3 - 5, 2015